Logback Socket Log Collection Best Practices
Overview
For a company, Guance workspaces collect logs from multiple applications. A common challenge is distinguishing which Service these logs originate from. In this guide, we will explore how to use Pipelines to add a Service tag to logs so you can identify their source.
DataKit supports many log collection methods. This article focuses on collecting logs via Socket from a Java Spring Boot application, where logs are sent to DataKit through Logback's Socket appender. First, the Ops team enables the Socket collector in DataKit and restarts DataKit. Then, the developer adds an Appender in the application's logback-spring.xml file and declares springProperty to pass the Service name into the log when starting the JAR. Next, the developer starts the JAR and passes the Service name to be written to the log. Finally, the developer logs into Guance, creates a new Pipeline under the Pipelines tab in the Log module, and specifies the Source of the Socket collector opened by Ops. This way, the log will be tagged and can be distinguished.
The solution below is presented from both the Ops and developer perspectives.
Solution
Operations
Linux Environment
1 Enable the Collector
Log in to the Linux server where DataKit is deployed, and create the logging-socket.conf file.
Contents of logging-socket.conf:
      [[inputs.logging]]
        # only two protocols are supported:TCP and UDP
        sockets = [
          "tcp://0.0.0.0:9542",
        #"udp://0.0.0.0:9531",
        ]
        ignore = [""]
        source = "socketdefault"
        service = ""
        pipeline = ""
        ignore_status = []
        character_encoding = ""
        # multiline_match = '''^\S'''
        remove_ansi_escape_codes = false

        [inputs.logging.tags]
        # some_tag = "some_value"
        # more_tag = "some_other_value"
2 Restart DataKit
Kubernetes Environment
Log in to Guance, go to Integration -> Datakit -> Kubernetes, and follow the instructions to install DataKit. The datakit.yaml used for deployment will need to be modified. The steps are: create the logging-socket.conf file and mount it into DataKit.
1 Add Configuration to ConfigMap
    logging-socket.conf: |-
      [[inputs.logging]]
        # only two protocols are supported:TCP and UDP
        sockets = [
          "tcp://0.0.0.0:9542",
        #"udp://0.0.0.0:9531",
        ]
        ignore = [""]
        source = "pay-socket-service"
        service = ""
        pipeline = ""
        ignore_status = []
        character_encoding = ""
        # multiline_match = '''^\S'''
        remove_ansi_escape_codes = false

        [inputs.logging.tags]
        # some_tag = "some_value"
        # more_tag = "some_other_value"
2 Mount logging-socket.conf
        - mountPath: /usr/local/datakit/conf.d/log/logging-socket.conf
          name: datakit-conf
          subPath: logging-socket.conf
3 Restart DataKit
Parameter Descriptions
sockets: Protocol and port.ignore: File path filter using glob rules. Files matching any filter condition will not be collected.source: Data source.service: Add a tag. If empty, defaults to$source.pipeline: Path to the Pipeline script.character_encoding: Encoding selection.multiline_match: Multi-line matching.remove_ansi_escape_codes: Whether to remove ANSI escape codes (e.g., text color in standard output). Values:trueorfalse.
Development
1 Add Dependency
Add the following dependency to the project's pom.xml:
<dependency>
    <groupId>net.logstash.logback</groupId>
    <artifactId>logstash-logback-encoder</artifactId>
    <version>4.9</version>
</dependency>
2 Add Appender to Log Configuration
In this step, we define the DataKit address, Socket port, Service, and Source as externally configurable parameters. Add an Appender in the project's logback-spring.xml file, defining datakitHostIP, datakitSocketPort, datakitSource, and datakitService. Their values are passed externally via guangce.datakit.host_ip, guangce.datakit.socket_port, guangce.datakit.source, and guangce.datakit.service.
<?xml version="1.0" encoding="UTF-8"?>

<configuration scan="true" scanPeriod="60 seconds" debug="false">
    <springProperty scope="context" name="datakitHostIP" source="guangce.datakit.host_ip" />
    <springProperty scope="context" name="datakitSocketPort" source="guangce.datakit.socket_port" />
    <springProperty scope="context" name="datakitSource" source="guangce.datakit.source" />
    <springProperty scope="context" name="datakitService" source="guangce.datakit.service" />

    <contextName>logback</contextName>

    <!-- Log root directory -->
    <property name="log.path" value="./logs/order"/>
    <!-- Log output format -->
    <property name="log.pattern" value="%d{yyyy-MM-dd HH:mm:ss.SSS} [%thread] %-5level %logger{20} - [%method,%line] -  - %msg%n" />

    <!-- Console appender -->
    <appender name="Console" class="ch.qos.logback.core.ConsoleAppender">
        <encoder>
            <pattern>${log.pattern}</pattern>
        </encoder>
    </appender>

    ...

    <appender name="socket" class="net.logstash.logback.appender.LogstashTcpSocketAppender">
        <destination>${datakitHostIP:-}:${datakitSocketPort:-}</destination>
        <encoder class="net.logstash.logback.encoder.LoggingEventCompositeJsonEncoder">
            <providers>
                <timestamp>
                    <timeZone>UTC+8</timeZone>
                </timestamp>
                <pattern>
                    <pattern>
                        {
                        "severity": "%level",
                        "source": "${datakitSource}",
                        "service": "${datakitService}",
                        "method": "%method",
                        "line": "%line",
                        "thread": "%thread",
                        "class": "%logger{40}",
                        "msg": "%message\n%exception"
                        }
                    </pattern>
                </pattern>
            </providers>
        </encoder>
    </appender>

    <root level="INFO">
        <appender-ref ref="Console"/>
        ...
        <appender-ref ref="socket" />
    </root>
</configuration>
3 Configure Default Values
Add the following configuration to the application.yml file. These default parameters will be passed to Logback.
guangce:
  datakit:
    host_ip: 127.0.0.1  # DataKit address
    socket_port: 9542   # DataKit socket port
    #source: mySource   # If not set, the source defined in the socket collector will be used
    #service: myService # If not set, the service defined in the socket collector will be used
4 Run the Application
1 Linux Environment
Execute the following command to start the application. If no parameters are passed, the default values from application.yml will be used.
java -jar pay-service-1.0-SNAPSHOT.jar --guangce.datakit.host_ip=172.26.0.231 --guangce.datakit.socket_port=9542 --guangce.datakit.source=pay-socket-source --guangce.datakit.service=pay-socket-service
2 Kubernetes Environment
Add PARAMS in the Dockerfile to accept externally passed parameters.
FROM openjdk:8u292
RUN echo 'Asia/Shanghai' >/etc/timezone


ENV jar pay-service-1.0-SNAPSHOT.jar
ENV workdir /data/app/
RUN mkdir -p ${workdir}
COPY ${jar} ${workdir}
WORKDIR ${workdir}
ENTRYPOINT ["sh", "-ec", "exec java ${JAVA_OPTS} -jar ${jar} ${PARAMS} 2>&1 > /dev/null"]
docker build -t 172.16.0.238/df-demo/istio-pay:v1 -f DockerfilePay .
docker push 172.16.0.238/df-demo/istio-pay:v1
Create the pay-deployment.yaml file. Add the PARAMS environment variable, passing the values for guangce.datakit.host_ip, guangce.datakit.socket_port, guangce.datakit.source, and guangce.datakit.service. If not passed, the default values will be used.
apiVersion: apps/v1
kind: Deployment
metadata:
  name: istio-pay-deployment
spec:
  replicas: 1
  selector:
    matchLabels:
      app: istio-pay-pod
  template:
    metadata:
      labels:
        app: istio-pay-pod
    spec:
      containers:
      - env:
        - name: POD_NAME
          valueFrom:
            fieldRef:
              fieldPath: metadata.name
        - name: DD_AGENT_HOST
          valueFrom:
            fieldRef:
              apiVersion: v1
              fieldPath: status.hostIP
        - name: PARAMS
          value: "--guangce.datakit.host_ip=$(DD_AGENT_HOST) --guangce.datakit.socket_port=9542 --guangce.datakit.source=pay-socket-source --guangce.datakit.service=pay-socket-service"

        name: pay-container
        image: 172.16.0.238/df-demo/istio-pay:v1
        ports:
        - containerPort: 8091
          protocol: TCP
        resources:
          limits:
            memory: 512Mi
          requests:
            memory: 256Mi

      restartPolicy: Always
      volumes:
      - emptyDir: {}
        name: datadir
5 Configure Pipeline
Since the logs output by the Socket Appender are in JSON format, DataKit needs to use a Pipeline to extract the JSON fields. The source and service are default tags, so set_tag is required.
Log in to Guance, go to Logs -> Pipelines, click Create Pipeline, and select the source name socketdefault that was defined in the Socket collector configuration. Define the parsing rules as follows:
        json(_,msg,"message")
        json(_,class,"class")
        json(_,thread,"thread")
        json(_,severity,"status")
        json(_,method,"method")
        json(_,line,"line")
        json(_,source,"source")
        json(_,service,"service")
        json(_,`@timestamp`,"time")
        set_tag(service)
        set_tag(source)
        default_time(time)
After testing with a log sample, click Save. Note that the parsing rules correspond to the pattern defined in the logback-spring.xml file.
                    <pattern>
                        {
                        "severity": "%level",
                        "source": "${datakitSource}",
                        "service": "${datakitService}",
                        "method": "%method",
                        "line": "%line",
                        "thread": "%thread",
                        "class": "%logger{40}",
                        "msg": "%message\n%exception"
                        }
Viewing Log Files
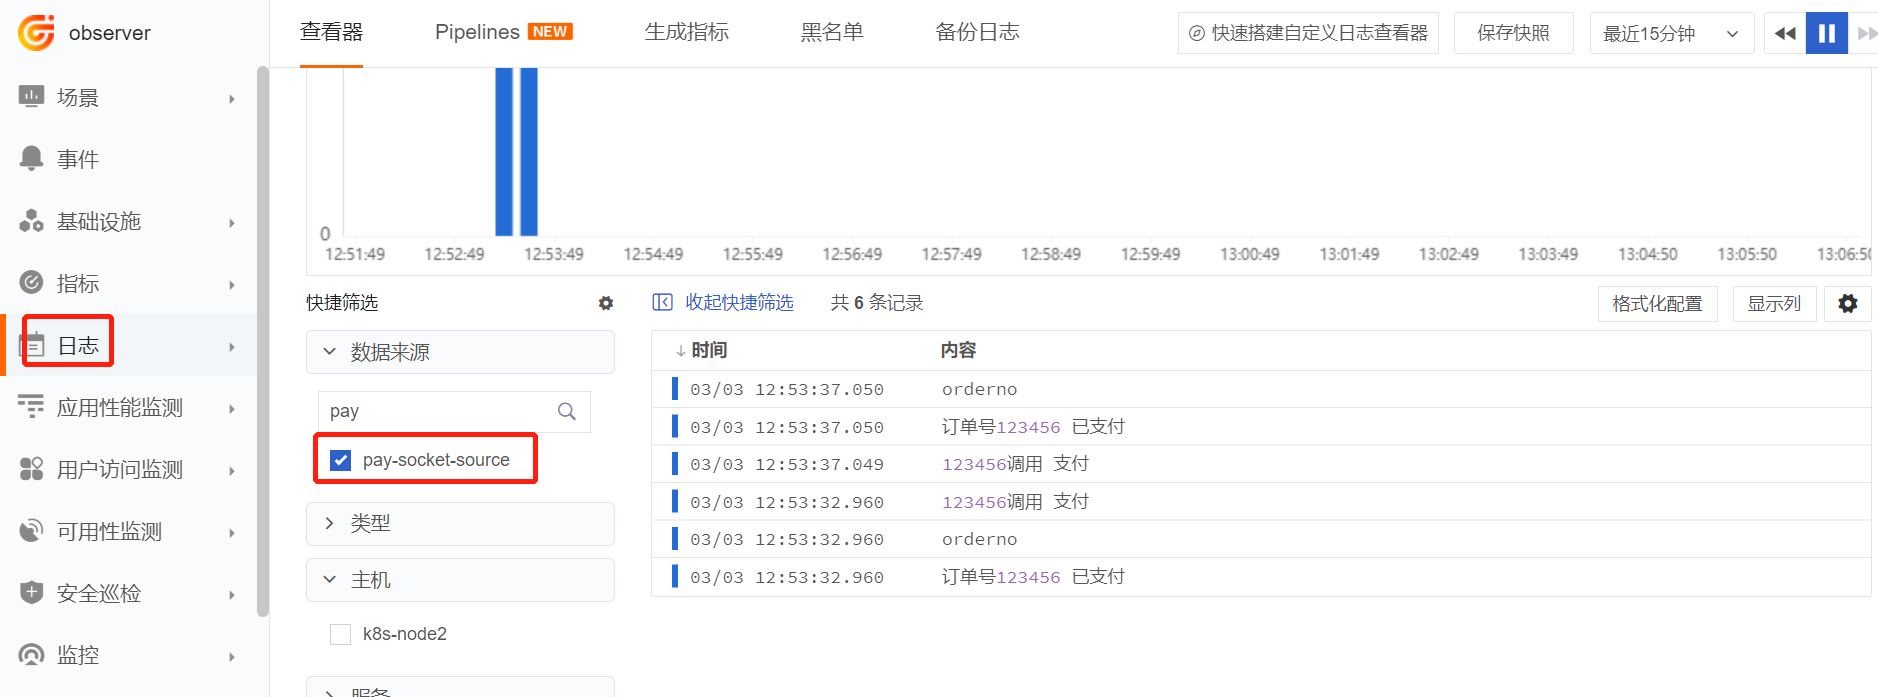
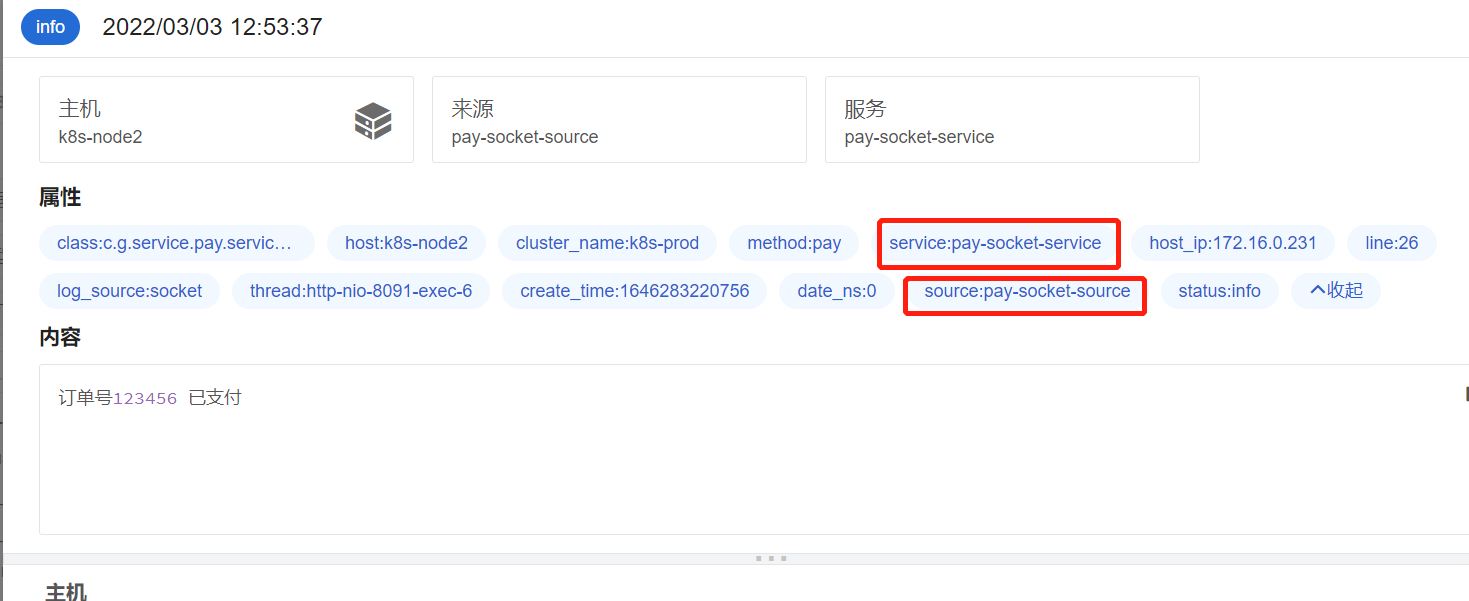
Access the application's API to generate logs. Log in to Guance, go to Logs -> Data Collection -> select pay-socket-source to view the log details. Here you can see that source and service have been replaced by the externally passed parameters.