Analysis Dashboard
In Agent Monitoring > Analysis Dashboard, you can view multiple metrics information for selected applications in chart form, comprehensively grasping application performance and cost distribution.
The top of the page supports switching between Agent / LLM status, entering the Agent status by default.
Note
When there is no data within the selected time period, the chart area will display a "No data" status. You can adjust the viewing range using the time widget in the upper right corner.
LLM Monitoring Application
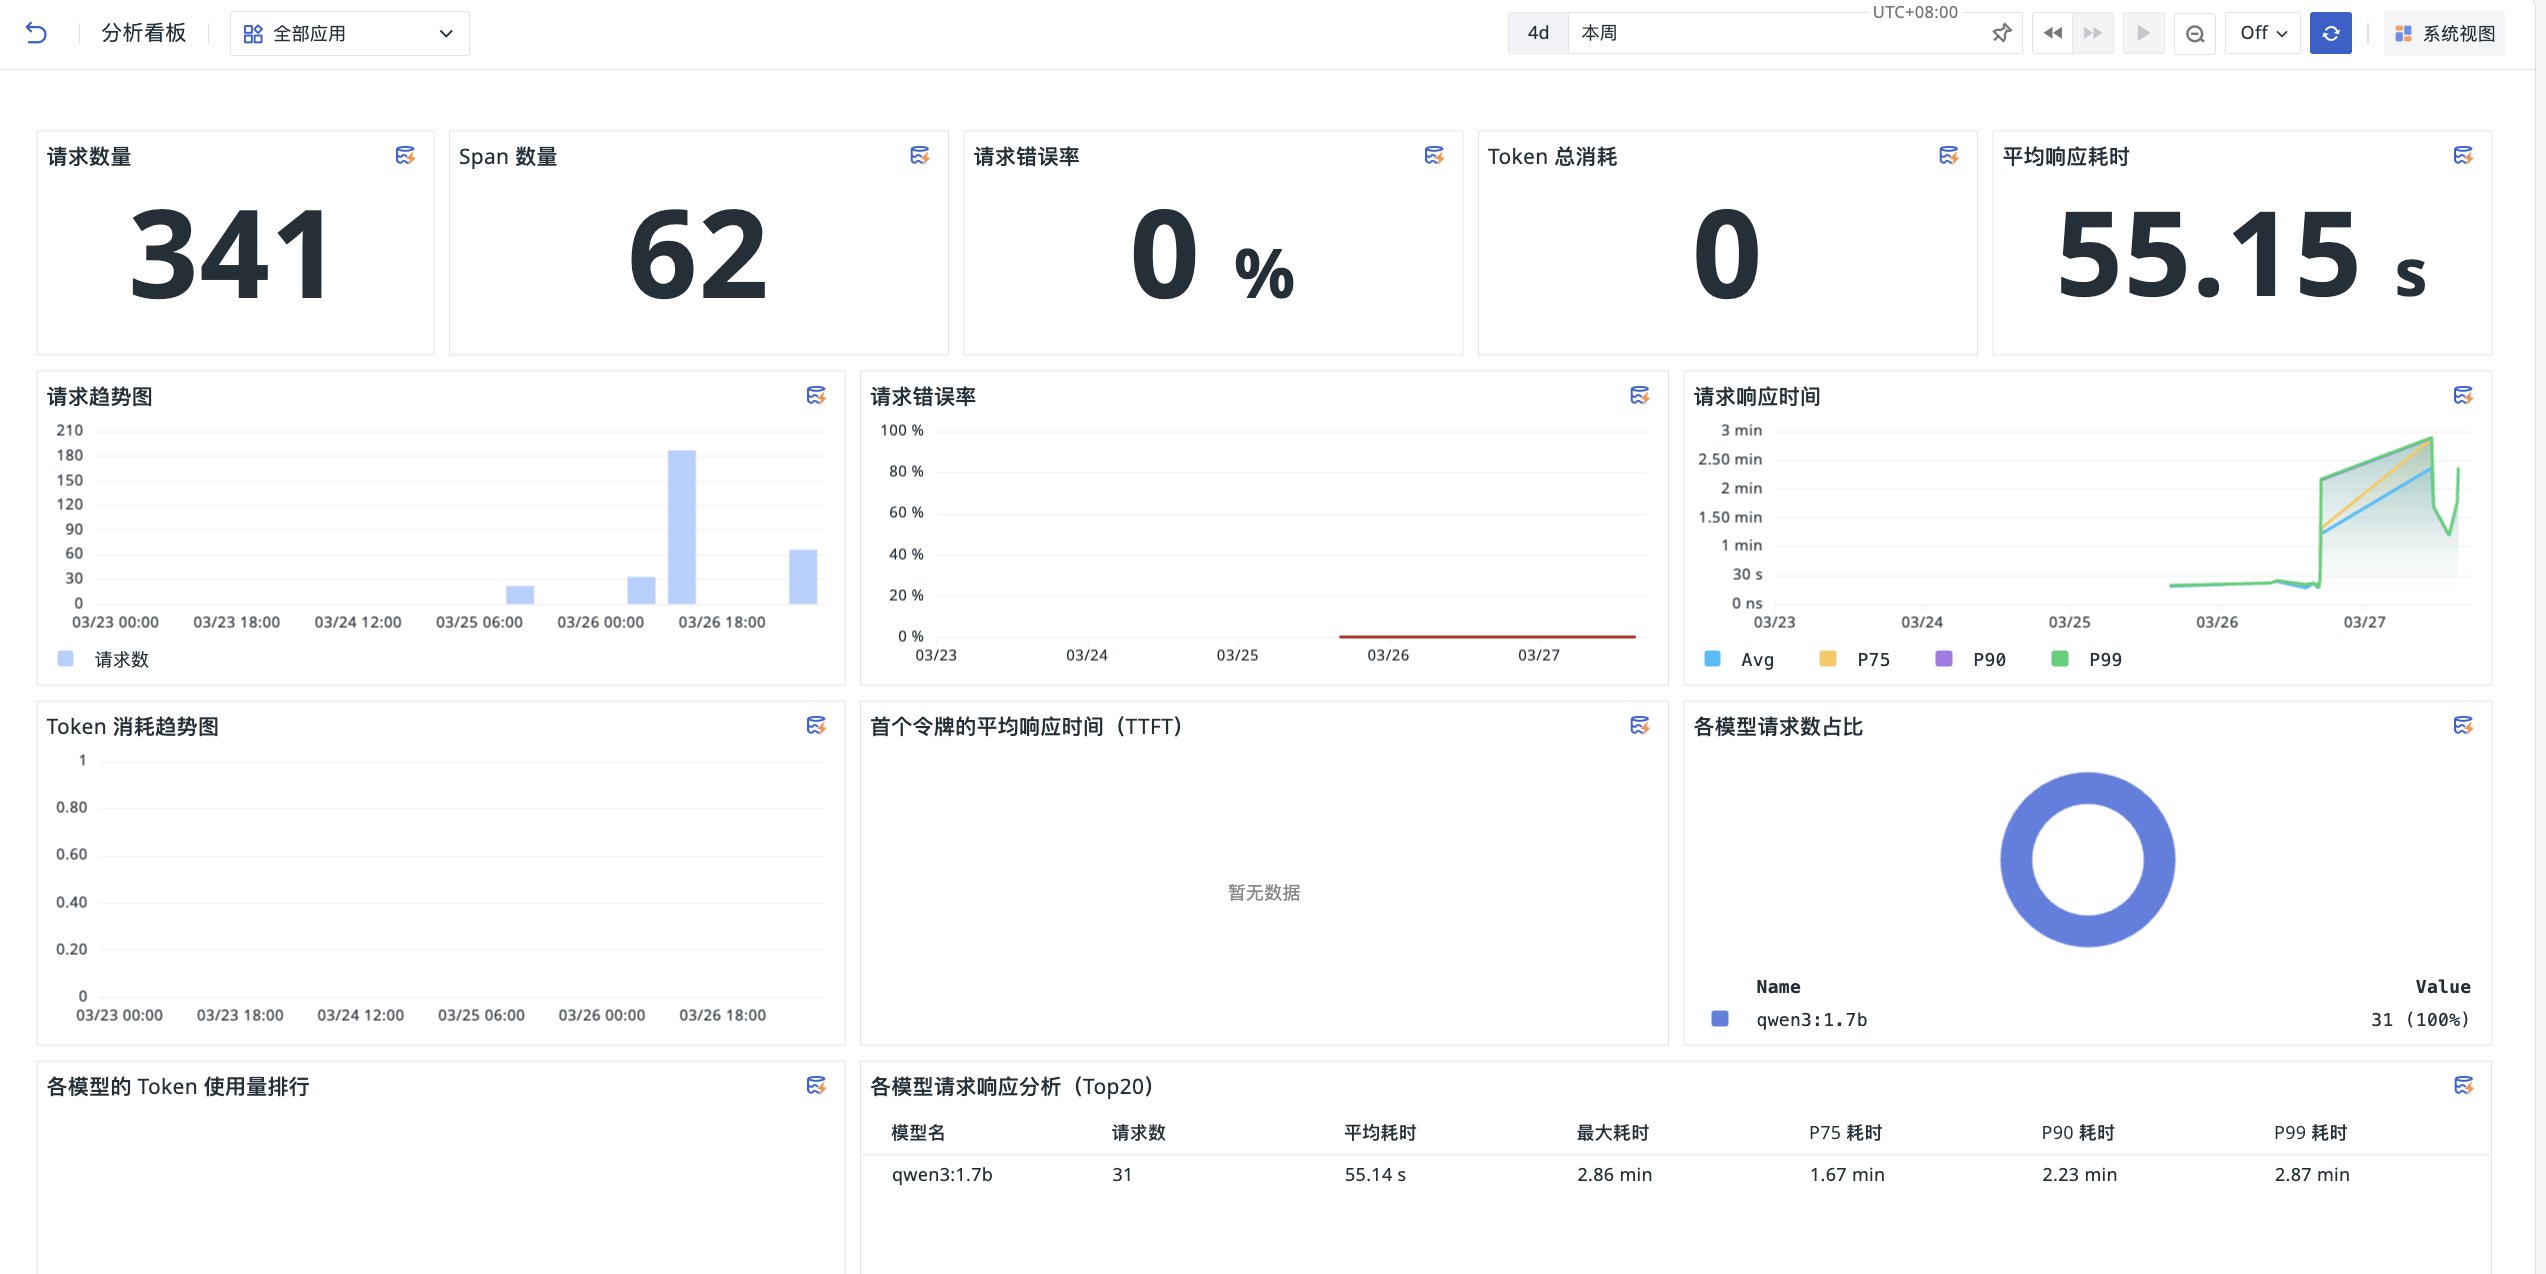
After selecting an LLM monitoring application, the Analysis Dashboard displays the following content.
Core Metrics Overview
The top of the dashboard displays key metric statistics for the selected time range:
- Request Count: Total number of requests
- Span Count: Total number of associated Span invocations
- Request Error Rate: Percentage of failed requests out of total requests
- Total Token Consumption: Total Token consumption for all requests
- Average Response Time: Average processing time for all requests
Trend Analysis Charts
Through multi-dimensional trend charts, you can track changes in application performance and usage trends:
- Request Trend Chart: View request volume distribution across different time periods, identify usage peaks
- Request Error Rate: Display error rate change trends, quickly detect abnormal fluctuations
- Request Response Time: Display Avg, P75, P90, P99 percentile latencies, locate long-tail latency issues
- Token Consumption Trend Chart: Display Token usage distribution over time, assisting in cost forecasting
- Average Time to First Token (TTFT): Measure first-token delay, reflecting model response speed
Model and User Analysis
Analyze resource usage and performance from model and user dimensions:
- Request Proportion by Model: Donut chart showing invocation distribution across different models (e.g., qwen3:1.7b)
- Token Usage Ranking by Model: Compare resource consumption across different models
- Request Response Analysis by Model (Top 20): Table showing detailed performance metrics for each model, such as request count, average/maximum latency, percentile latencies
- User Request Ranking (Top 10): Identify high-frequency users
- User Token Consumption Ranking (Top 10): Locate high-cost users, assisting in cost allocation
Agent Monitoring Application
After selecting an Agent monitoring application, the Analysis Dashboard displays content in four modules: Request, Model, Skill, and Tool.
Request Module
- Average Request Duration: Latency fluctuations for different Agents over a time range
- Total Request Trend: Total request trend for different Agents over a time range Clicking on a point or selecting a time range can bring the time into the jump to view details for the corresponding Agent.
Model Module
- Model Usage Ranking: View invocation popularity of each model
- Model Average Request Duration: Compare response latency trends of different models, quickly identifying performance differences
- Model Token Consumption Ranking: View Token consumption ranking of models, helping clarify costs
Skill Module
- Skill Usage Ranking: View usage popularity of Skills, facilitating optimization of invocation strategies
- Skill Average Request Duration: Compare execution fluctuations of different Skills
Tool Module
- Tool Invocation Ranking: View invocation count ranking of each Tool
- Tool Average Invocation Duration: Statistics on average execution time for each Tool
- Tool Maximum Invocation Duration: Statistics on maximum execution time for each Tool
- Tool Minimum Invocation Duration: Statistics on minimum execution time for each Tool
Further Reading
You might be interested in: