Swarm Bee Observability Best Practices
Introduction
Swarm is an official part of the Ethereum project, primarily developed by the foundation, allowing mining pools to store, bandwidth, and computational power resources to support applications based on the Ethereum network. The team aims to create a system that never goes down, has zero failures, and is censorship-resistant peer-to-peer storage and service solutions. Creating an economic incentive system within Swarm will promote the payment and transfer of value for resource exchanges, utilizing different protocols and technologies from the Ethereum blockchain. Swarm's decentralized content storage and distribution service can be viewed as a CDN, distributing it across computers over the internet. It can be run like an Ethereum node, running a Swarm node and connecting to the Swarm network. This is similar to BitTorrent and can also be analogous to IPFS, using ETH as a reward incentive. Files are broken into chunks, distributed, and stored by participating volunteers. Nodes providing storage and services for these chunks receive ETH as compensation from nodes requiring storage and retrieval data services. Swarm does not adopt a mining model, so there are no block rewards; instead, rewards are obtained through interactions with other nodes, receiving checks that can be exchanged for BZZ. Therefore, the network environment and node status of the BZZ cluster are particularly important.
-
Bee
-
CPUs
- Memory
- Disk
- Network
Scenario Views
Built-in Views
Disk
Prerequisites
DataKit already installed (DataKit Installation Documentation)
Docker already installed and Docker Swarm initialized (Docker Installation Reference)
Configuration
Configure Prom Exporter
Enter the conf.d/prom directory under the DataKit installation directory, copy prom.conf.sample and rename it to prom.conf. Example as follows:
 ## Exporter address
  url = "http://127.0.0.1:1635/metrics"

  ## Metric type filtering, optional values are counter, gauge, histogram, summary
  # By default, only counter and gauge types of metrics are collected
  # If empty, no filtering will occur
  metric_types = ["counter", "gauge"]

  ## Metric name filtering
  # Supports regular expressions, multiple configurations can be made, satisfying any one of them is sufficient
  # If empty, no filtering will occur
  # metric_name_filter = ["cpu"]

  ## Measurement name prefix
  # Configuring this option adds a prefix to the measurement name
  # measurement_prefix = "prom_"

  ## Measurement name
  # By default, the metric name will be split by underscores "_", with the first field after splitting becoming the measurement name, and the remaining fields as the current metric name
  # If measurement_name is configured, then the metric name will not be split
  # The final measurement name will add the measurement_prefix prefix
  # measurement_name = "prom"

  ## Collection interval "ns", "us" (or "µs"), "ms", "s", "m", "h"
  interval = "10s"

  ## TLS configuration
  tls_open = false
  # tls_ca = "/tmp/ca.crt"
  # tls_cert = "/tmp/peer.crt"
  # tls_key = "/tmp/peer.key"

  ## Custom measurement names
  # Metrics containing the prefix can be grouped into one class of measurements
  # Custom measurement name configuration takes precedence over the measurement_name configuration item
  #[[inputs.prom.measurements]]
  #  prefix = "cpu_"
  #  name = "cpu"

  # [[inputs.prom.measurements]]
  # prefix = "mem_"
  # name = "mem"

  ## Custom Tags
  [inputs.prom.tags]
  bee_debug_port = "1635"
  # more_tag = "some_other_value"
Configure Swarm API Service Collector
Install Dataflux Func
Modify DataKit
Enter the conf.d directory under the DataKit installation directory, modify the http_listen in the datakit.conf file. Example as follows:
http_listen = "0.0.0.0:9529"
log = "/var/log/datakit/log"
log_level = "debug"
log_rotate = 32
gin_log = "/var/log/datakit/gin.log"
protect_mode = true
interval = "10s"
output_file = ""
default_enabled_inputs = ["cpu", "disk", "diskio", "mem", "swap", "system", "hostobject", "net", "host_processes", "docker", "container"]
install_date = 2021-05-14T05:03:35Z
enable_election = false
disable_404page = false

[dataway]
  urls = ["https://openway.dataflux.cn?token=tkn_9a49a7e9343c432eb0b99a297401c3bb"]
  timeout = "5s"
  http_proxy = ""

[http_api]
  rum_origin_ip_header = "X-Forward-For"

[global_tags]
  cluster = ""
  host = "df_solution_ecs_004"
  project = ""
  site = ""

[[black_lists]]
  hosts = []
  inputs = []

[[white_lists]]
  hosts = []
  inputs = []
Install Func
Download DataFlux Func dependency files
After executing the command, all required files will be saved in the newly createddataflux-func-portable directory under the current directory.
In the already downloaded dataflux-func-portable directory, run the following command to automatically configure and ultimately start the entire DataFlux Func:
Please wait for the container to run, wait 30 seconds...
CONTAINER ID   IMAGE     COMMAND   CREATED   STATUS    PORTS     NAMES


Installed dir:
    /usr/local/dataflux-func
To shutdown:
    sudo docker stack remove dataflux-func
To start:
    sudo docker stack deploy dataflux-func -c /usr/local/dataflux-func/docker-stack.yaml
To uninstall:
    sudo docker stack remove dataflux-func
    sudo rm -rf /usr/local/dataflux-func
    sudo rm -f /etc/logrotate.d/dataflux-func

Now open http://<IP or Hostname>:8088/ and have fun!
http://<IP or Hostname>:8088 to see the following interface

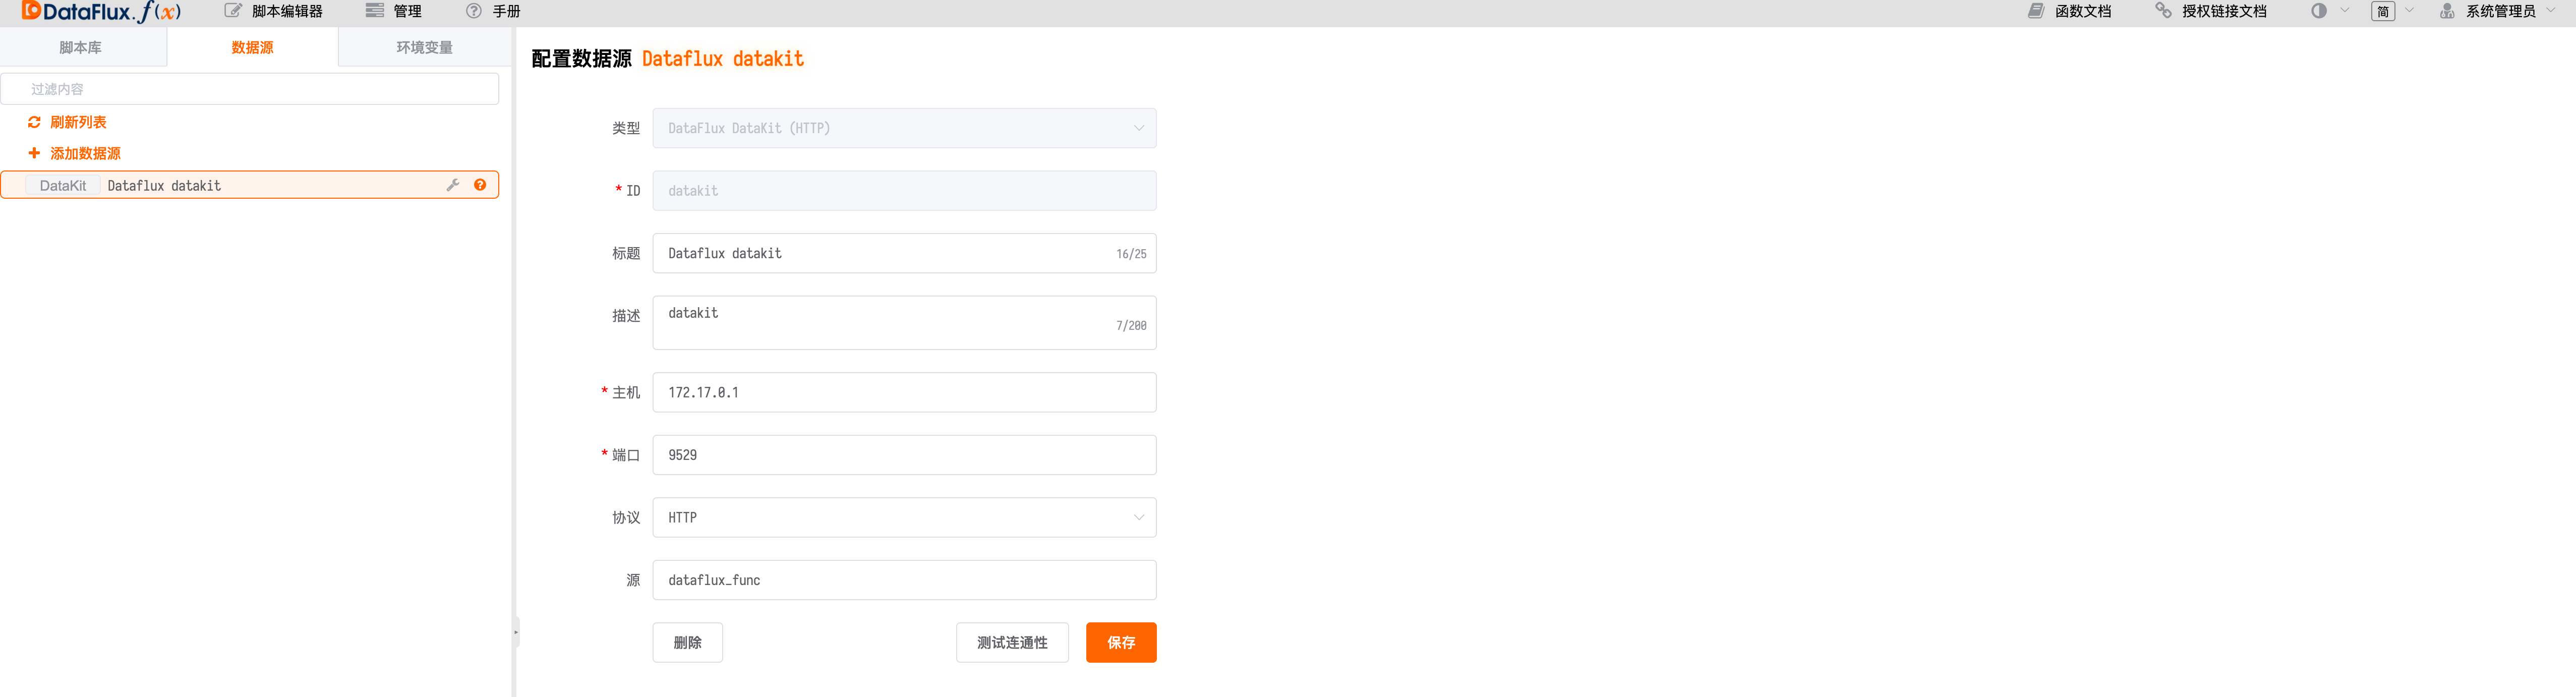
Configure DataKit Data Source for Data Reporting
Write Script for Peer Data Collection
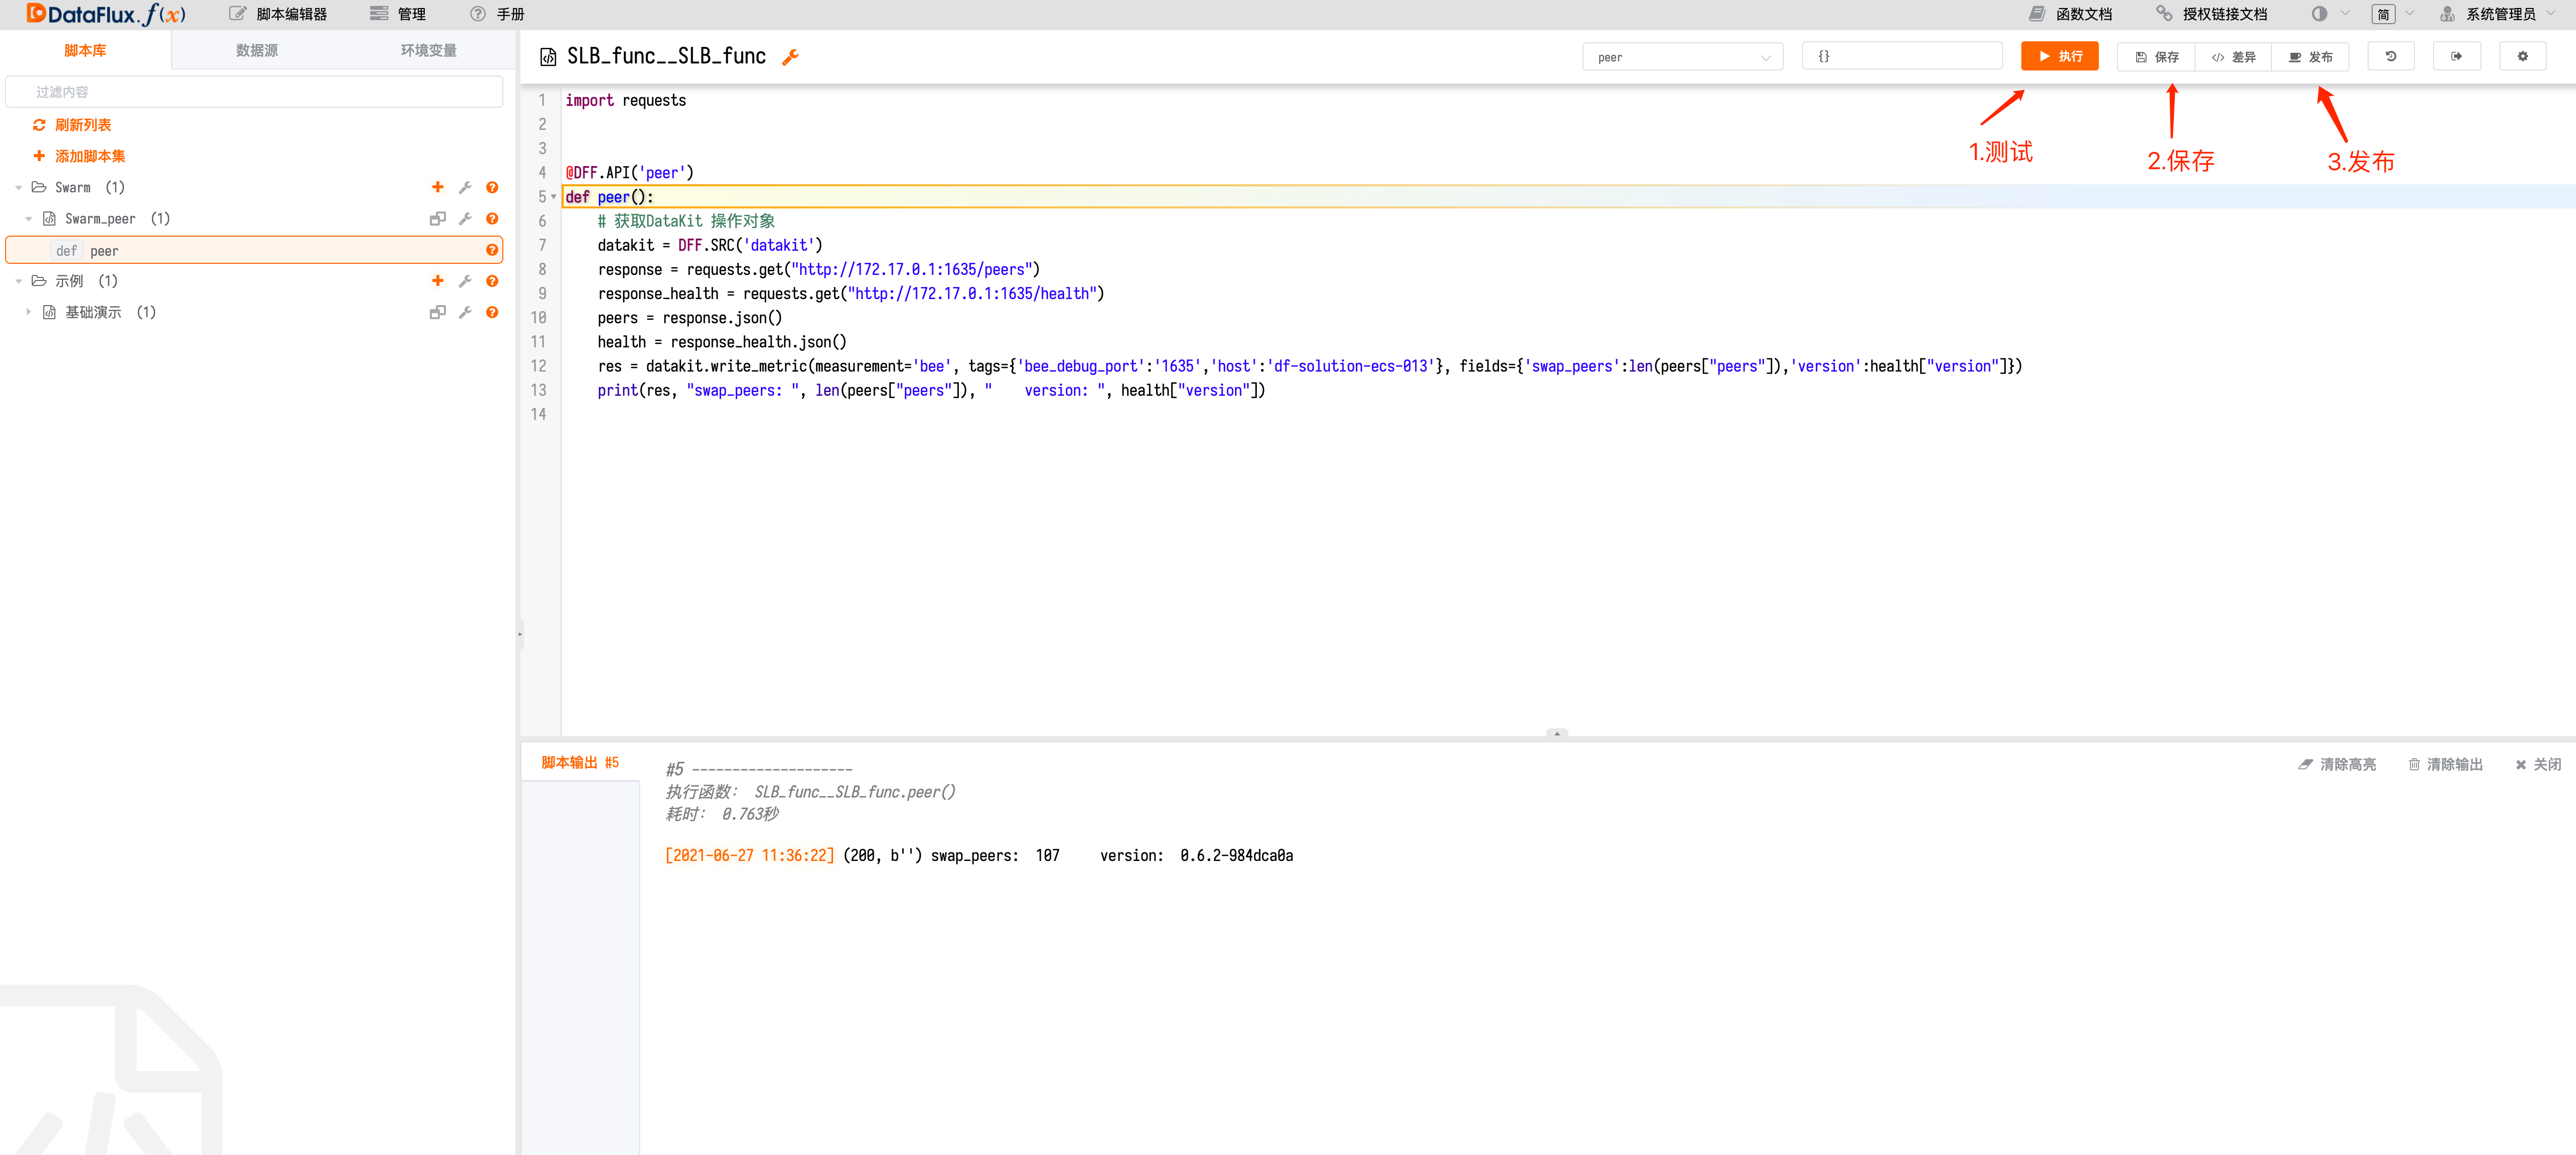
import requests


@DFF.API('peer')
def peer():
    # Get DataKit operation object
    datakit = DFF.SRC('datakit')
    response = requests.get("http://172.17.0.1:1635/peers")
    response_health = requests.get("http://172.17.0.1:1635/health")
    peers = response.json()
    health = response_health.json()
    res = datakit.write_metric(measurement='bee', tags={'bee_debug_port':'1635','host':'df-solution-ecs-013'}, fields={'swap_peers':len(peers["peers"]),'version':health["version"]})
    print(res, "swap_peers: ", len(peers["peers"]), "    version: ", health["version"])
Since DataFlux Func runs via Docker Stack and bridges to the host machine’s
docker0, it is not directly connected to the local network of the host machine. Therefore, even if DataFlux Func and DataFlux DataKit are installed on the same server, DataFlux DataKit's listening port cannot simply be bound to the local network (127.0.0.1).At this point, the configuration should be modified to bind the listening port to
docker0(172.17.0.1) or0.0.0.0. Note that you need to change the swarm bee configuration to add0.0.0.0before the local listening port:1635.
The data obtained via API request will be inserted into the corresponding measurement with appropriate tags added for easy display in the studio.
Create Automatic Trigger Execution for Function Scheduling in Management

Select the function just written, set up a scheduled task, add validity period, and click save.
Scheduled tasks can trigger at shortest intervals of 1 minute. For special needs, you can use while + sleep to increase data collection frequency.
View Function Running Status via Automatic Trigger Configuration

If it shows success, congratulations! You can now check your reported metrics in the studio.
Monitoring Metrics Description
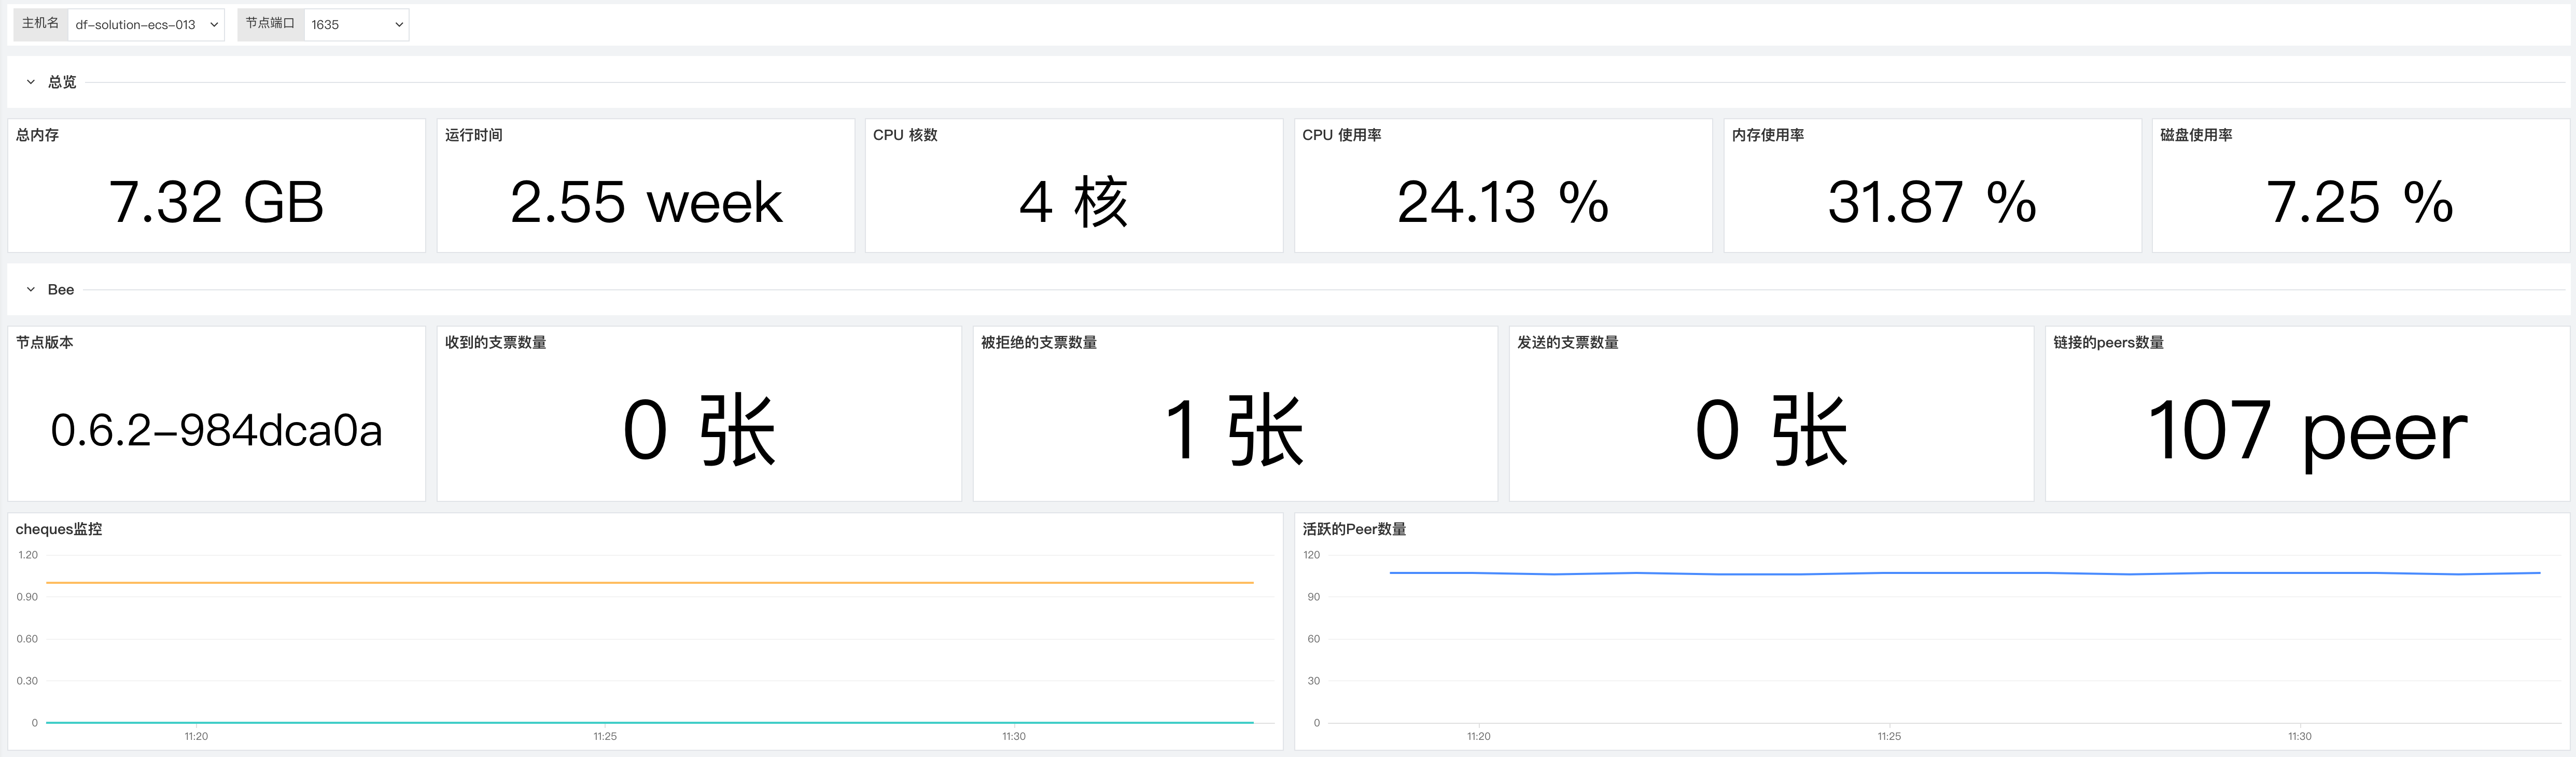
1 Bee
Monitor multiple Harvesters in real-time, analyze the availability, status, and earnings of different Harvesters, continuously enhancing Chia users' control over Harvesters.
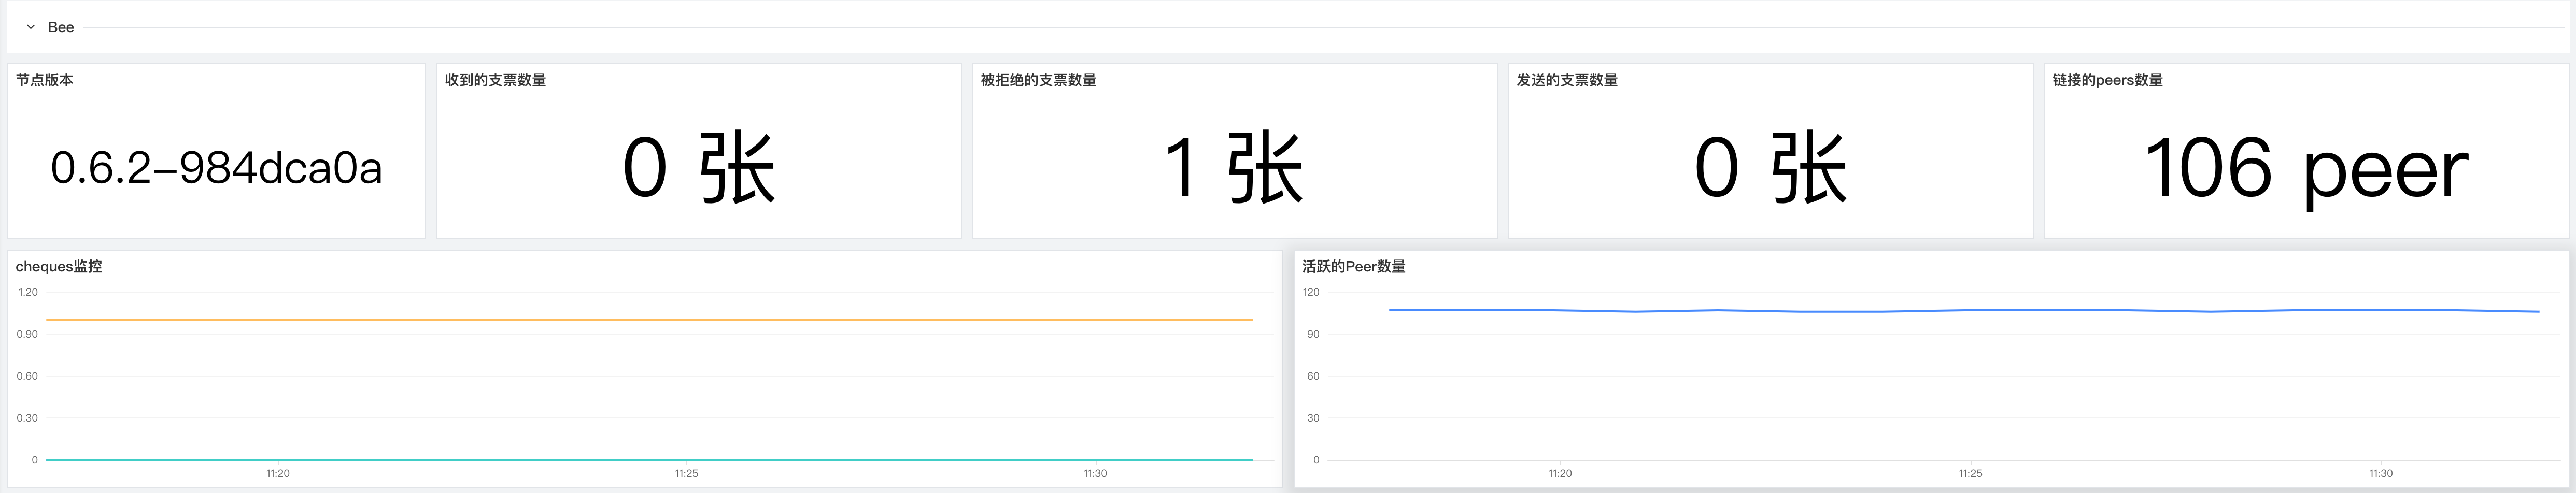
| Metric Description | Name | Measurement Standard |
|---|---|---|
| Number of received checks | bee.swap_cheques_received |
Earnings metrics |
| Number of rejected checks | bee.swap_cheques_rejected |
Earnings metrics |
| Number of sent checks | bee.swap_cheques_sent |
Earnings metrics |
| Number of linked peers | bee.swap_peers |
Performance metrics |
Number of Rejected Checks
To ensure stable daily earnings, always pay attention to the number of rejected checks. When the number of rejected checks rises rapidly, promptly investigate the status of the Bee node and network to ensure stable daily earnings.
Number of Linked Peers
To ensure earnings and network stability, monitor the number of linked peers. Normally, when the network and node statuses are healthy, the number of linked peers remains stable within a range without significant fluctuations. When you notice significant fluctuations in the number of linked peers, promptly investigate the status of the Bee node and network to ensure stable earnings.
2 CPU Monitoring
CPU monitoring helps analyze CPU load peaks and identify excessive CPU activity. Through CPU monitoring metrics, you can improve CPU capabilities or reduce loads, find potential issues, and avoid unnecessarily high costs due to upgrades. CPU monitoring metrics can also help you identify unnecessary background processes running and determine the resource utilization of processes or applications and their impact on the entire network.
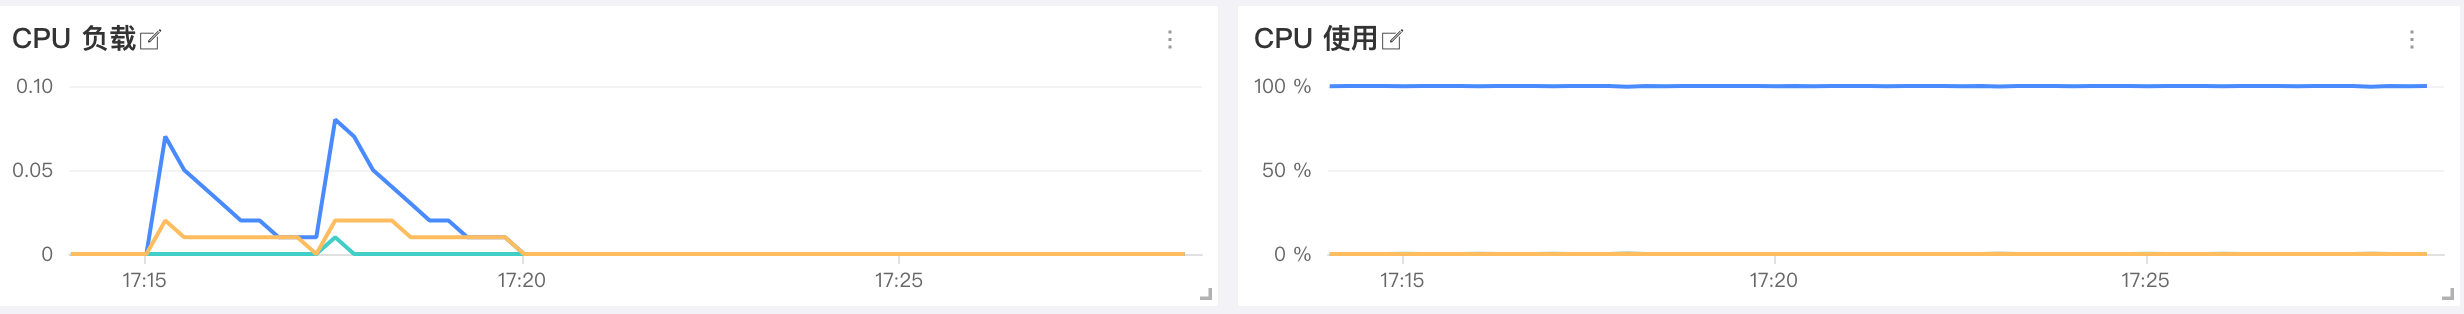
| Metric Description | Name | Measurement Standard |
|---|---|---|
| CPU Load | system.load1system.load5system.load15 |
Resource Utilization |
| CPU Usage | cpu.usage_idlecpu.usage_usercpu.usage_system |
Resource Utilization |
CPU Usage
CPU usage can be divided into: User Time (percentage of time spent executing user processes); System Time (percentage of time spent executing kernel processes and interrupts); Idle Time (percentage of time the CPU is in Idle state). For CPU performance, first, the run queue for each CPU should not exceed 3. Secondly, if the CPU is at full load, User Time should be around 65%~70%, System Time around 30%~35%, and Idle Time around 0%~5%.
3 Memory Monitoring
Memory is one of the main factors affecting Linux performance, and the adequacy of memory resources directly impacts the performance of application systems.
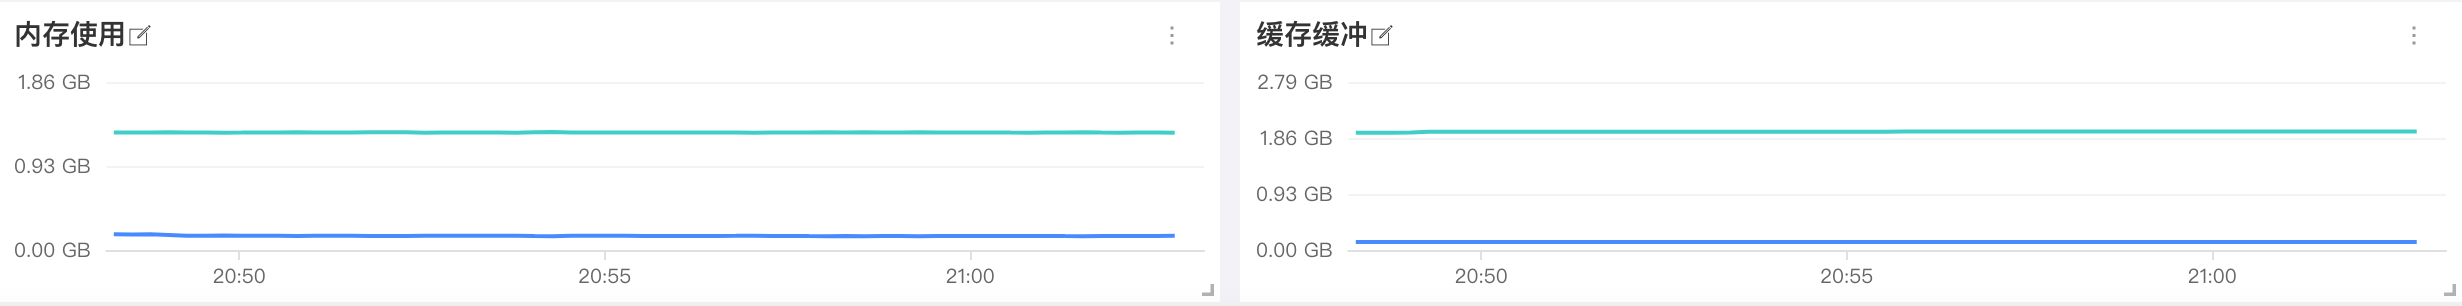
| Metric Description | Name | Measurement Standard |
|---|---|---|
| Memory Usage Rate | mem.used_percent |
Resource Utilization |
| Memory Usage | mem.freemem.used |
Resource Utilization |
| Memory Cache | mem.buffered |
Resource Utilization |
| Memory Buffer | mem.cached |
Resource Utilization |
Memory Usage Rate
It is crucial to closely monitor the usage of available memory because contention for RAM will inevitably lead to paging and performance degradation. To keep the machine running smoothly, ensure it has enough RAM to meet your workload. Persistent low memory availability can cause segmentation faults and other serious issues. Remedies include increasing the physical memory capacity of the system, and if possible, enabling memory page merging.
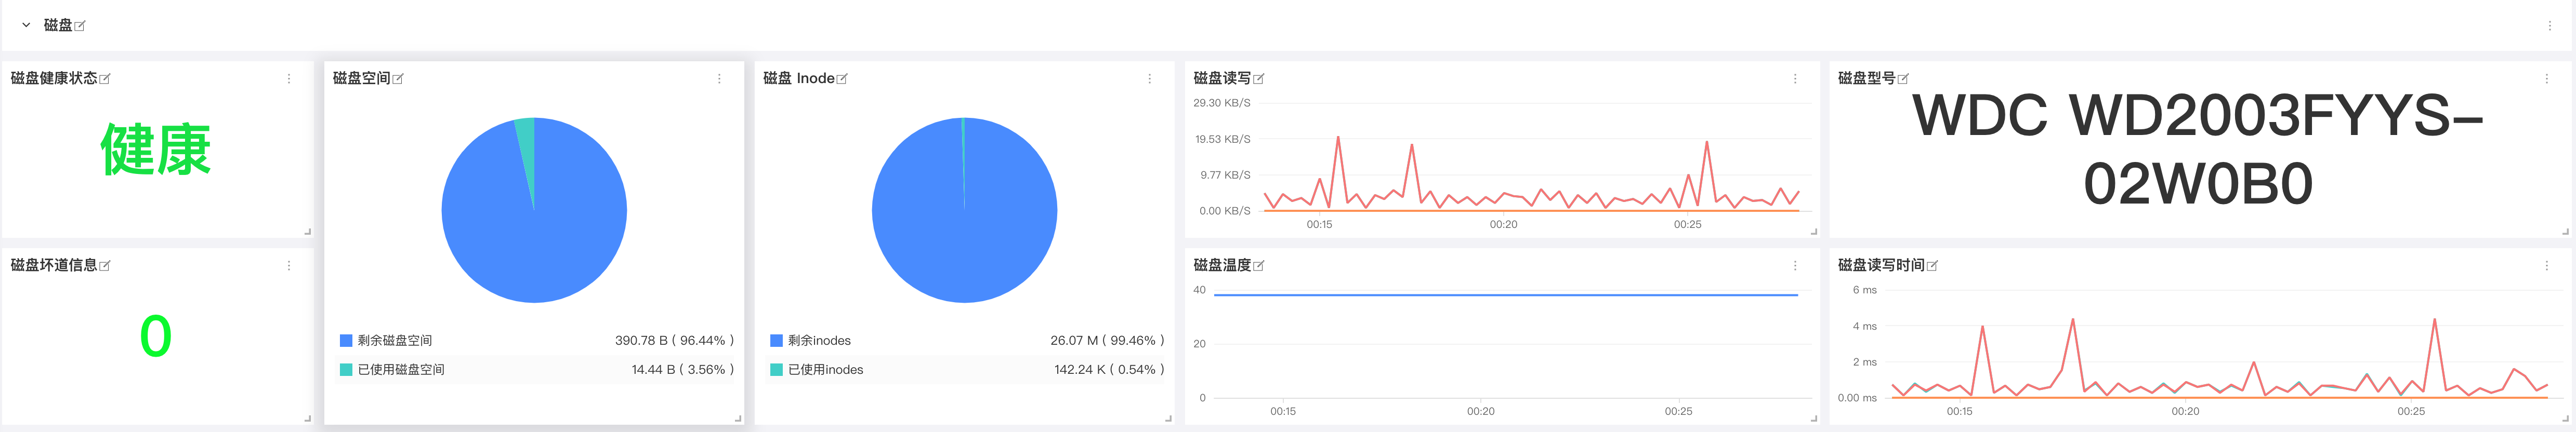
4 Disk Monitoring
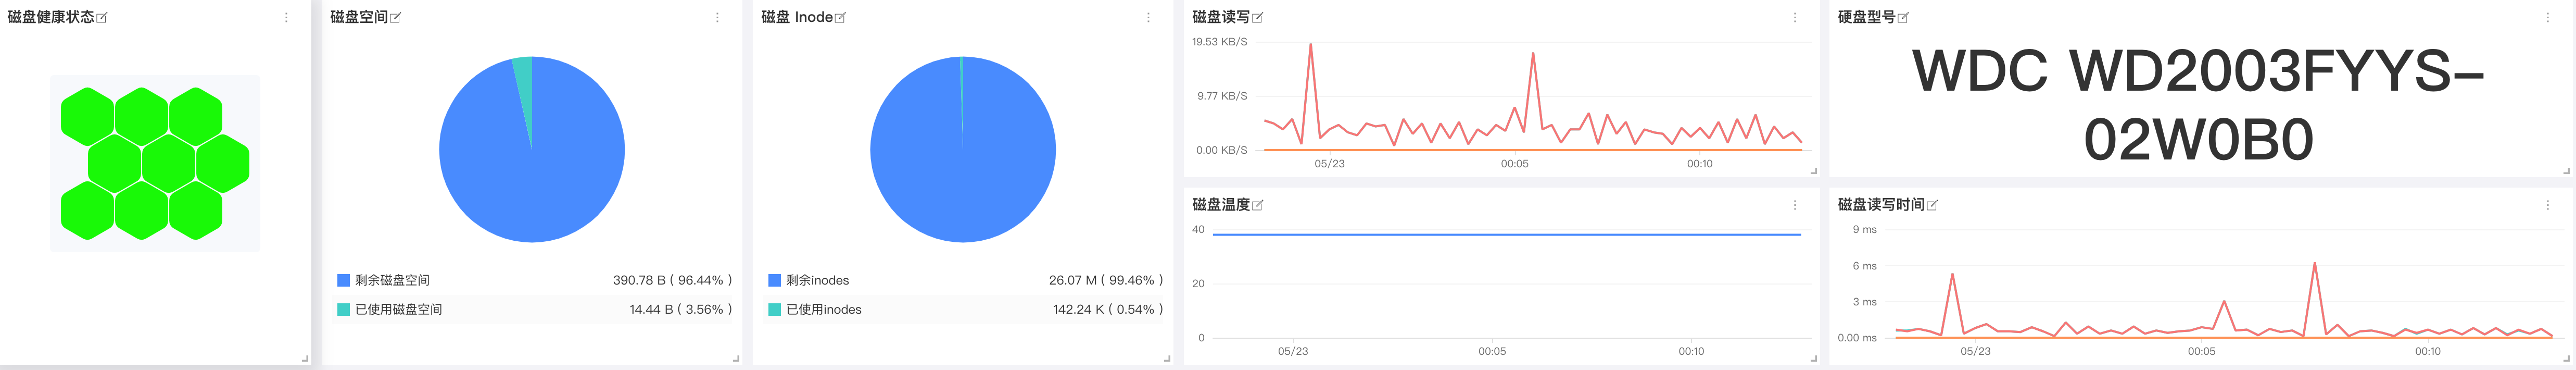
| Metric Description | Name | Measurement Standard |
|---|---|---|
| Disk Health Status | disk.healthdisk.pre_fail |
Availability |
| Disk Space | disk.freedisk.used |
Resource Utilization |
| Disk Inode | disk.inodes_freedisk.inodes_used |
Resource Utilization |
| Disk Read/Write | diskio.read_bytesdiskio.write_bytes |
Resource Utilization |
| Disk Temperature | disk.temperature |
Availability |
| Disk Model | disk.device_model |
Basics |
| Disk Read/Write Time | diskio.read_timedisk.io.write_time |
Resource Utilization |
Disk Space
For any operating system, maintaining sufficient free disk space is essential. Besides needing disk for regular processes, core system processes also store logs and other types of data on the disk. You can configure alerts to remind you when available disk space drops below 15%, ensuring business continuity.
Disk Read/Write Time
This metric tracks the average time spent on disk read/write operations. Setting alerts for values greater than 50 milliseconds indicates relatively high latency (less than 10 milliseconds is generally optimal). Typically, it is recommended to reduce latency by moving business jobs to faster disks. You can set different alert thresholds depending on the role of the server, as acceptable thresholds vary for different roles.
Disk Read/Write
If your server hosts demanding applications, you will want to monitor the disk I/O rate. Disk read/write metrics are aggregates of disk-marked read (diskio.read_bytes) and write (diskio.write_bytes) activities. Persistent high disk activity may degrade service and destabilize the system, especially when using high RAM and page files simultaneously. During high disk activity, consider increasing the number of disks in use (especially when seeing a large number of operations in the queue), using faster disks, increasing RAM reserved for file system caching, and, if possible, distributing workloads across more machines.
Disk Temperature
If your business requires very high disk availability, set alerts to continuously monitor disk working temperature, noting temperatures above 65°C (SSDs above 75°C) as concerning. If your hard drive overheating protection or temperature control mechanisms fail, note that rising disk temperatures could damage the hard drive, leading to data loss in business operations.
5 Network Monitoring
Your applications and infrastructure components depend on increasingly complex architectures, whether you're running monolithic applications or microservices, deploying to cloud infrastructure, private data centers, or both. Virtualized infrastructure allows developers to respond at any scale and create dynamic networking patterns that don't match traditional network monitoring tools. To provide visibility into every component in your environment and all connections between them, Datadog introduces network performance monitoring for the cloud era.
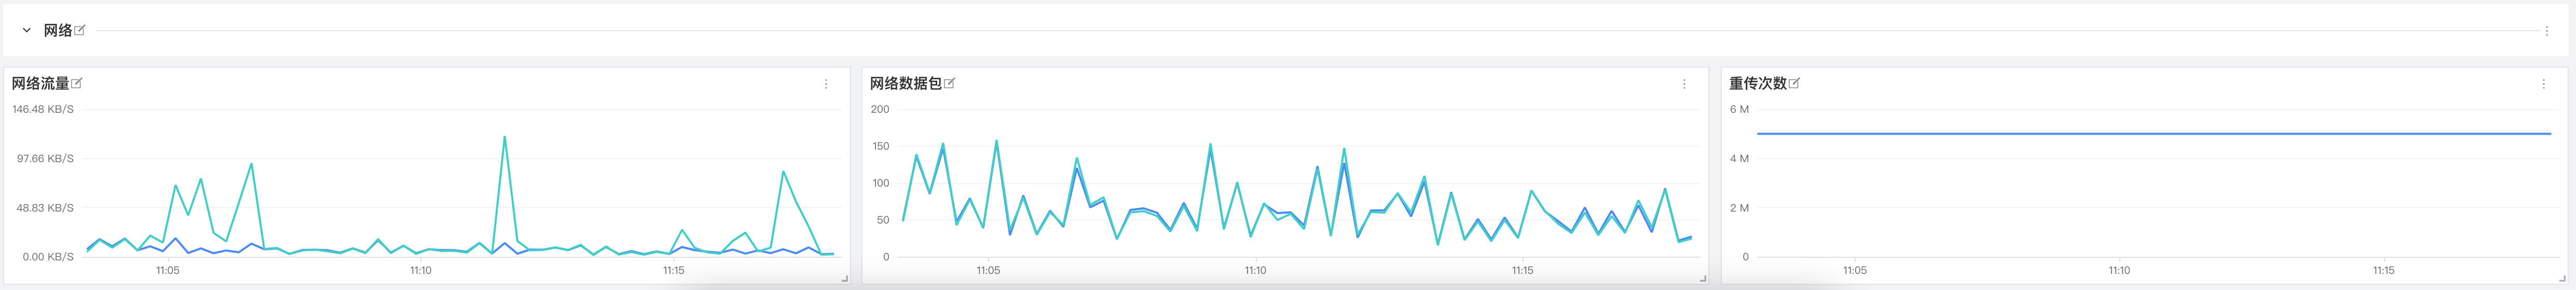
| Metric Description | Name | Measurement Standard |
|---|---|---|
| Network Traffic | net.bytes_recvnet.bytes_sent |
Resource Utilization |
| Network Packets | net.packets_recvnet.packets_sent |
Resource Utilization |
| Retransmissions | net.tcp_retranssegs |
Availability |
Network Traffic
Together, these two metrics measure the total network throughput of a given network interface. For most consumer hardware, its NIC transmission speed is 1 GB per second or higher, so except in the most extreme cases, the network is unlikely to become a bottleneck in all scenarios. You can set alerts to remind you when the interface bandwidth usage exceeds 80%, preventing network saturation (for a 1 Gbps link, reaching 100 megabytes per second).
Retransmissions
TCP retransmissions happen frequently but are not errors, though their presence may indicate signs of problems. Retransmissions are usually the result of network congestion and are often associated with high bandwidth consumption. You should monitor this metric because excessive retransmissions can cause significant delays in applications. If the sender does not receive confirmation of the transmitted packets, it will delay sending more packets (typically lasting about 1 second), thereby increasing latency related to congestion speeds.
If not caused by network congestion, the source of retransmissions might be faulty network hardware. A small number of dropped packets and high retransmission rates may cause excessive buffering. Regardless of the reason, you should track this metric to understand seemingly random fluctuations in network application response times.
Conclusion
In this article, we mentioned some of the most useful metrics you can monitor to retain labels during mining operations. If you're conducting mining operations, monitoring the metrics listed below will give you a good understanding of the mine's operational status and availability:
-
Disk Read/Write Latency
-
Disk Temperature
- Network Traffic
- Daily Expected Earnings
- Harvester Preliminary Screening Pass Rate
- Processes
Ultimately, you'll recognize other metrics specifically relevant to your own use case. Of course, you can also learn more via Guance.