TAG Best Practices in Guance
This article is only intended to spark discussion, hoping that everyone can build on it to create their own tag gameplay.
Preface
The OpenTelemetry protocol is the latest generation of observability specification (still under incubation) defined by CNCF (Cloud Native Computing Foundation). This specification defines the three pillars of observability: metrics, trace, and log. However, if these three pillars of data are simply collected without correlation, what is the difference between so-called observability and traditional monitoring tools (APM, log, Zabbix, etc.)? Is it merely a collection of monitoring tools? This leads to an important concept: TAG (tag). For example, the traceID that bridges the frontend and backend can be regarded as a tag to some extent; the host that provides initial correlation among metrics, traces, and logs can also be seen as a tag. Other examples include project, environment, version number, etc., all of which are tags!
In short, using TAG to achieve data correlation and enable more custom observability scenarios is particularly important. In the current architecture of Guance, all observability items support tag configuration, with no theoretical upper limit on the number of tags.
For example, a common phenomenon in daily life is job hunting or HR recruitment. Job postings often have specific requirements, such as a certain position requiring programming skills, computer knowledge, a bachelor's degree, n years of work experience, etc. Each requirement is like a tag; only candidates meeting all tags can qualify for the position. In an IT system, this translates to: on a specific server, there is a specific application, a specific database, a specific Nginx, running in a specific environment, with a specific person responsible. When problems occur, if there are enough tags, you can quickly identify which server has the issue, which business is affected, which application components are involved, and who is responsible for those components. This allows you to quickly find the right person to fix the problem, thereby improving the efficiency of problem resolution.
This article will use Guance to experiment with the extensibility and playability of tags through four examples.
Experiment 1: Grouping Servers
Background: Enterprises often have multiple project teams or business units. When different project teams or business units develop their own business, they tend to use their own dedicated infrastructure. If all infrastructure and applications are connected to Guance for observability, besides splitting workspaces, what other ways can be used to distinguish project resources?
Of course, there is. Guance was designed with this scenario in mind. The default DataKit main configuration file contains a global_tag tag, which is set at the infrastructure level. Other components on this infrastructure, such as applications and databases, will automatically inherit this tag.
1 Modify datakit-inputs and Configure global_tag
$ vim /usr/local/datakit/conf.d/datakit.conf

# Add tags in global_tags, in addition to the three default ones, you can also add other tags

$ [global_tags]
$  cluster = ""
$  project = "solution"
$  site = ""
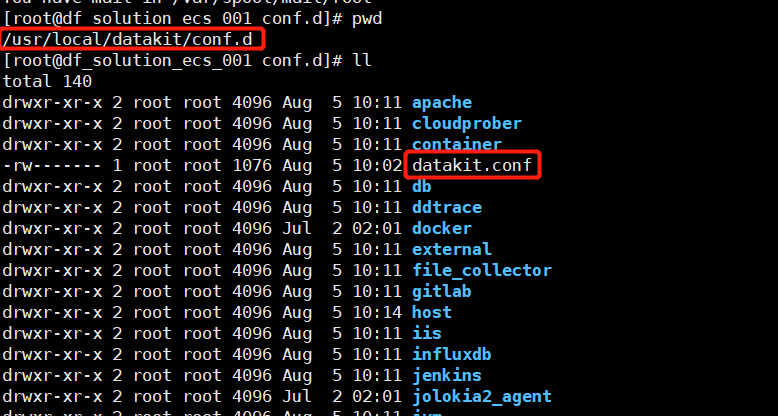
Similarly, add this tag to the DataKit of all relevant hosts.
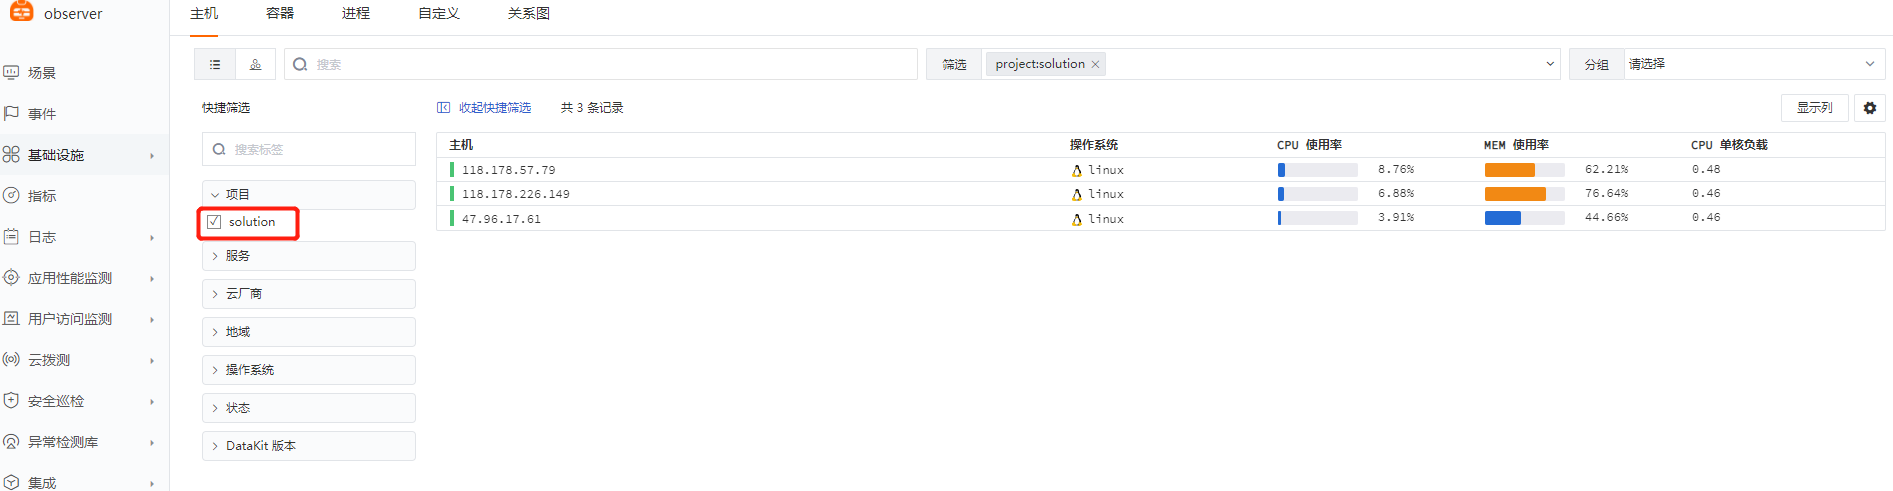
2 View Server Groups in Guance
Experiment 2: Modifying the Hostname Recognized by DataKit
Background: DataKit collects the hostname from the host by default and uses the recognized hostname as a global tag to correlate all metrics, traces, logs, objects, etc. However, in many enterprise internal environments, the hostname is a meaningless random string. Because the hostname may be used for connecting applications, managing databases, or other purposes, enterprises cannot assess the risks of changing the hostname to a recognizable string and are therefore reluctant to change it. To avoid risks, DataKit provides the built-in ENV_HOSTNAME to handle this situation.
Warning
Note: After this method takes effect, host data under the new hostname will be re-uploaded, while host data under the original hostname will no longer be updated.
Recommendation: If you need to change the hostname, it is best to do so during the initial installation of DataKit.
1 Modify datakit-inputs and Configure [environments]
$ vim /usr/local/datakit/conf.d/datakit.conf

# Modify ENV_HOSTNAME in [environments] to a more recognizable hostname

[environments]
  ENV_HOSTNAME = "118.178.57.79"

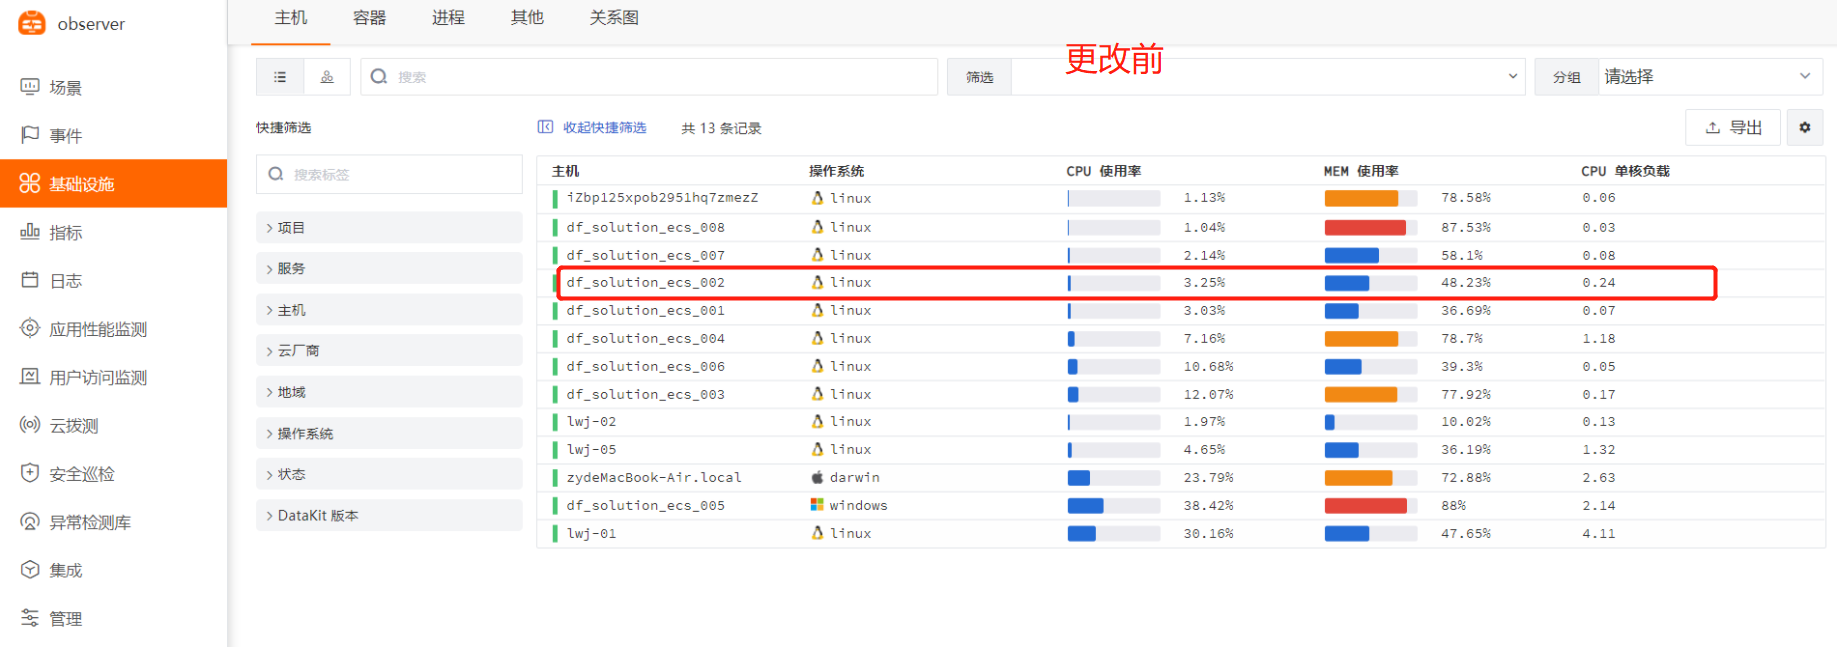
2 Compare Data Before and After the Change in Guance
Experiment 3: Displaying Data by Service Using Nginx Log Statistics
Background: Enterprise Nginx typically handles domain forwarding or service forwarding. The domain corresponding to Nginx often forwards frontend requests to multiple backend subdomains or services on different ports, or Nginx may directly host multiple domain services. In such cases, unified Nginx monitoring is insufficient. How does Guance solve this problem?
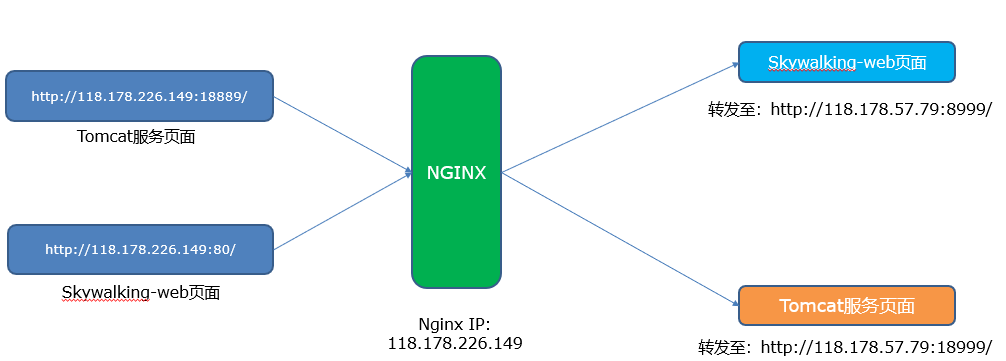
Scenario: Nginx exposes ports 18889 and 80 to the outside, forwarding to internal server 118.178.57.79 on ports 8999 and 18999, respectively.
Requirement: Count data for the services corresponding to Nginx ports 18889 and 80 separately, such as PV, UV, number of request errors, etc.
Prerequisite: The access logs for Nginx ports 80 and 18889 have been configured to different directories (or different log file names).
| Port 80 log directory | /var/log/nginx/80/ |
|---|---|
| Port 18889 log directory | /var/log/nginx/18999/ |
1 Configure Nginx Metrics Monitoring
For detailed configuration, refer to the integration documentation <Nginx>
- Enable the
http_stub_status_modulemodule innginx.confto collect Nginx performance metrics.
Check if the http_stub_status_module module is enabled in Nginx.
(This example is enabled.)

- Add a
nginx_statuslocation block innginx.conf.
$ cd /etc/nginx
   // Nginx path depends on the actual situation
$ vim nginx.conf

$  server{
     listen 80;
     server_name localhost;
     // Port can be customized

      location /nginx_status {
          stub_status  on;
          allow 127.0.0.1;
          deny all;
                             }

          }

-
Run
nginx -s reloadto reload Nginx. -
Enable
nginx.inputsin DataKit.
- Modify the content as follows:

- Save the
nginx.conffile and restart DataKit.
2 Configure Log Monitoring for Port 80 and Port 18889 Services Respectively
$ cd /usr/local/datakit/conf.d/log/
$ cp logging.conf.sample nginx80.conf

$ vim nginx80.conf

## Set the log path to the correct application log path
## source, service, and pipeline are required fields; use the application name to distinguish different log names
## Add the tag domainname

## Modify the content as follows:
[[inputs.logging]]

  logfiles = ["/var/log/nginx/80/access.log","/var/log/nginx/80/error.log" ]

  source = "nginx"

  service = "nginx"

  pipeline = "nginx.p"

  [inputs.logging.tags]

  domainname = "118.178.226.149:80"
$ cd /usr/local/datakit/conf.d/log/
$ cp logging.conf.sample nginx18889.conf
$ vim nginx18889.conf

## Set the log path to the correct application log path
## source, service, and pipeline are required fields; use the application name to distinguish different log names
## Add the tag domainname

## Modify the content as follows:
[[inputs.logging]]

  logfiles = ["/var/log/nginx/18889/access.log","/var/log/nginx/18889/error.log" ]

  source = "nginx"

  service = "nginx"

  pipeline = "nginx.p"

  [inputs.logging.tags]

  domainname = "118.178.226.149:18889"

3 Configure Custom Views (Differentiate Domains via Tags)
Steps: Log in to Guance -> 「Scenarios」 -> 「Create」 -> 「Create Blank Scenario」 -> 「System Views」 (Select NGINX)
Key Point: Modify the Nginx view configuration in the system template.
- Enter the view editing mode, click 「Modify View Variables」 -> 「Add a View Variable」
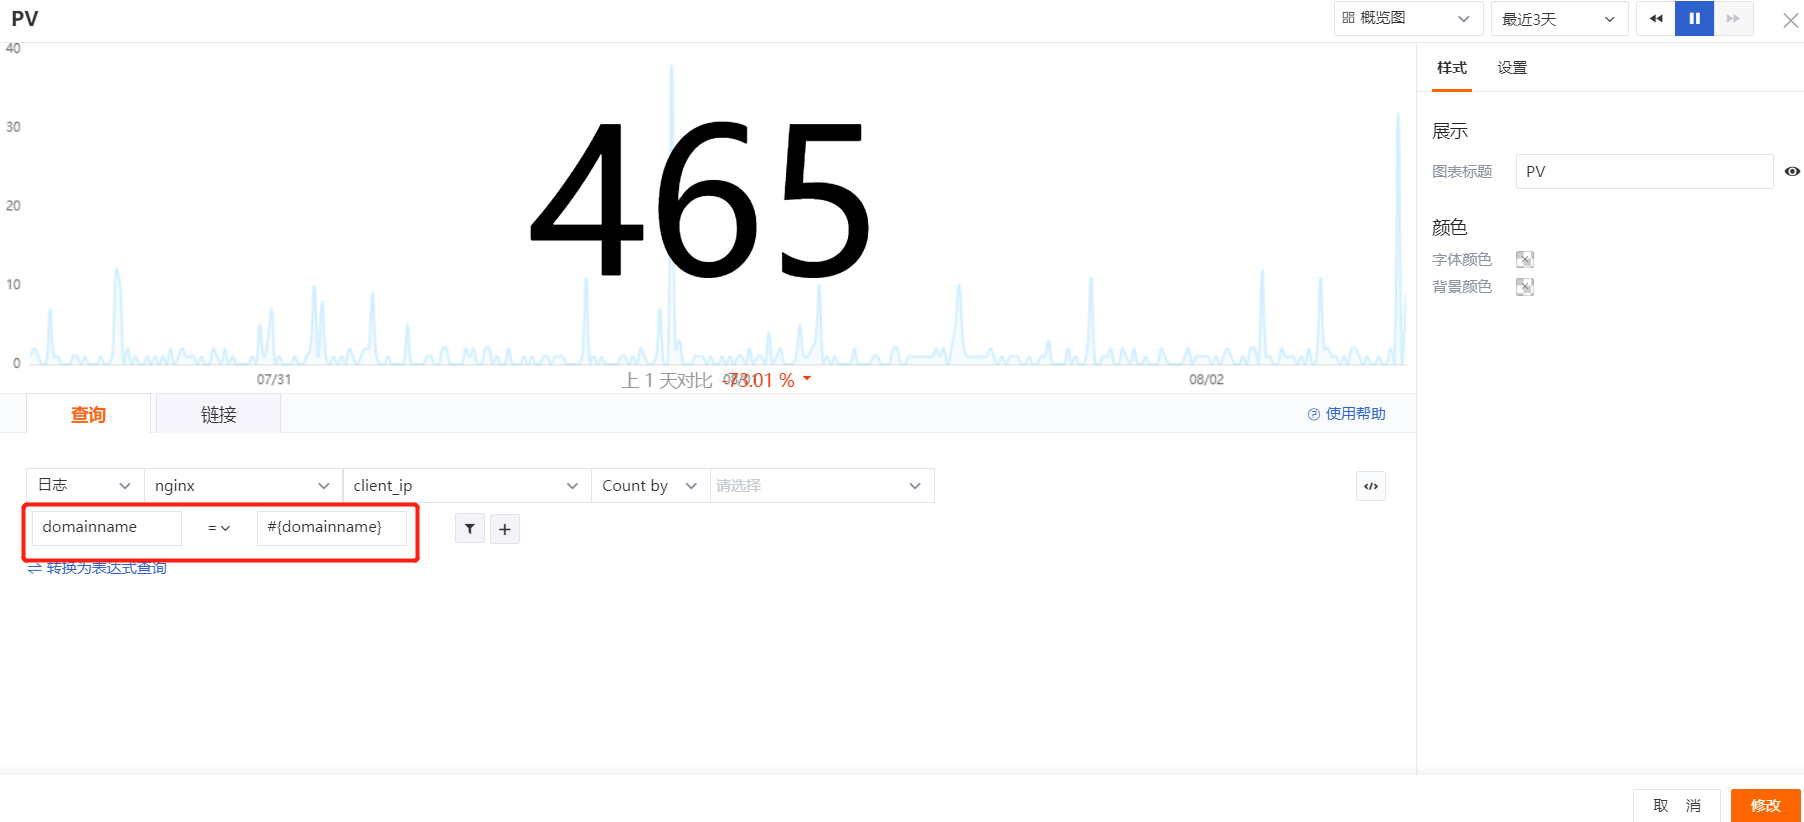
Explanation: Inherit the
hostfrom Nginx metrics, then query distinctdomainnamevalues from Nginx logs (L for logs).

- Modify the specific view parameters.
4 Display Data by Service in Guance
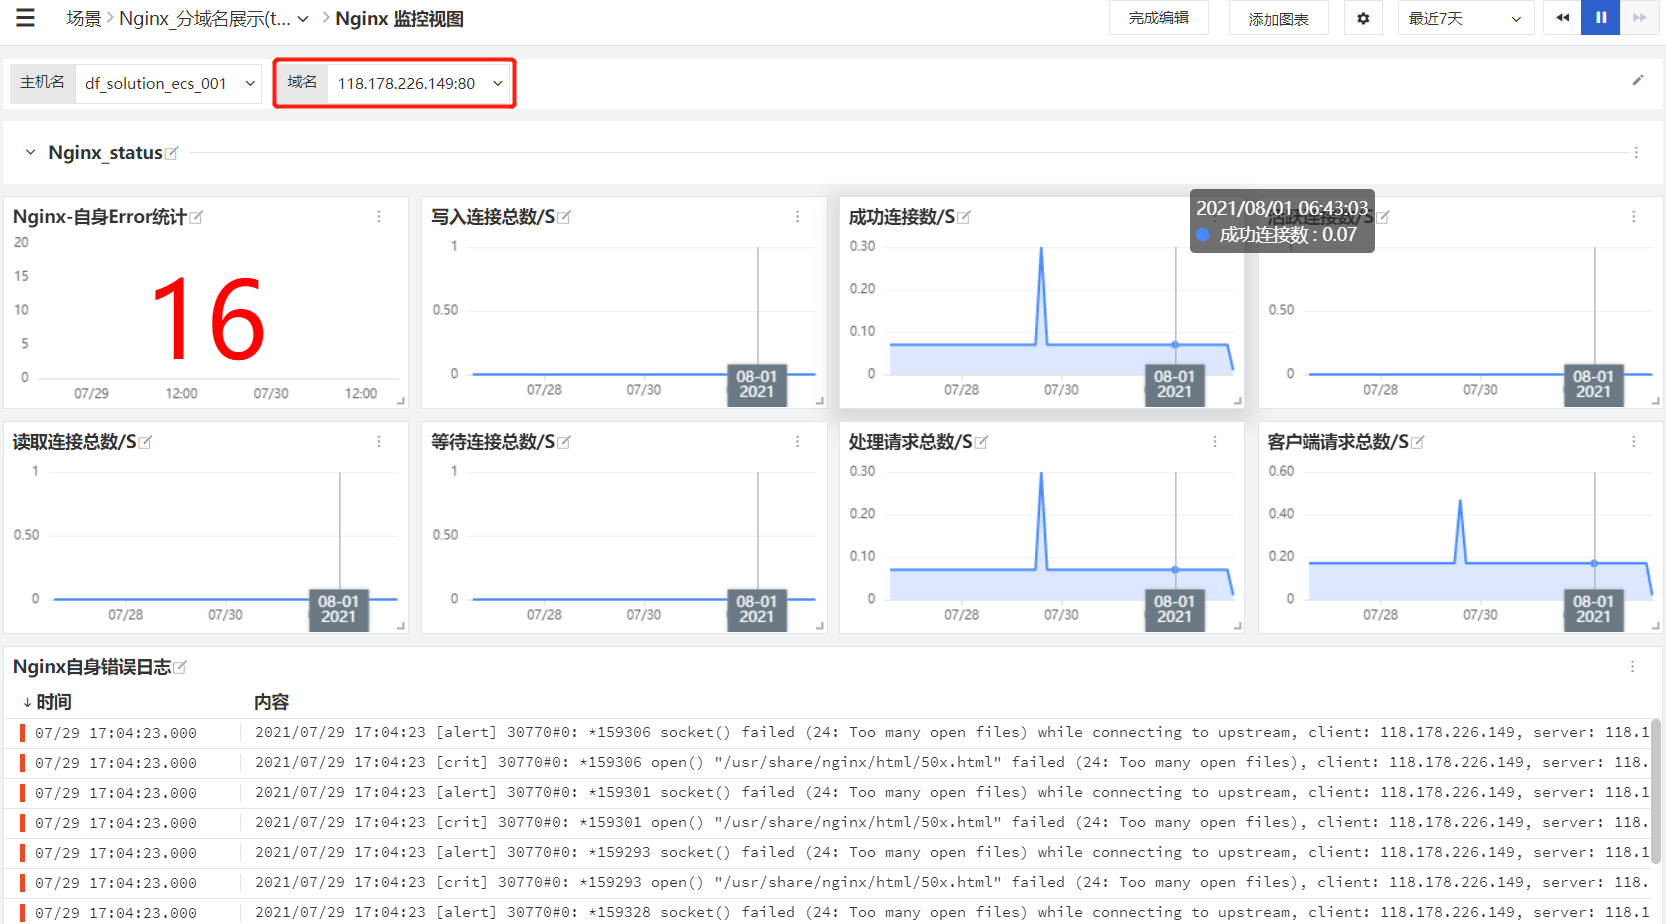
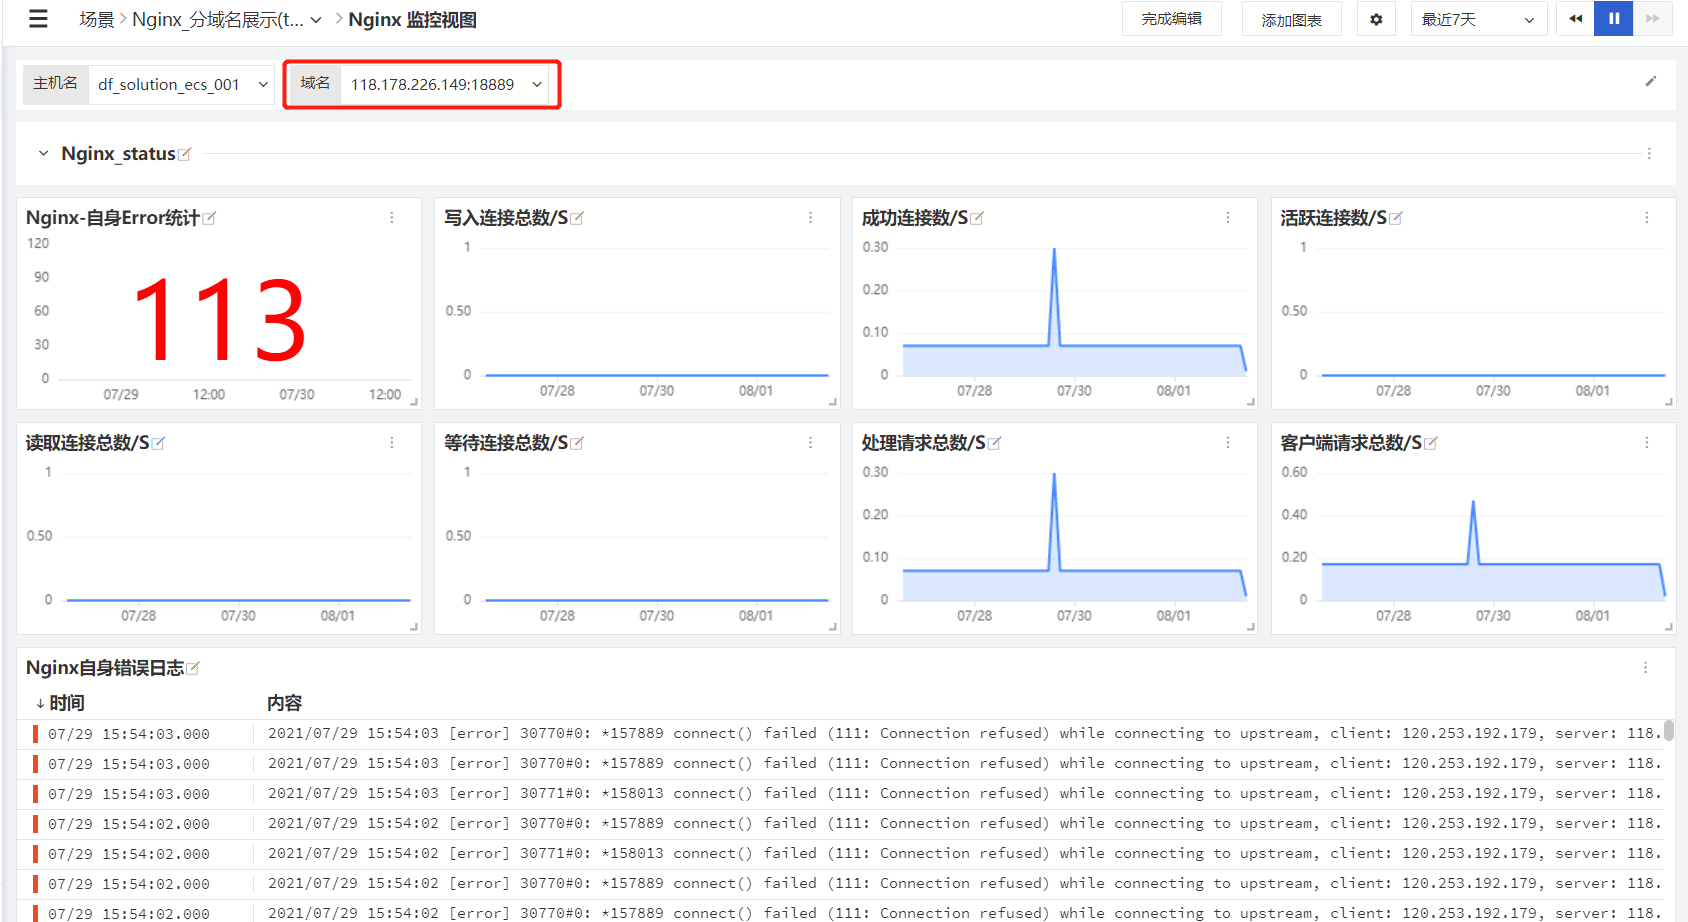
Similarly, by applying different tags, you can distinguish different projects, responsible persons, business modules, environments, etc. The specific capabilities of tags depend on your imagination.
Experiment 4: Identifying Service Owner via Tags for Alert Notifications
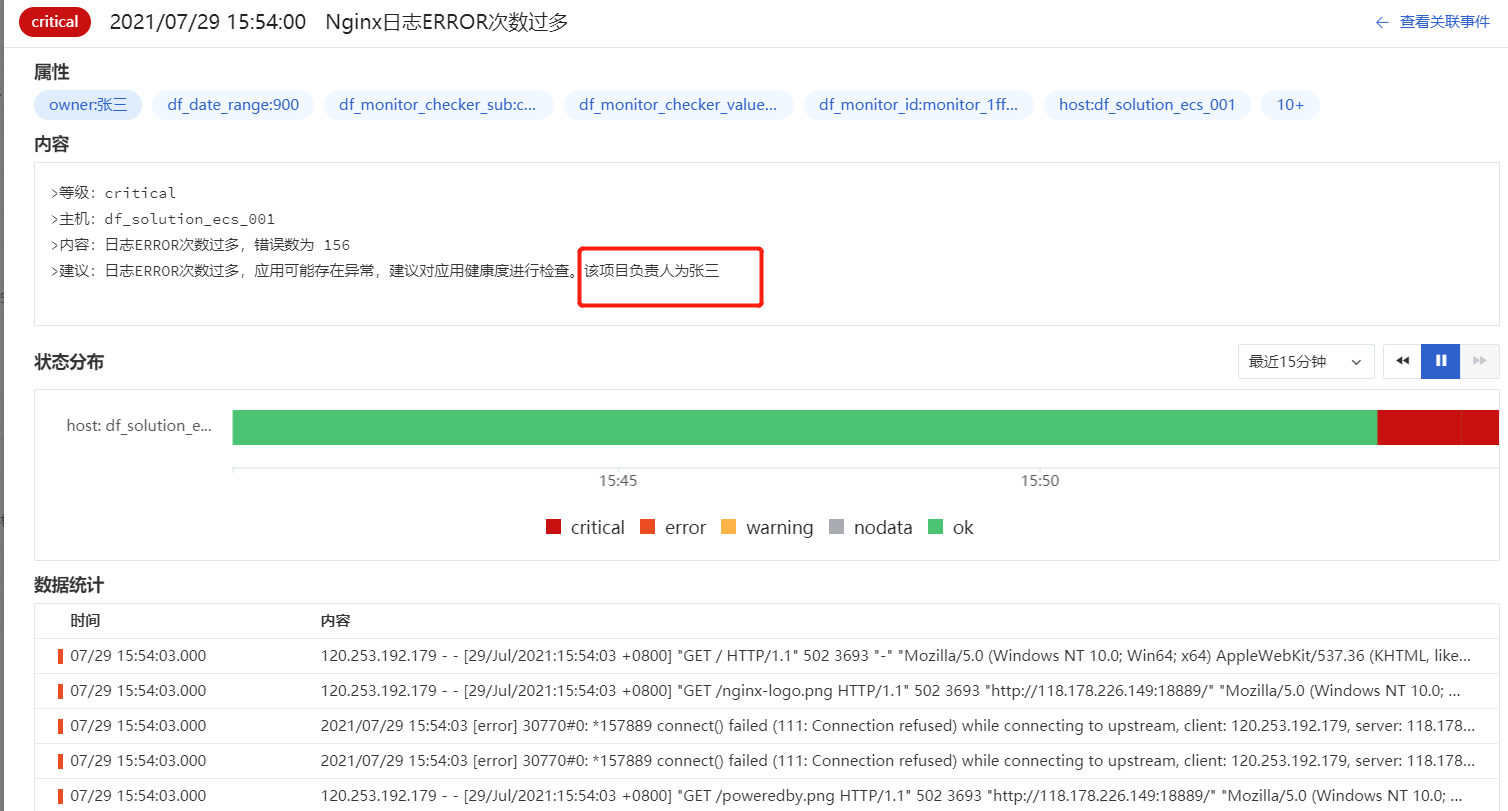
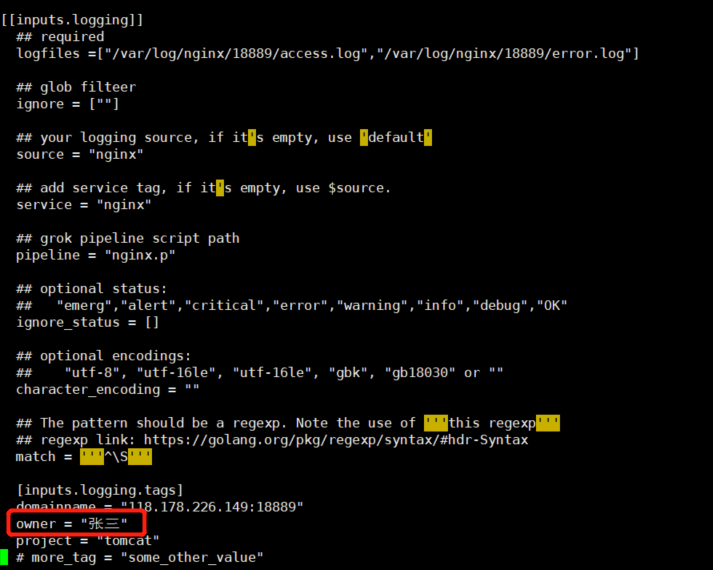
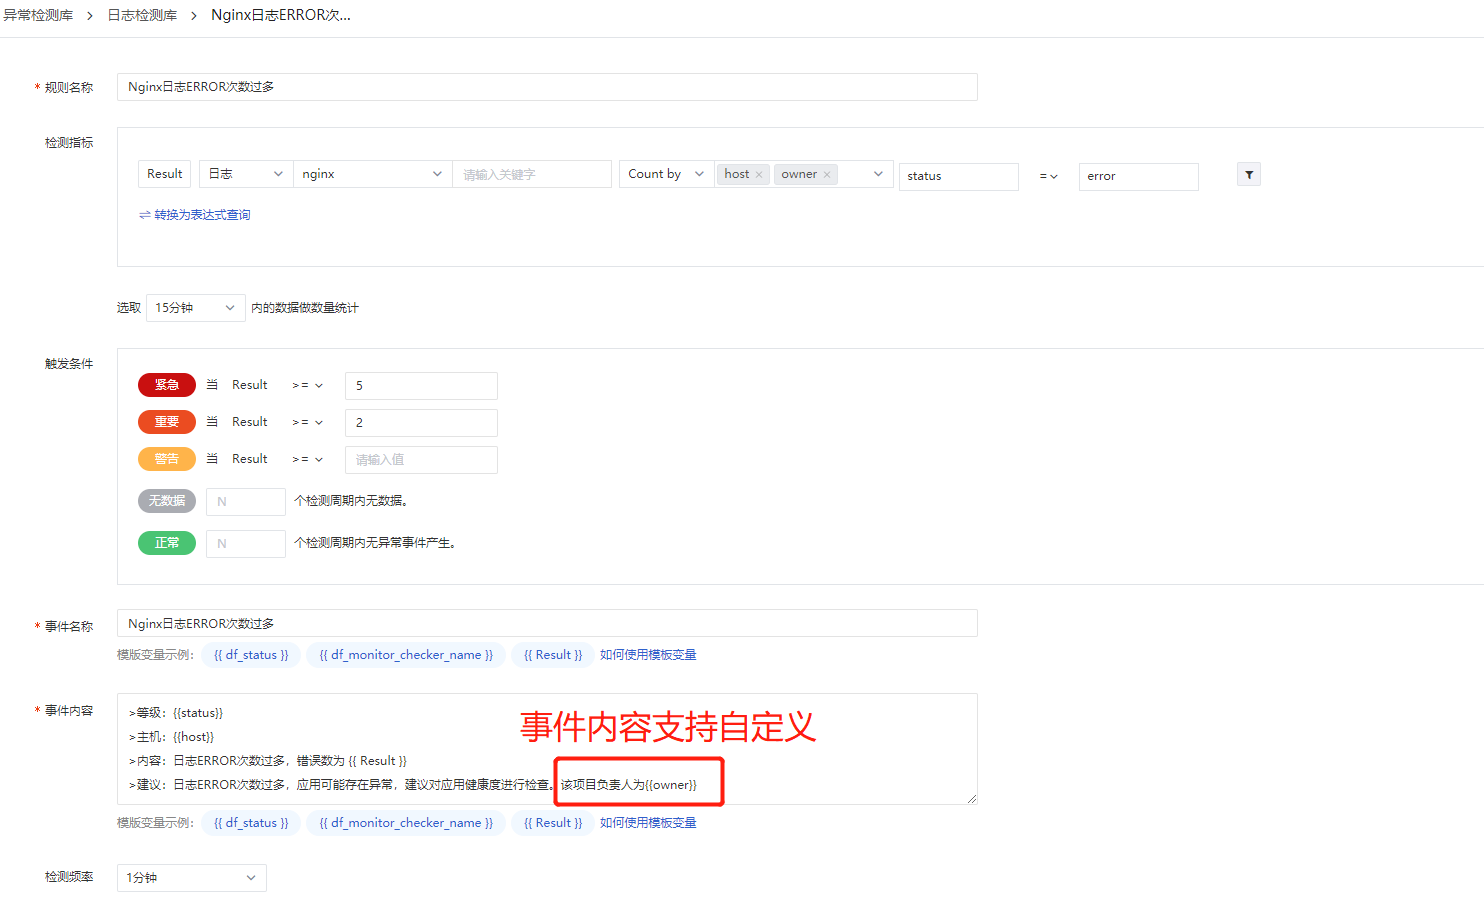
Background: As enterprise business grows, microservices and containers are widely used, leading to an increasing number of service components. Developers and ops personnel also increase, with more refined division of labor. When a business system or IT system fails, the best alert practice is to directly notify the relevant responsible person, thereby improving the efficiency of alert closure. A common approach is to send alerts only to relevant personnel, or assign Jira tickets. How does Guance handle this? In Guance, you simply add a tag (theoretically with no upper limit) in the specific observability inputs. For example, add a custom tag owner = "xxx" in the nginx-inputs. Then, set owner as a variable in the anomaly detection configuration. The anomaly detection will automatically recognize this field and send notifications to DingTalk or WeCom groups. The effect is as follows:
For example, add this to the custom Nginx log configuration above:
1 Add a Tag in Inputs
2 Configure Anomaly Detection
3 Trigger an Alert and View the Alert Event