Nginx Ingress Observability Best Practices
Introduction
Kubernetes provides a layer-4 proxy for accessing applications deployed in Pods. Services with this layer-4 proxy offer four access methods:
- ClusterIP: Accessible only by other applications within the cluster, not externally.
- NodePort: Opens a specified port on all nodes; external users can access the service via IP + port. If no NodePort port is specified, a random port in the range 30000–32767 is assigned by default.
- LoadBalancer: Based on NodePort, uses the cloud provider's load balancer to forward traffic to the service.
- ExternalName: Maps the service to the content of the
externalNamefield by returning a CNAME and its value.
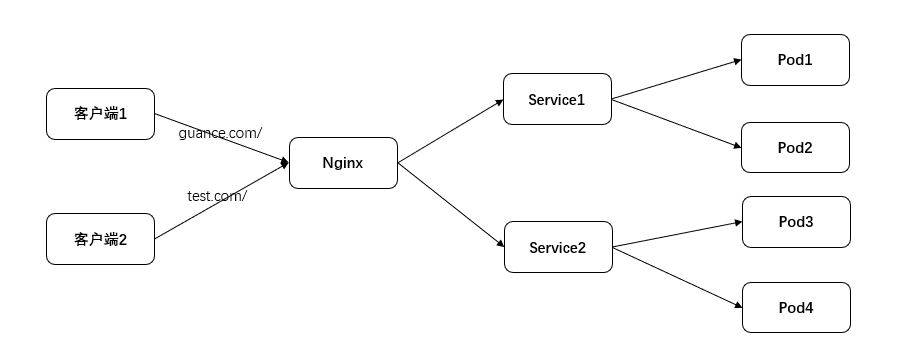
None of the above four methods support accessing cluster applications via domain names. The simplest way to access applications deployed in Kubernetes by domain name is to deploy a layer-7 proxy (Nginx) in the cluster and forward traffic to the corresponding Service based on the domain name. When a new deployment is added, the Nginx configuration must be updated. To make configuration updates transparent to other applications, Ingress was introduced.
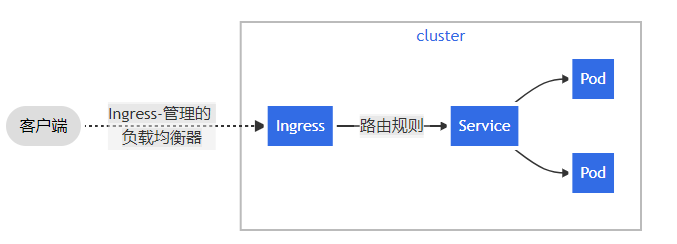
Ingress can forward HTTP and HTTPS requests to services inside the Kubernetes cluster, ultimately reaching the Pods behind the Service. Ingress can be configured to provide external URLs, load balance traffic, and offer domain-based virtual hosting for Services.
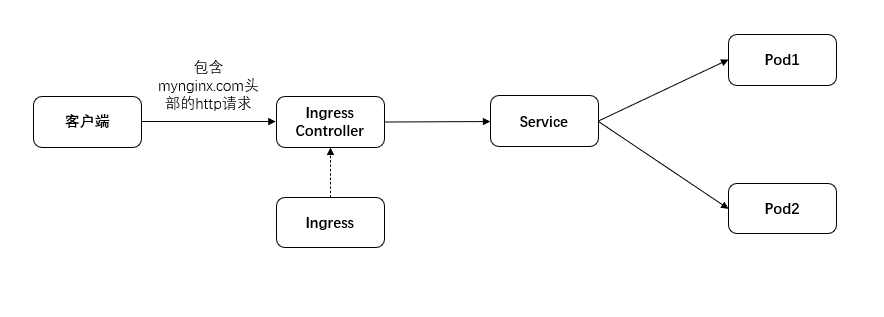
Ingress consists of two major components: Ingress Controller and Ingress. Common Ingress implementations include Traefik Ingress and Nginx Ingress. This article uses Nginx Ingress as an example. The Ingress Controller interacts with the Kubernetes API to dynamically detect changes in Ingress service rules within the cluster, reads these rules, and forwards traffic to the corresponding Services according to the Ingress rules. Ingress defines the rules specifying which domain name corresponds to which Service in the Kubernetes cluster. Based on the Nginx configuration template in the Ingress Controller, a corresponding Nginx configuration is generated. The Ingress Controller then dynamically loads this configuration, writes it into the Nginx service running in the Ingress Controller Pod, and performs a reload to make the configuration effective.
For Kubernetes clusters with Ingress deployed, it is essential to monitor the Ingress Controller's CPU usage, memory usage, configuration file loading, forwarding success rate, and other resources.
How Ingress works:
- The client initiates a http://myNginx.com request.
- The client's DNS server returns the IP address of the Ingress controller.
- The client sends an HTTP request to the Ingress controller with the Host header set to myNginx.com.
- The controller receives the request, determines which service the client is trying to access from the header, and looks up the pod IPs via the endpoint object associated with that service.
- The client's request is forwarded to the specific pod for execution.
Prerequisites
- Install Kubernetes
- Install DataKit: Log in to the Guance console, click Integrations → DataKit → Kubernetes.
Deploy Ingress
In production environments, it is recommended to deploy Ingress using the DaemonSet method and set hosetNetwork to true, so that Nginx directly uses the host's network, and then access Ingress through the cloud provider's load balancer.
1. Download deploy.yaml
wget https://raw.githubusercontent.com/kubernetes/ingress-nginx/controller-v1.1.1/deploy/static/provider/baremetal/deploy.yaml
2. Edit deploy.yaml
2.1 Replace images
Replace the images used in the deploy.yaml file with the following images:
registry.cn-hangzhou.aliyuncs.com/google_containers/nginx-ingress-controller:v1.1.1
registry.cn-hangzhou.aliyuncs.com/google_containers/kube-webhook-certgen:v1.1.1
2.2 Modify the Deployment resource file
Locate the kind: Deployment section and modify it as follows:
kind: DaemonSet # Modified

---
hostNetwork: true # Added
dnsPolicy: ClusterFirstWithHostNet # Modified
Metric Collection
Enable Input
Guance To collect Ingress metrics, DataKit needs to enable the Prom plugin. In the Prom plugin configuration, specify the exporter URL. In a Kubernetes cluster, it is recommended to use annotations to add the configuration. Open the deploy.yaml file used to deploy Ingress, locate the DaemonSet section modified in the previous step, and add the annotations.
annotations:
  datakit/prom.instances: |
    [[inputs.prom]]
      url = "http://$IP:10254/metrics"
      source = "prom-ingress"
      metric_types = ["counter", "gauge", "histogram"]
      # metric_name_filter = ["cpu"]
      # measurement_prefix = ""
      measurement_name = "prom_ingress"
      interval = "60s"
      tags_ignore = ["build","le","path","method","release","repository"]
      metric_name_filter = ["nginx_process_cpu_seconds_total","nginx_process_resident_memory_bytes","request_size","response_size","requests","success","config_last_reload_successful"]
      [[inputs.prom.measurements]]
        prefix = "nginx_ingress_controller_"
        name = "prom_ingress"
      [inputs.prom.tags]
      namespace = "$NAMESPACE"
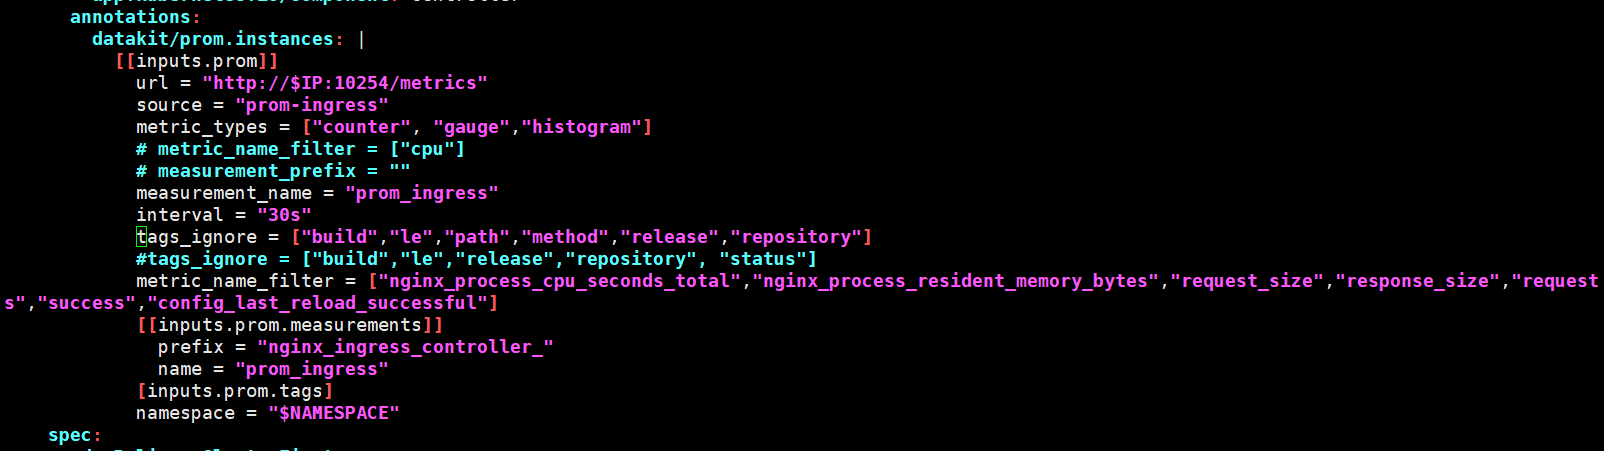
Parameter description
url: Exporter URLs. Multiple URLs are separated by commas. Example: "[http://127.0.0.1:9100/metrics",](http://127.0.0.1:9100/metrics",) "[http://127.0.0.1:9200/metrics"]source: Alias of the collector.metric_types: Metric types. Optional values:counter,gauge,histogram,summary.measurement_name: Measurement name.interval: Collection frequency.inputs.prom.measurements: Metrics with the prefix defined inprefixare grouped into the measurement specified byname.tags_ignore: Tags to ignore.metric_name_filter: Metric filter; only collect the required metric items.
The following wildcards are supported in the annotations:
$NAMESPACE: Pod Namespace
Restart Ingress Controller
Demo Example
Write the Nginx deployment file nginx-deployment.yaml
nginx-deployment.yaml
apiVersion: apps/v1
kind: Deployment
metadata:
  name: nginx-deployment
spec:
  selector:
    matchLabels:
      app: backend
  replicas: 1
  template:
    metadata:
      labels:
        app: backend
    spec:
      # nodeName: df-k8s-node2
      containers:
        - name: nginx
          image: nginx:latest
          resources:
            limits:
              memory: "128Mi"
              cpu: "128m"
          ports:
            - containerPort: 80

---
apiVersion: v1
kind: Service
metadata:
  name: nginx-service
spec:
  selector:
    app: backend
  ports:
    - port: 80
      targetPort: 80
Write the corresponding nginx-ingress.yaml. According to this rule, if the domain name is mynginx.com, it will be forwarded to the Service named nginx-service.
nginx-ingress.yaml
Deploy the example
Test the request, where:
8.136.204.98is the IP address of the node in the Kubernetes cluster where Ingress is deployed.mynginx.comis the corresponding host innginx-ingress.yaml.
View Metric Data
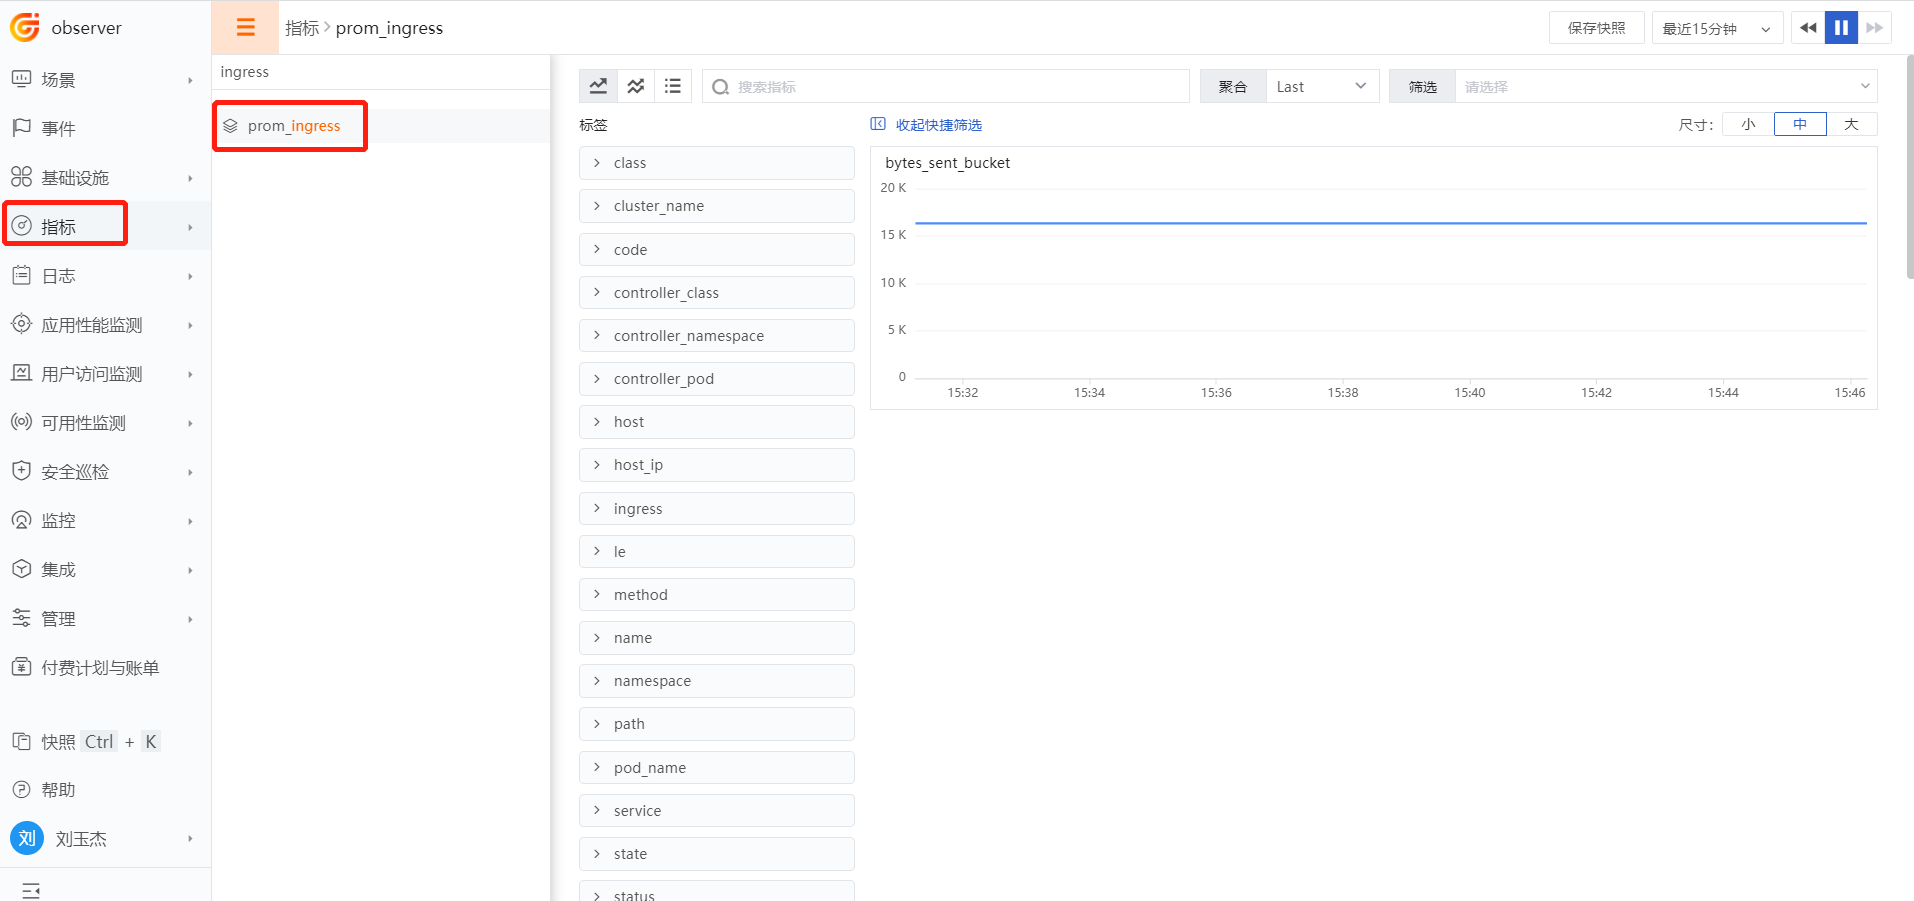
Log in to Guance. In Metrics, find the prom_ingress metric. prom_ingress is the value of the measurement_name parameter in the annotations.
Observing Ingress
Ingress Monitoring Dashboard
Log in to Guance. Go to Scenarios → New Dashboard, search for the template "Ingress Nginx Monitoring View", and click Confirm.
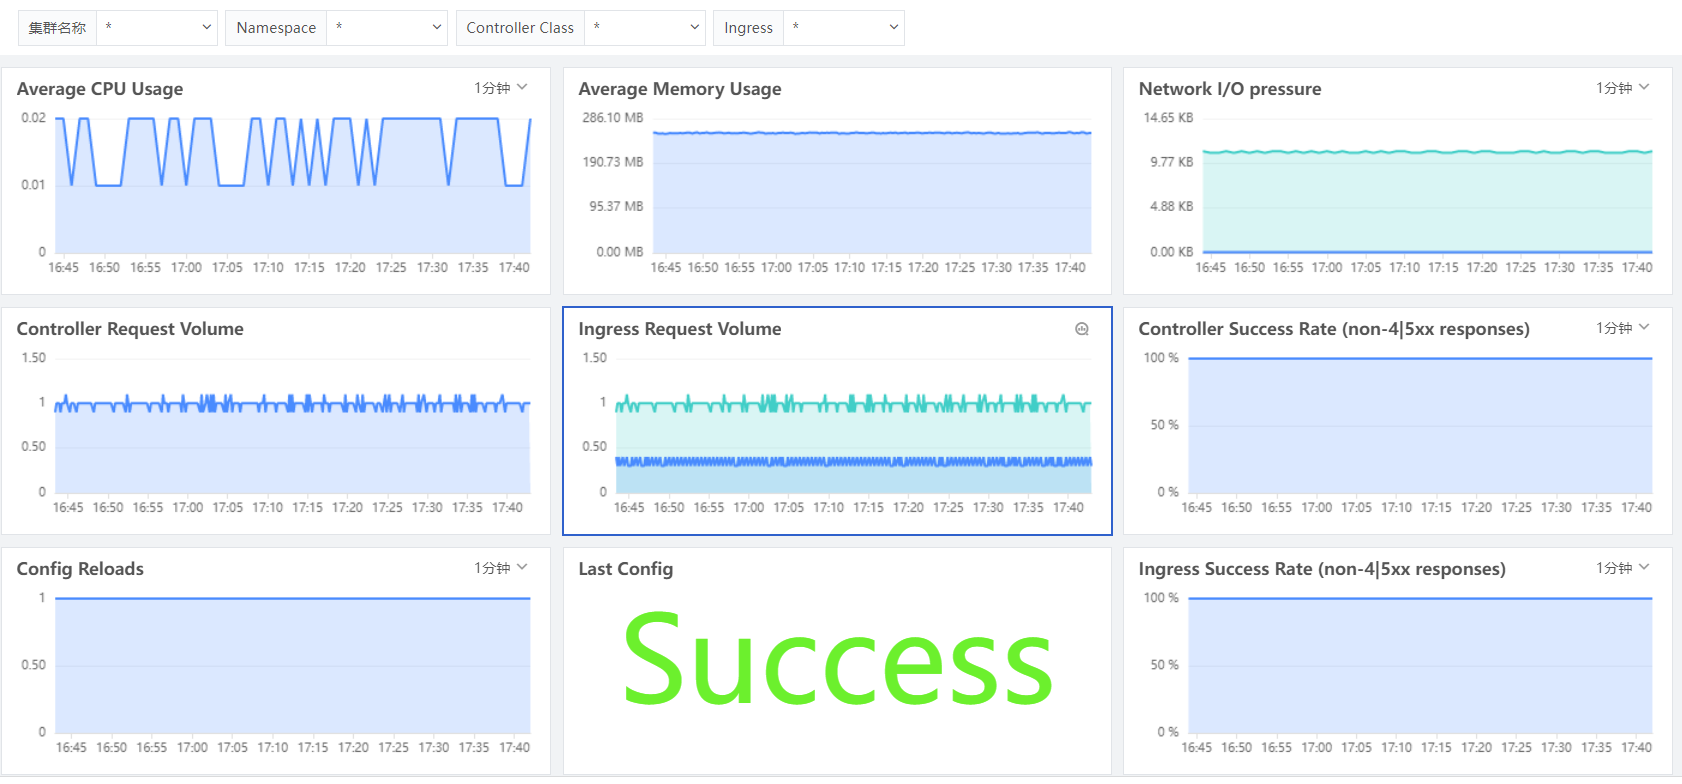
Ingress performance metrics are displayed, including the Ingress Controller's average CPU usage, average memory usage, total network requests/responses, Ingress Config load count, result of the last Ingress Config load, Ingress forwarding success rate, etc.