service mesh Microservice Architecture Full-Process Best Practices from Development to Canary Release (Part 2)
Introduction
The previous article introduced deploying DataKit in a Kubernetes environment, deploying the Bookinfo project in an Istio environment, configuring a CICD Pipeline for the reviews microservice, and using canary releases for three versions of reviews. This article covers Kubernetes observability and Istio observability.
1 Kubernetes Observability
1.1 Docker Monitoring View
In a Kubernetes cluster, a Pod is the smallest scheduling unit, and a Pod can contain one or more containers. In Guance, you can use the Docker Monitoring View to observe containers.
Login to ‘Guance’, click ‘Scenarios’ -> ‘Create Dashboard’, and select Docker Monitoring View.
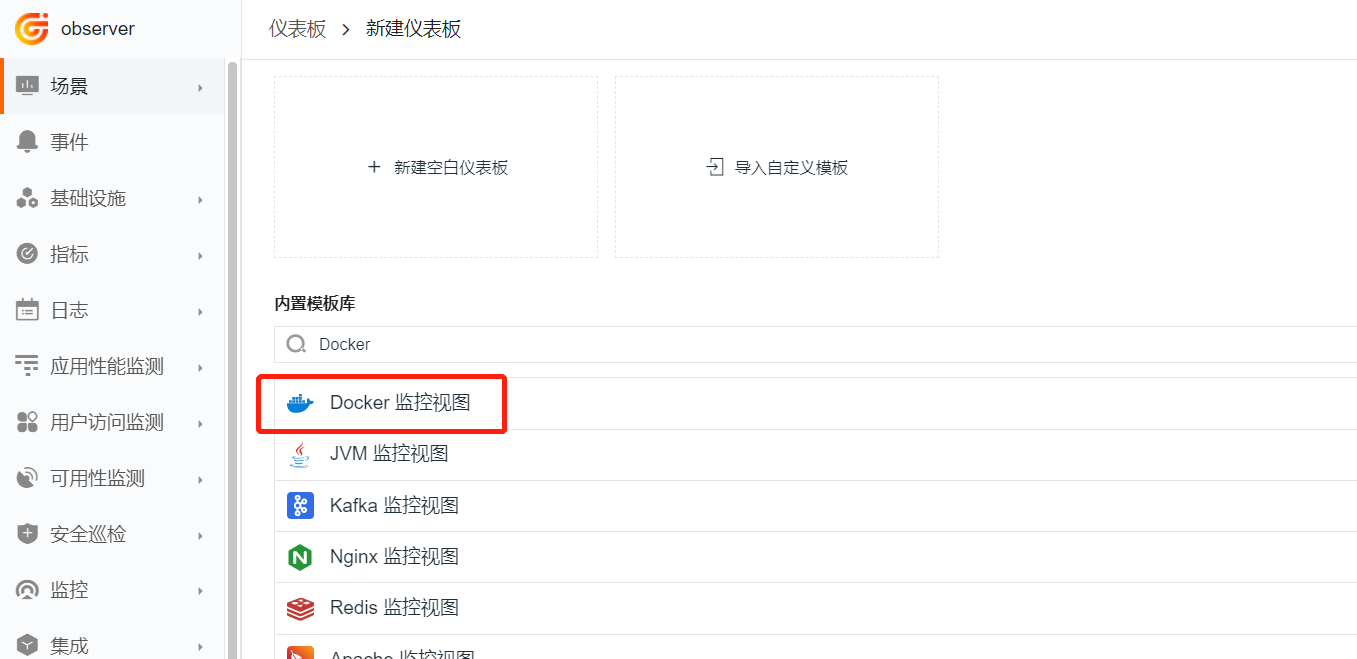
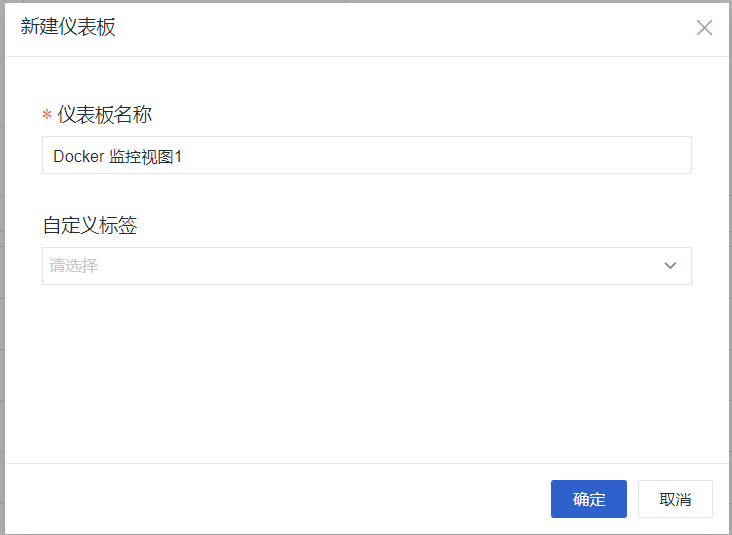
Fill in the dashboard name as Docker Monitoring View 1 (the name is customizable), then click ‘OK’.
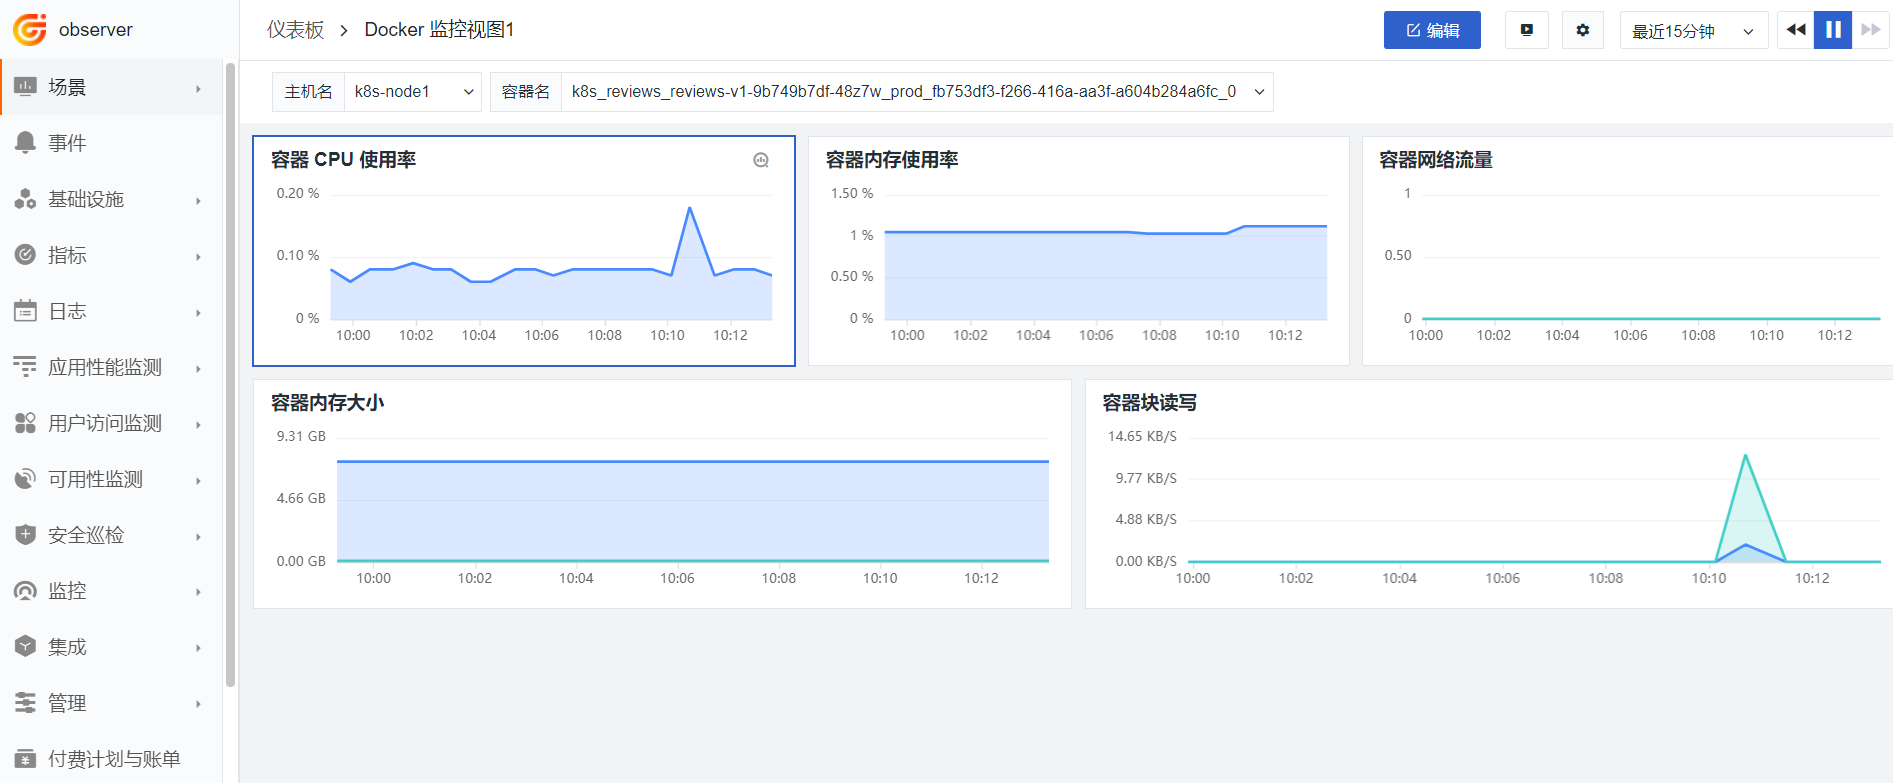
Enter the monitoring view and select the host name and container name.
1.2 Kubernetes Monitoring View
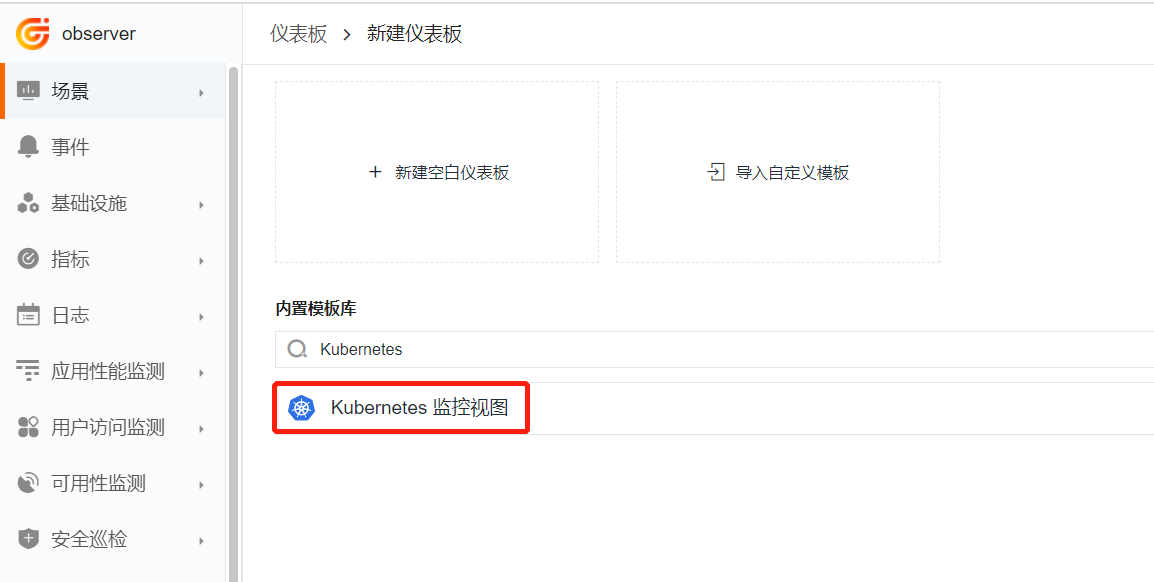
Login to ‘Guance’, click ‘Scenarios’ -> ‘Create Dashboard’, and select Kubernetes Monitoring View.
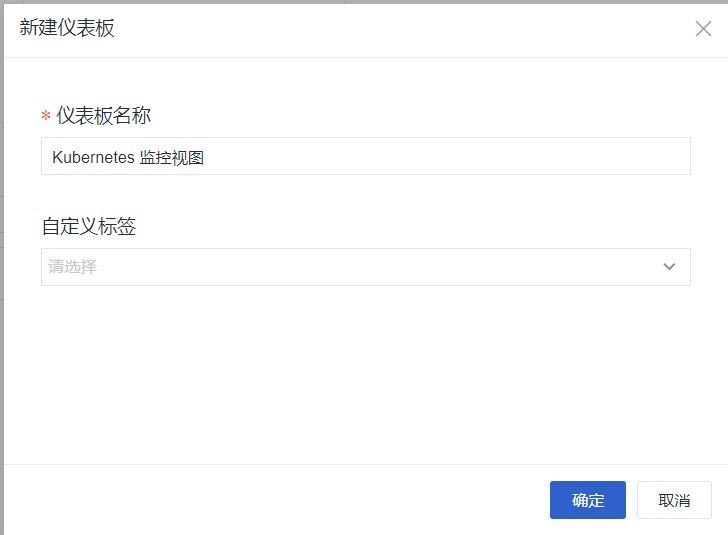
Fill in the dashboard name as Kubernetes Monitoring View (the name is customizable), then click ‘OK’.
Enter the monitoring view and select the cluster name and namespace.
‘Note’ The cluster name dropdown is the one set when deploying DataKit in the previous article.


1.3 ETCD Monitoring View
1.3.1 Enable the ETCD Collector
In the Kubernetes cluster, enabling the collector requires defining the configuration in a ConfigMap and then mounting it to the corresponding directory of DataKit. The content of etcd.conf is as follows:
apiVersion: v1
kind: ConfigMap
metadata:
  name: datakit-conf
  namespace: datakit
data:
    #### etcd
    etcd.conf: |-
        [[inputs.prom]]
          ## Exporter URL or file path (add http or https for Exporter URL)
          ## File path differs by OS
          ## Windows example: C:\\Users
          ## UNIX-like example: /usr/local/
          urls = ["https://172.16.0.229:2379/metrics"]

          ## Collector alias
          source = "etcd"

          ## Metric type filter, optional values: counter, gauge, histogram, summary
          # Default only collects counter and gauge metrics
          # If empty, no filtering is applied
          metric_types = ["counter", "gauge"]

          ## Metric name filter
          # Supports regex, multiple values can be configured (any match is sufficient)
          # If empty, no filtering is applied
          metric_name_filter = ["etcd_server_proposals","etcd_server_leader","etcd_server_has","etcd_network_client"]

          ## Measurement name prefix
          # If set, a prefix is added to the measurement name
          measurement_prefix = ""

          ## Measurement name
          # By default, the metric name is split by underscore "_", the first part becomes the measurement name, and the rest becomes the metric name
          # If measurement_name is configured, no splitting is performed
          # The final measurement name will have measurement_prefix prepended
          # measurement_name = "prom"

          ## Collection interval "ns", "us" (or "µs"), "ms", "s", "m", "h"
          interval = "60s"

          ## Filter tags, multiple tags can be configured
          # Matching tags will be ignored
          # tags_ignore = ["xxxx"]

          ## TLS configuration
          tls_open = true
          #tls_ca = "/etc/kubernetes/pki/etcd/ca.crt"
          tls_cert = "/etc/kubernetes/pki/etcd/peer.crt"
          tls_key = "/etc/kubernetes/pki/etcd/peer.key"

          ## Custom measurement name
          # Metrics with the specified prefix can be grouped into one measurement
          # Custom measurement name configuration takes precedence over measurement_name
          [[inputs.prom.measurements]]
            prefix = "etcd_"
            name = "etcd"

          ## Custom authentication method, currently only Bearer Token is supported
          # [inputs.prom.auth]
          # type = "bearer_token"
          # token = "xxxxxxxx"
          # token_file = "/tmp/token"

          ## Custom tags
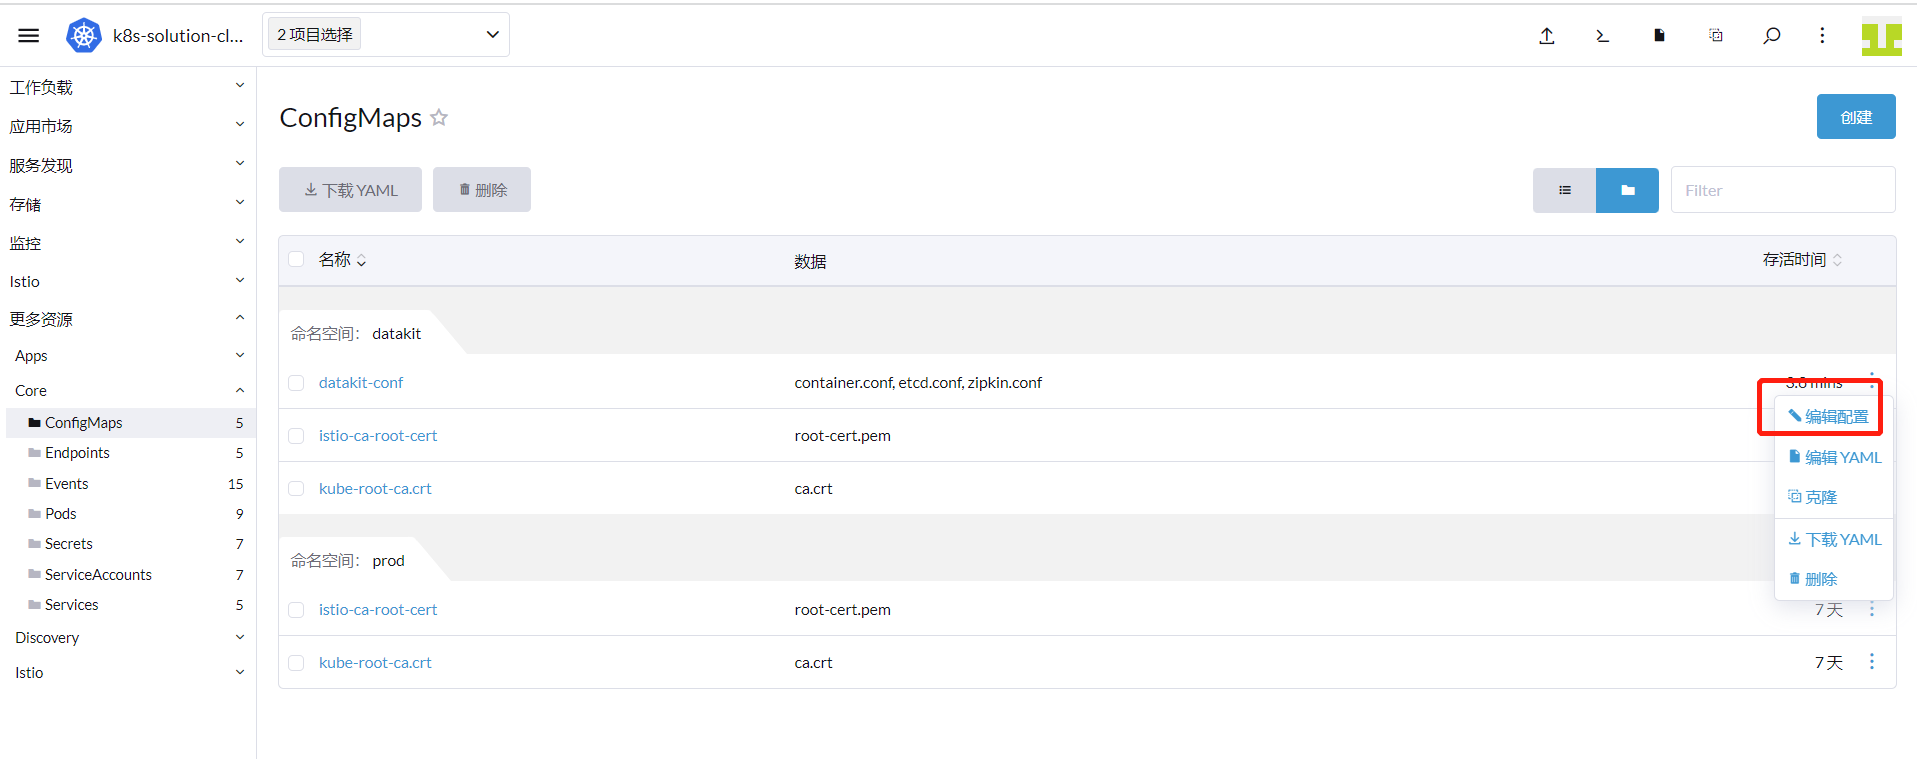
Login to ‘Rancher’, under the cluster browsing tab, select the ‘k8s-solution-cluster’ cluster, then go to ‘More Resources’ -> ‘Core’ -> ‘ConfigMaps’. Select the datakit namespace, click ‘Edit Config’ on the datakit.conf row, click ‘Add’, add the etcd.conf configuration, and then click ‘Save’.

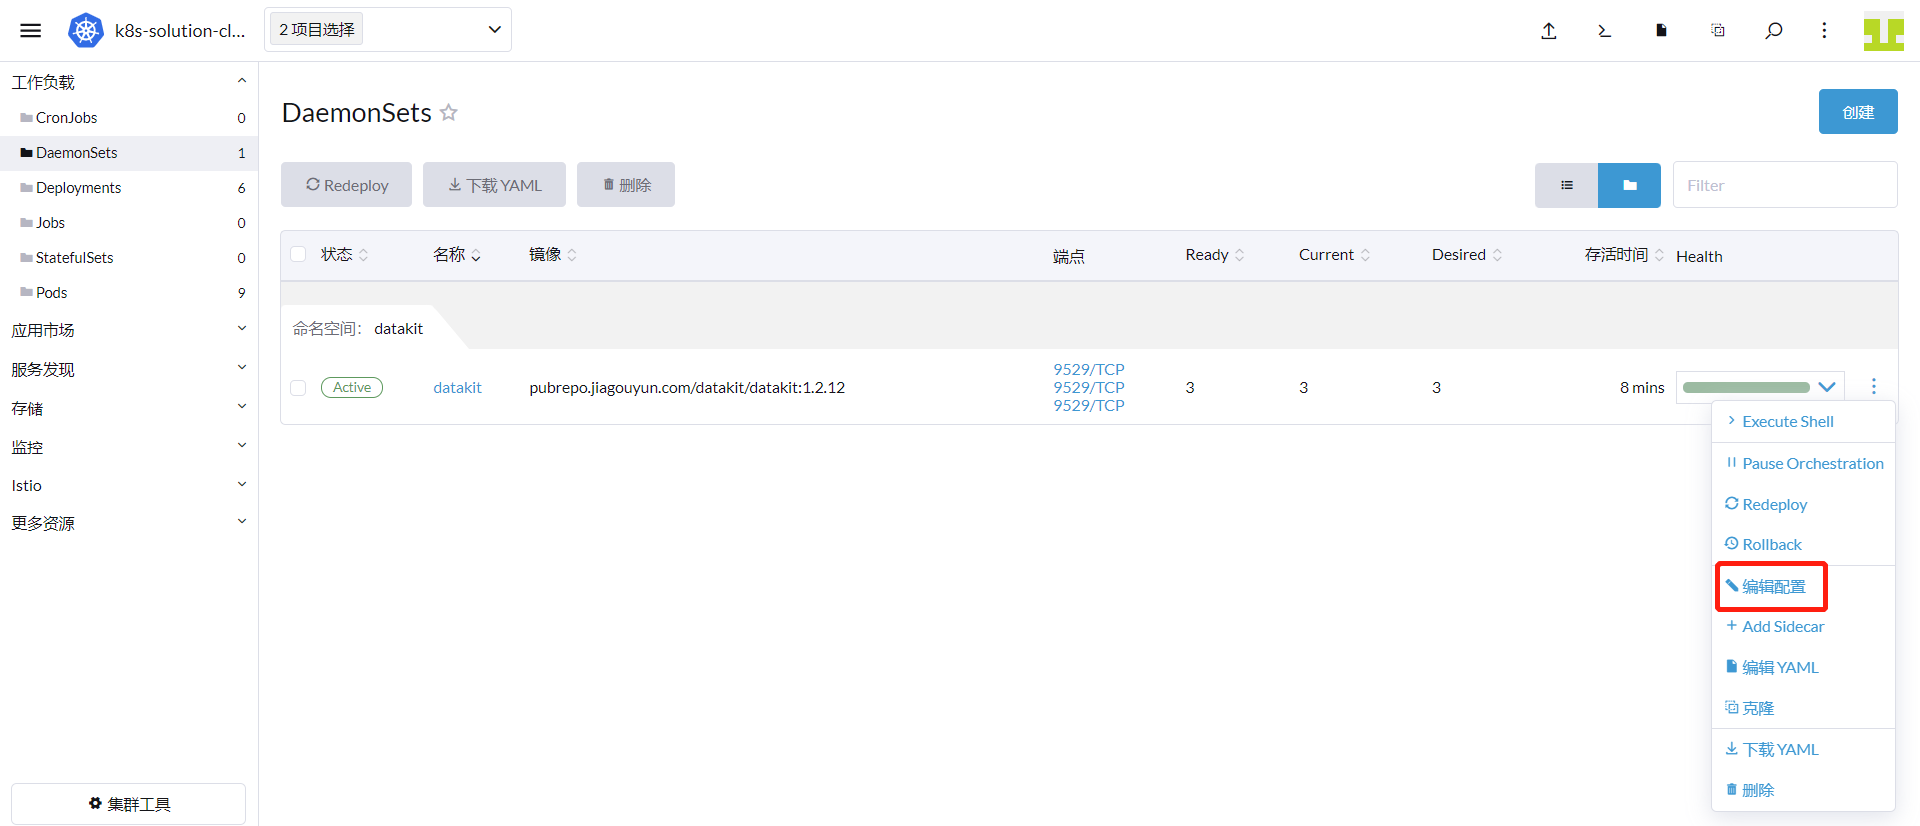
Login to ‘Rancher’, under the cluster browsing tab, select the ‘k8s-solution-cluster’ cluster, then go to ‘Workloads’ -> ‘DaemonSets’. Select the datakit workspace, and on the datakit row, click ‘Edit Config’ on the right.
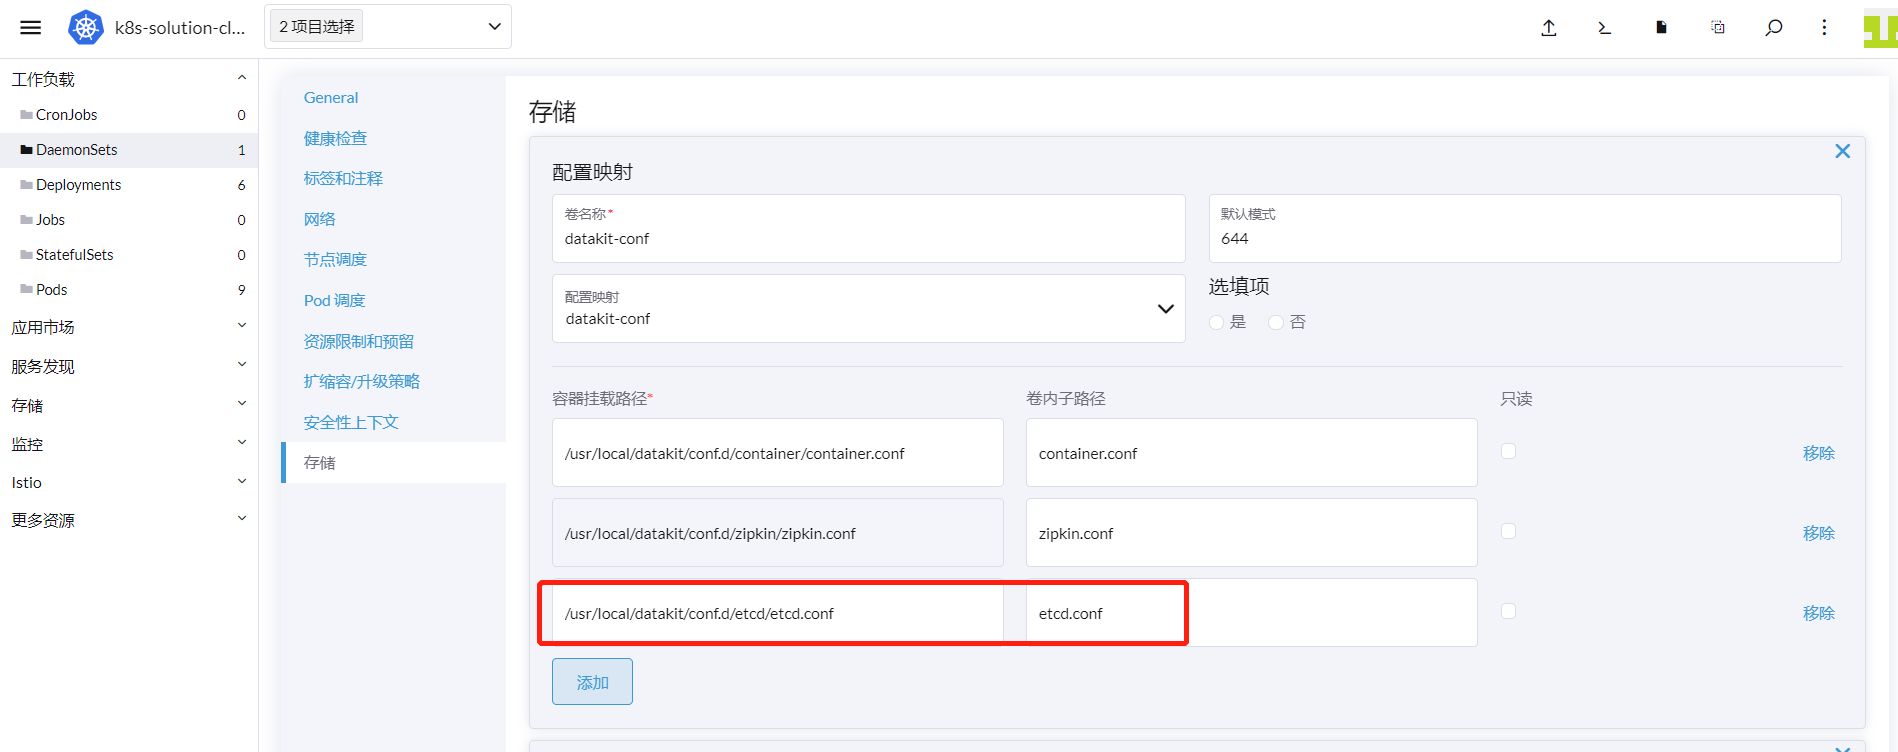
Go to the Storage interface, add the mount directory for etcd.conf: /usr/local/datakit/conf.d/etcd/etcd.conf, then click ‘Save’.
1.3.2 Mount Certificate Files
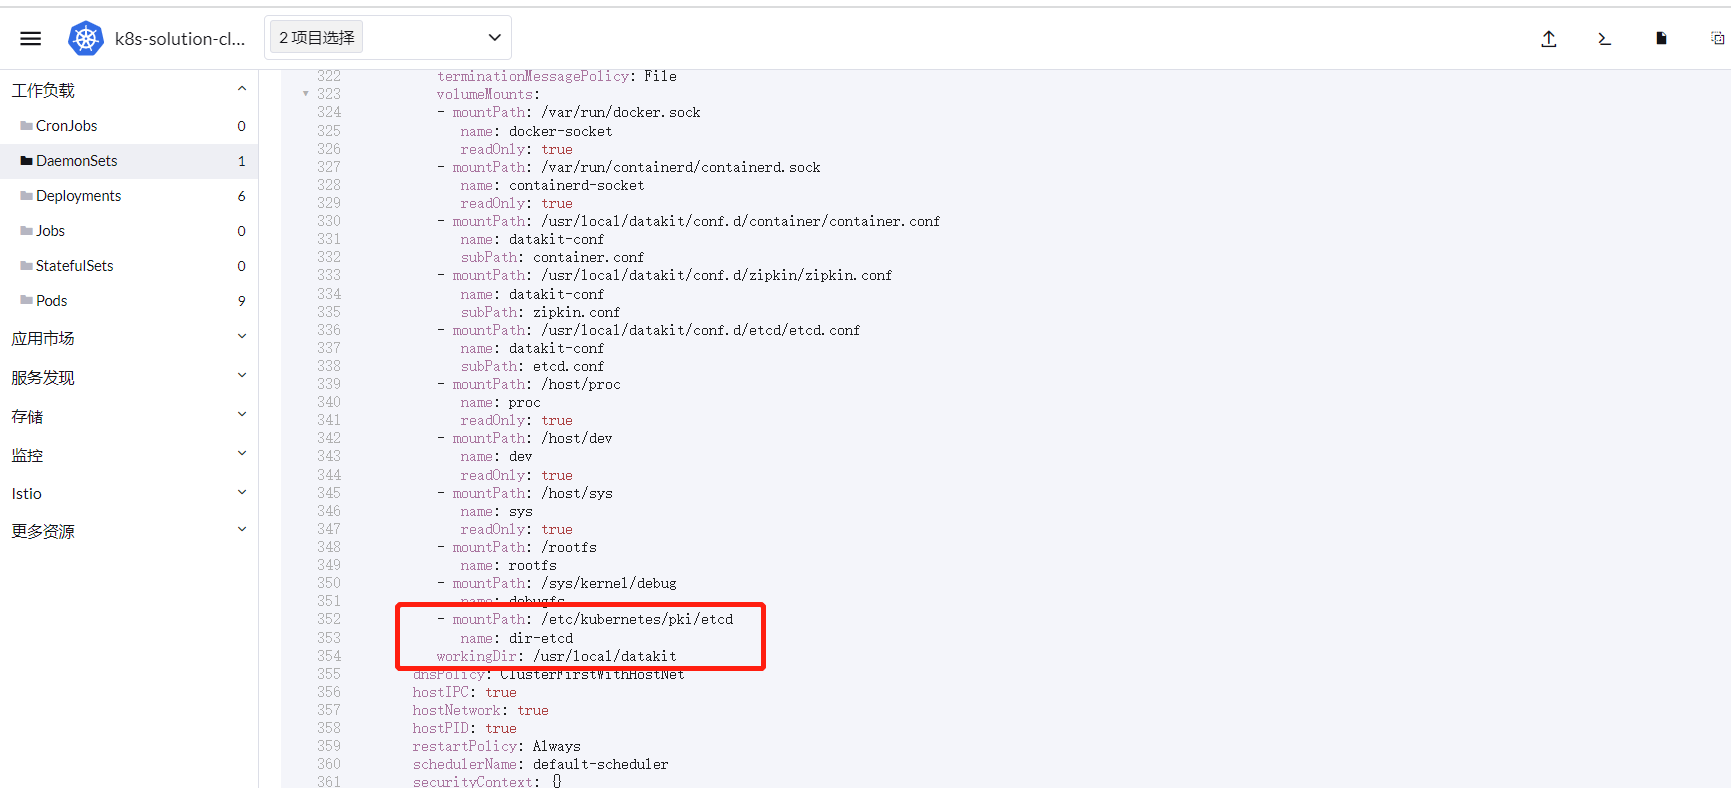
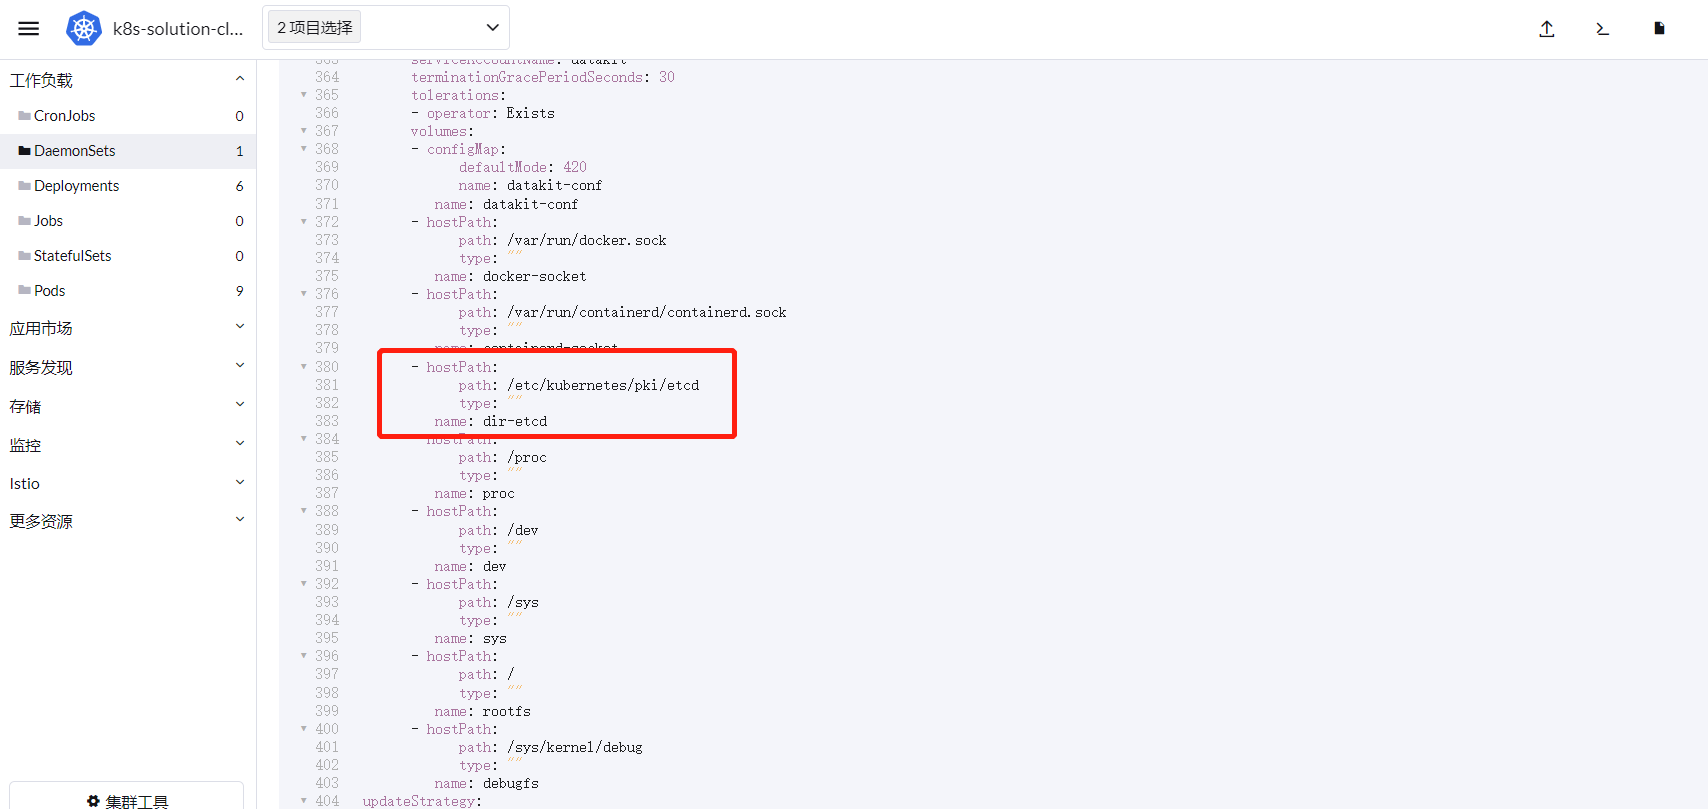
To collect ETCD metrics via https, the Kubernetes cluster certificates are required. That is, mount the /etc/kubernetes/pki/etcd directory of the Kubeadmin-deployed cluster to the /etc/kubernetes/pki/etcd directory of DataKit.
Complete the configuration using Rancher. Login to ‘Rancher’, under the cluster browsing tab, select the ‘k8s-solution-cluster’ cluster, then go to ‘Workloads’ -> ‘DaemonSets’. Select the datakit workspace, and on the datakit row, click Edit YAML on the right.

Add the content shown in the image, then click ‘Save’.
1.3.3 Enable ETCD Observability
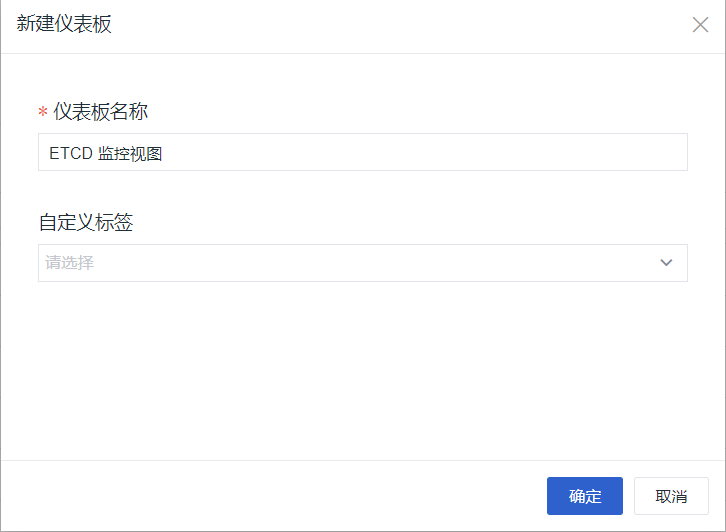
Login to ‘Guance’, click ‘Scenarios’ -> ‘Create Dashboard’, and select ETCD Monitoring View.
Fill in the dashboard name as ETCD Monitoring View (the name is customizable), then click ‘OK’.
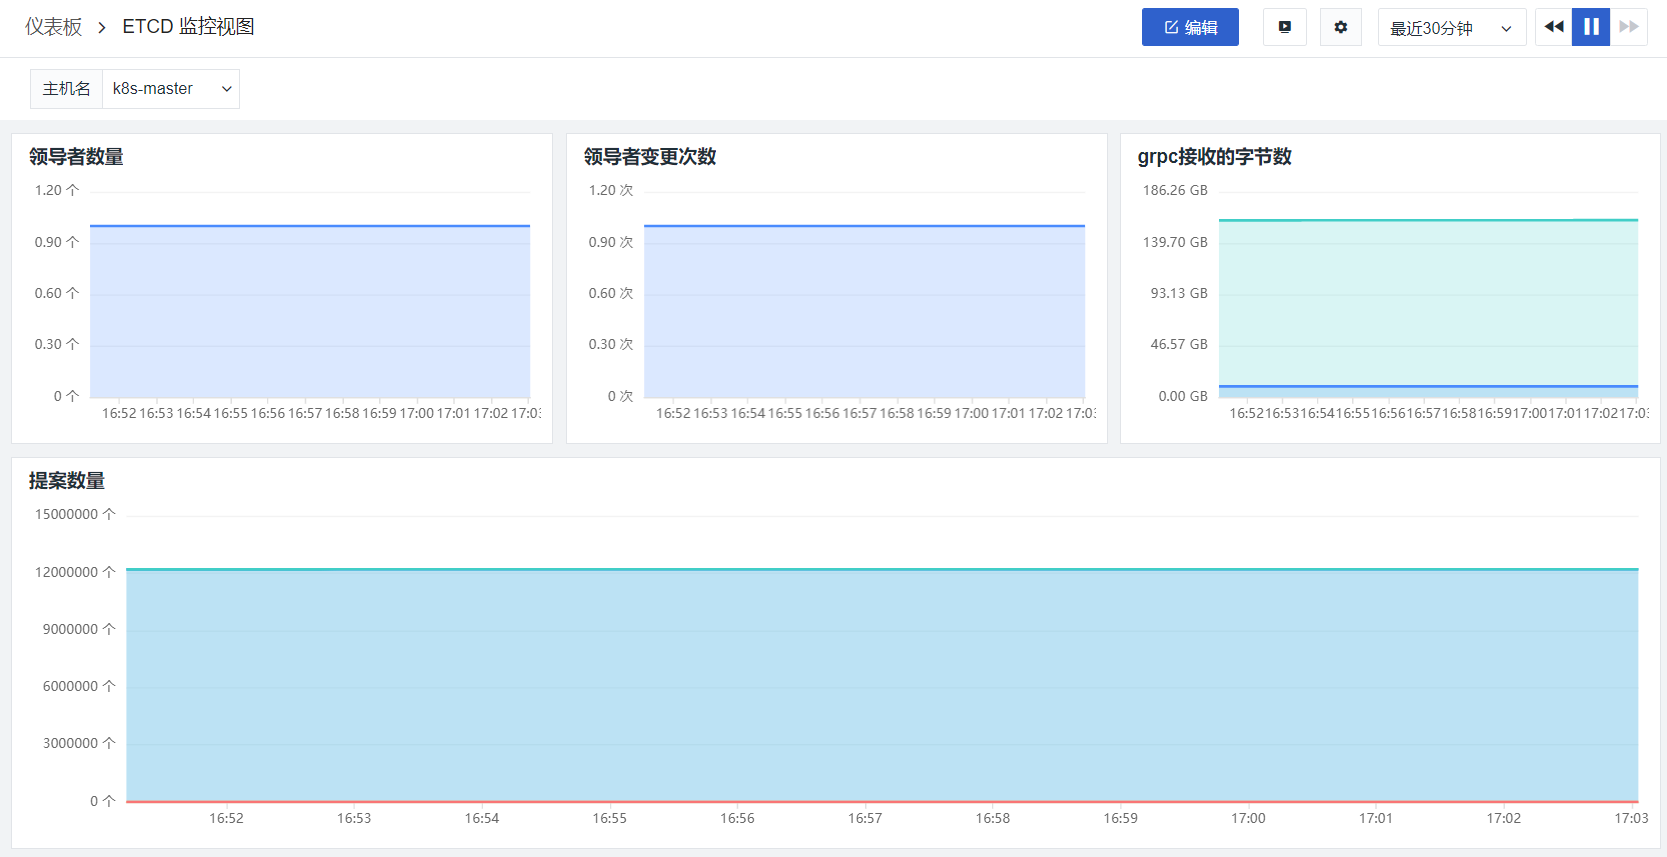
Enter the monitoring view and select the cluster name.
To learn more about ETCD integration methods, please refer to the ETCD integration documentation.
2 Istio Observability
2.1 Istio Mesh Monitoring View
Login to ‘Guance’, click ‘Scenarios’ -> ‘Create Dashboard’, and select Istio Mesh Monitoring View.
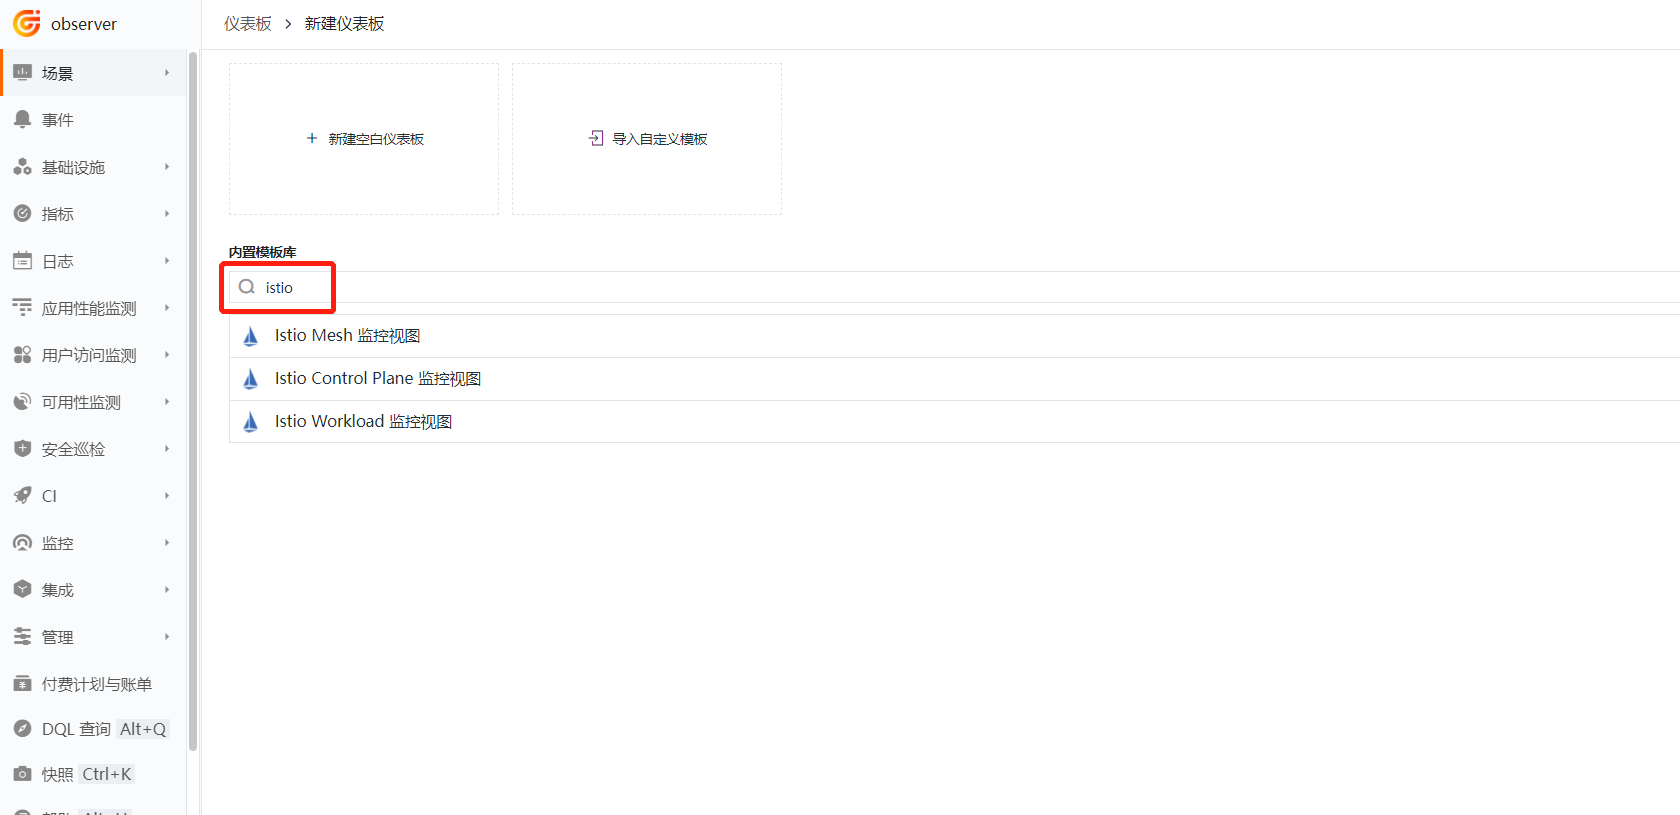
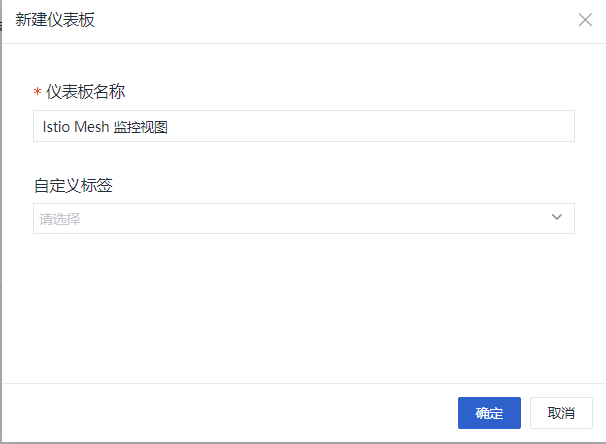
Fill in the dashboard name as Istio Mesh Monitoring View (the name is customizable), then click ‘OK’.
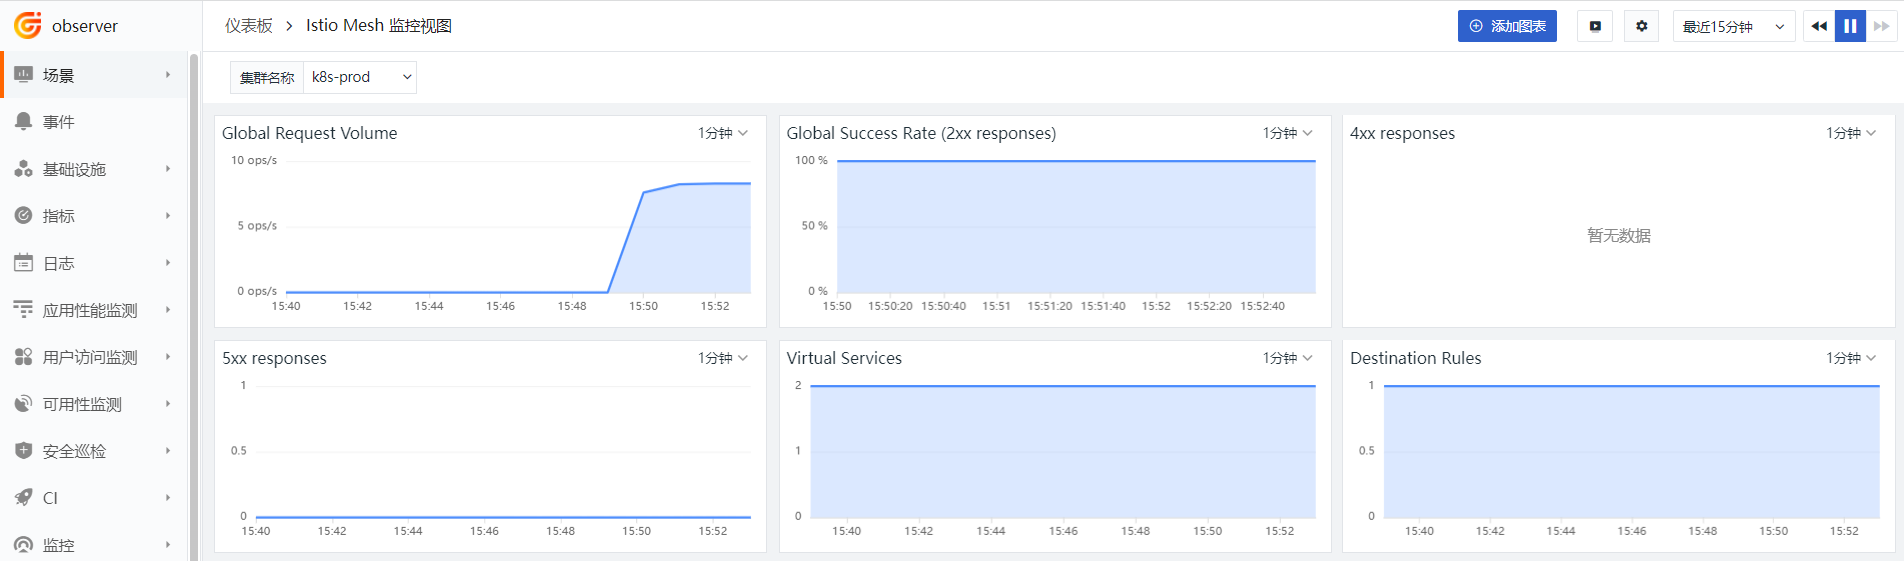
Enter the monitoring view and select the cluster name.

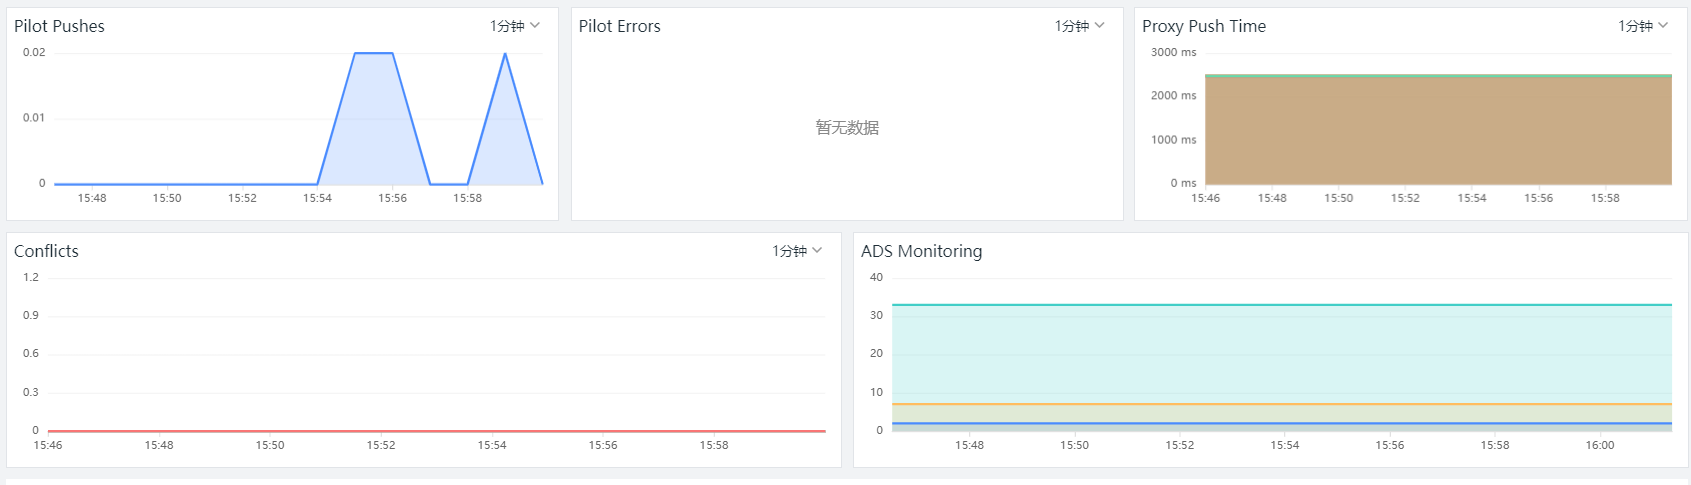
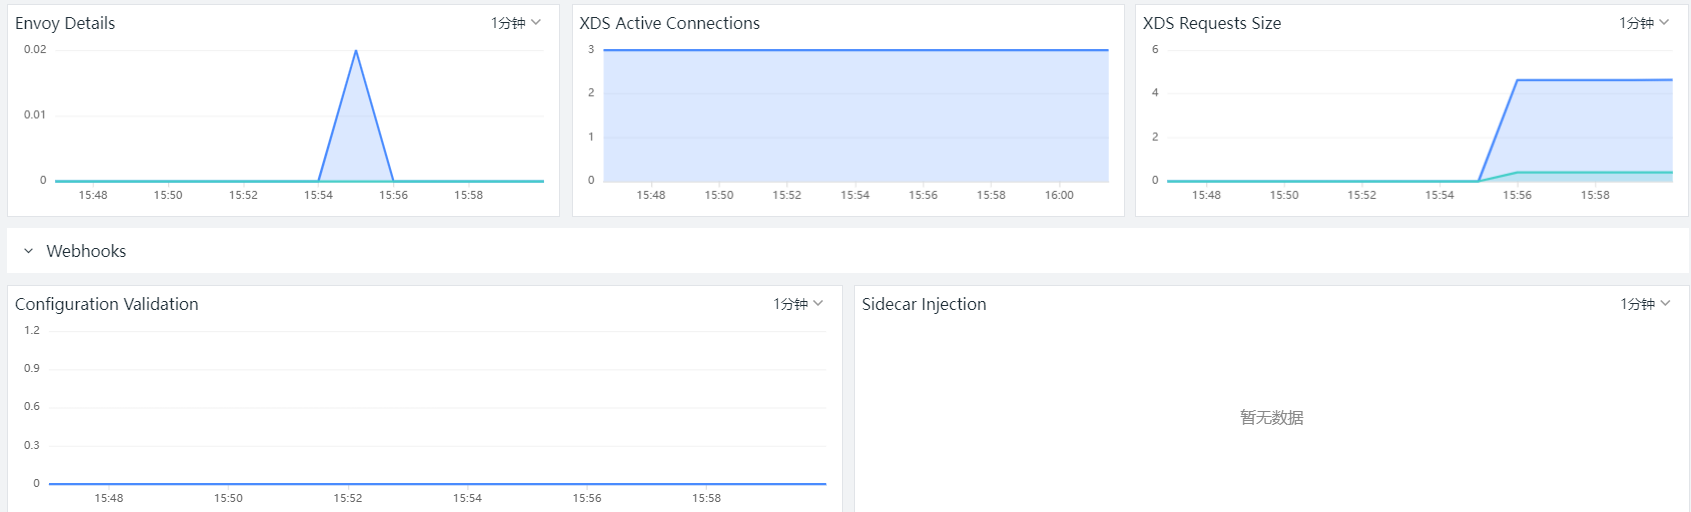
2.2 Istio Control Plane Monitoring View
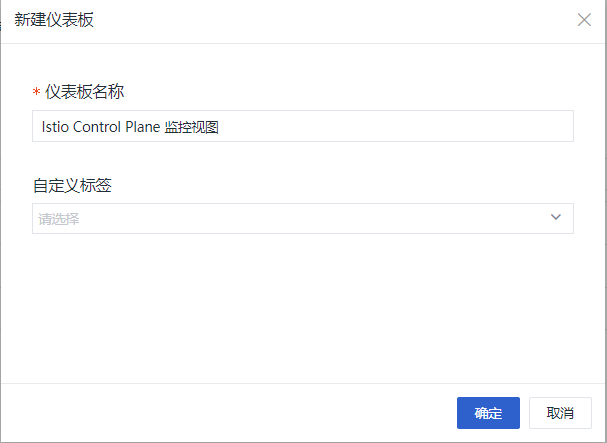
Login to ‘Guance’, click ‘Scenarios’ -> ‘Create Dashboard’, and select Istio Control Plane Monitoring View.
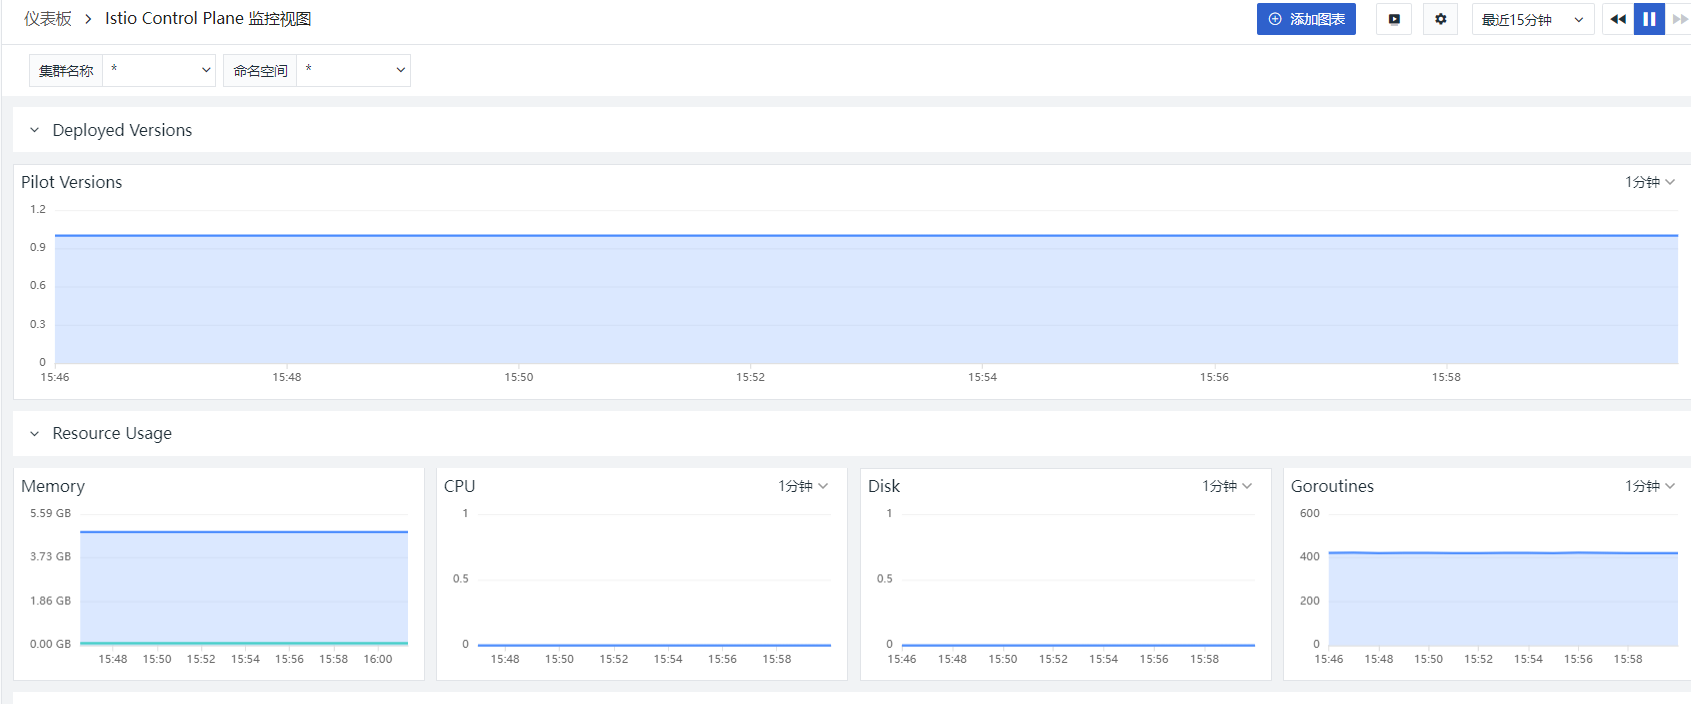
Enter the monitoring view and select the cluster name.
2.3 Istio Service Monitoring View
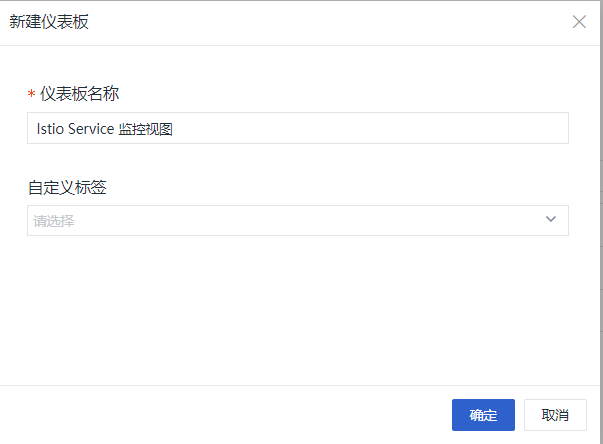
Login to ‘Guance’, click ‘Scenarios’ -> ‘Create Dashboard’, and select Istio Service Monitoring View.
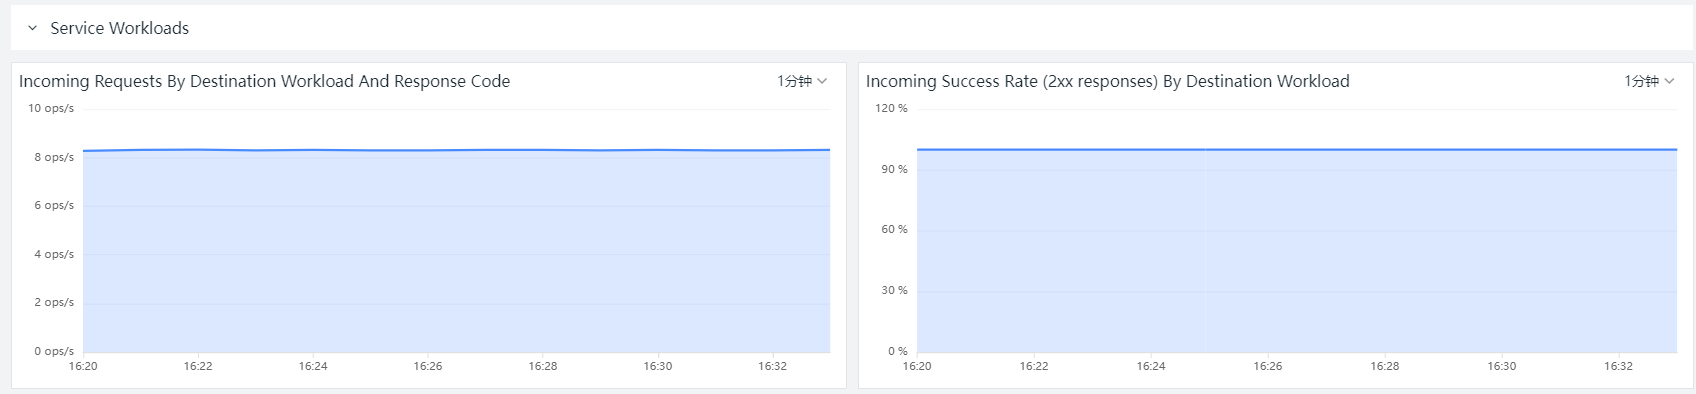
Enter the monitoring view and select the cluster name.

2.4 Istio Workload Monitoring View
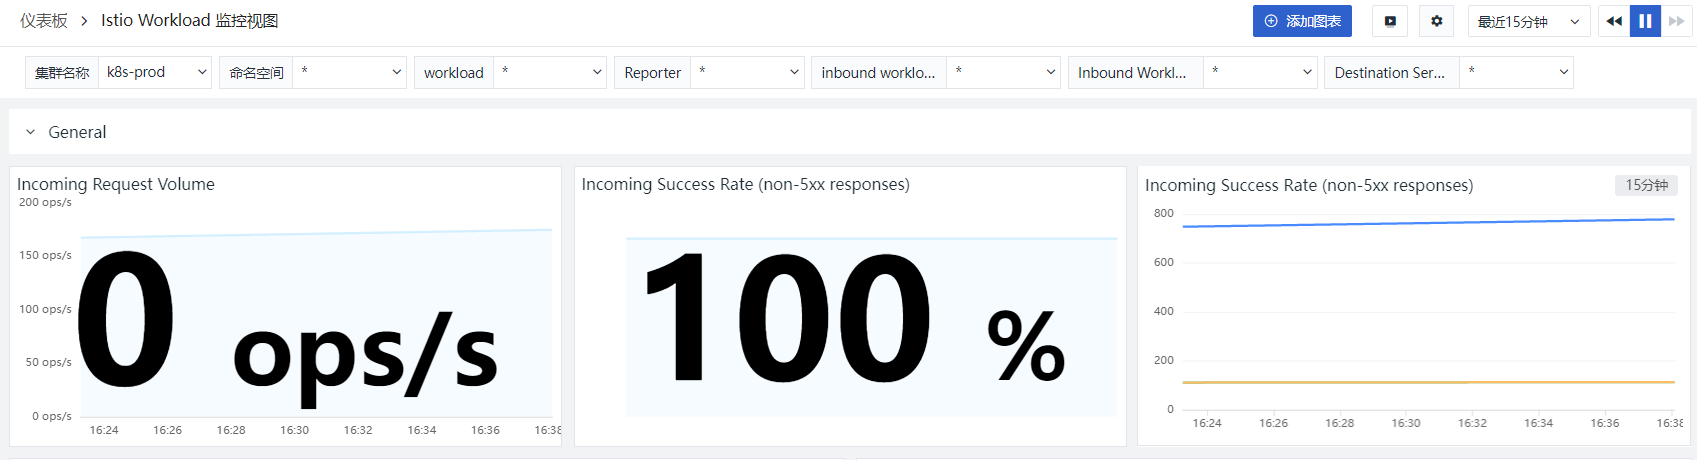
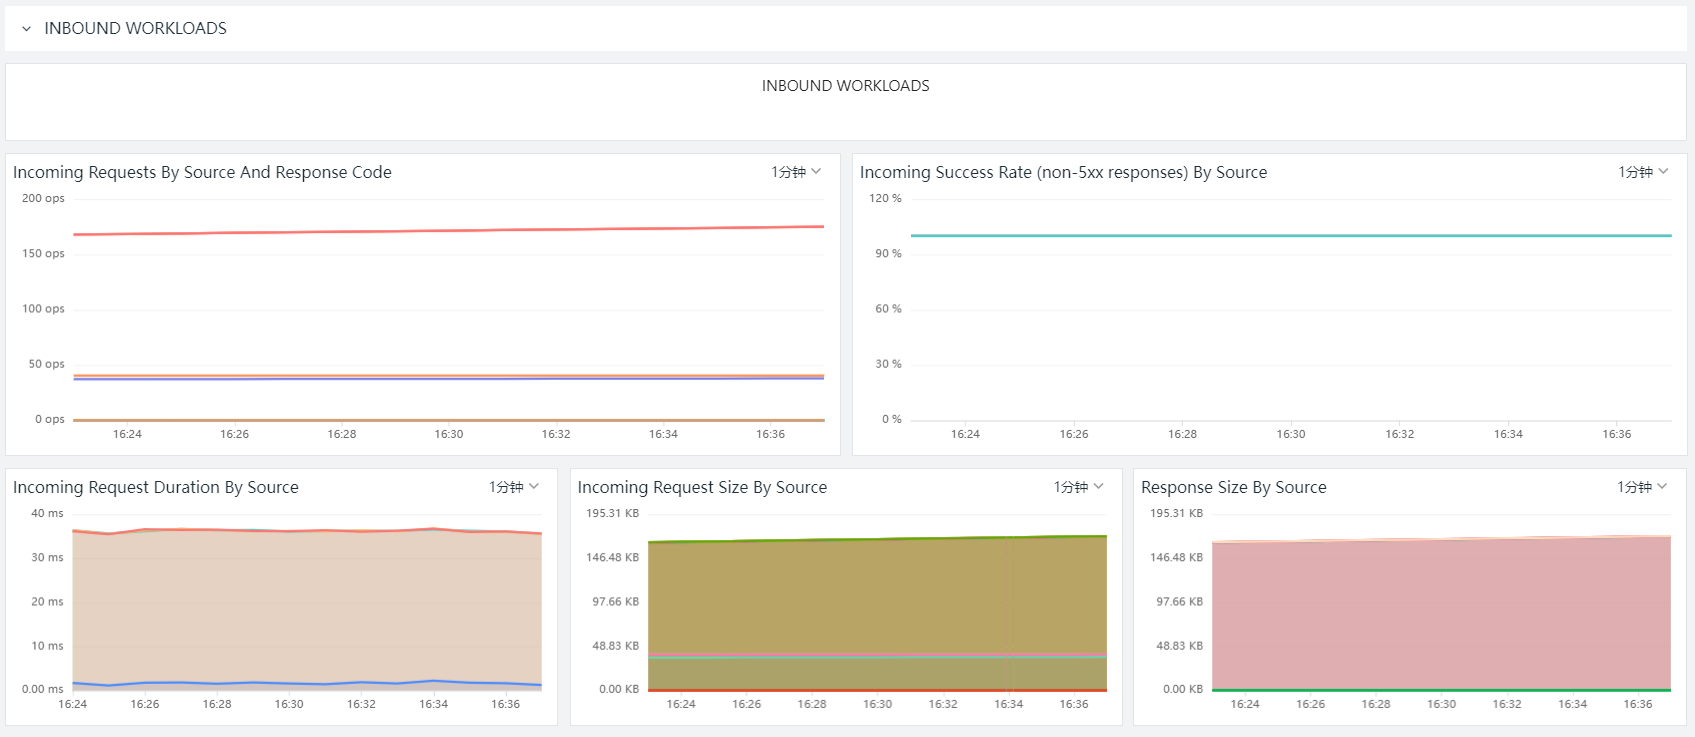
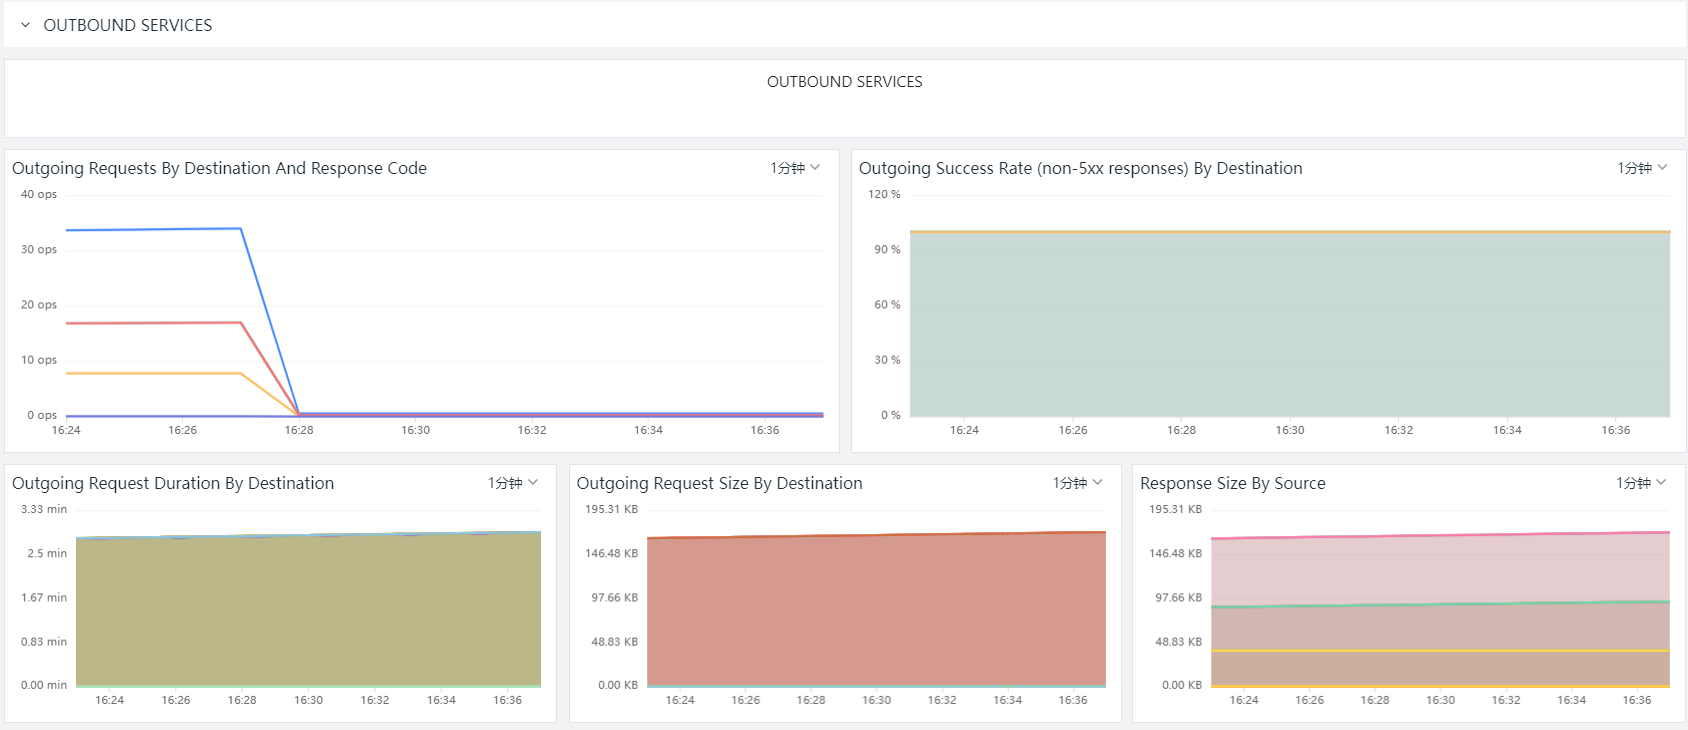
Login to ‘Guance’, click ‘Scenarios’ -> ‘Create Dashboard’, and select Istio Workload Monitoring View.
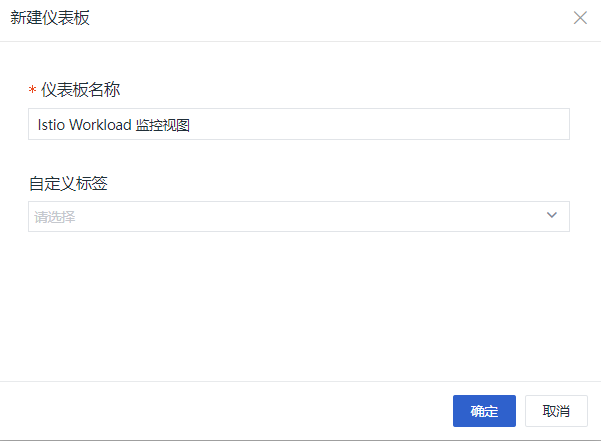
Enter the monitoring view and select the cluster name.