Data Correlation Analysis via Links
Introduction
Today, maintaining the stability of business systems increasingly depends on data. When collecting data to observe the entire system, the first step is to have a unified entry point for querying data information, and based on this data, extract key useful information to build visual dashboards and monitors for observation and alerting. If these modules work independently, they function fine when used alone. However, when troubleshooting becomes necessary, it is inconvenient, requiring repeated switching, searching, and viewing.
To address these issues, Guance provides three major features: Dashboards, Explorer, and Monitors, helping you efficiently query, monitor, and analyze data. Additionally, the Link feature allows you to smoothly navigate between modules, enabling data correlation analysis and comprehensive observability of the system.
Getting Started
This article focuses on the three major features—Explorer, Dashboard, and Monitor—and explains how to configure links to achieve data correlation analysis:
- Explorer: The Explorer records all collected data. Here you can trace the source, filter data based on tags, and view data details.
- Dashboard: Composed of visual charts, used to display key performance indicators intuitively.
- Monitor: Used to monitor data anomalies. When monitoring trigger conditions are met, alert events are generated and notifications are sent.
Prerequisites
If you have not yet registered for a Guance account or your workspace has no data, follow the steps below to complete data collection:
- Log in to the Guance console (If you don't have an account, click here to register);
- Install the DataKit collector;
- Go to the Integrations page in the console and enable the corresponding data collector.

Scenario 1: Correlation Analysis between Dashboard and Explorer
User Scenario Example
In a dashboard, add a chart to count the Number of errors in a Web application. Later, you find that multiple errors occurred in a certain period and want to locate these errors as quickly as possible for troubleshooting.
1. Configure a Link in the Chart
1) In the dashboard, create a statistical chart and configure the query first:
R::`error`:(COUNT(`error_source`) AS `Number of errors`) { `app_id` = '#{appid}' and `env` = '#{env}' and `version` = '#{version}' }
2) Click Link > Add Link, then configure the target URL and corresponding parameters. Taking the above DQL as an example, after discovering errors, we need to jump to the Explorer to filter out error data, so we need to pass the values of app_id, env, and version to the Explorer for filtering.
Warning
If you are unsure how to enter the target page link and parameter format, copy and paste the target page URL, then adjust it!
Additionally, if the copied link contains URLEncode encoding, it will be automatically decoded when pasted, making the URL more readable.

After configuring the link, save the chart.
Link Configuration Description
The platform includes some built-in links that users can quickly add by clicking the address input box. These links only retain the base URL of the target page, without parameters like time or query. You can manually add parameters according to your needs.
How to Add Parameters
Two methods are supported for configuring link parameters:
1) Directly append parameters after the URL in the input box;
2) Click Add Parameter to configure. The configured parameters will be automatically appended to the URL above, and the parameters in both places will always remain consistent.
- When configuring parameters, the system provides a set of commonly used keys that can be selected directly. Each key has a corresponding description and example. In addition to the preset parameters, you can manually enter any key/value to configure the link.

Using Template Variables to Pass Parameter Values
Template variables are supported in links to pass data information. The system will automatically display the currently available template variables, which you can directly copy and use.
What are Template Variables?
<Template variables> are used to pass dynamic parameter values. For example, in a line chart query with by host, when you click on a line, you are essentially selecting a specific host. Therefore, the value of host is not fixed and needs to be passed dynamically in the link. In this case, template variables are used. The template variable will pass the corresponding value based on the currently selected host.
Three types of template variables are supported: Time Variable, Tag Variable, and View Variable.
| Variable Type | Variable | Description |
|---|---|---|
| Time Variable | #{TR} | The time range of the current chart query. For example, if the current query time is Last 1 hour, then:Template Variable: &time=#{TR} is equivalent to &time=1h |
| Tag Variable | #{T} | The set of all grouping tags for the current chart query. For example, if the current chart query is:M::'datakit':(LAST('cpu_usage')) BY 'host','os'The query result is: host=abc, os=linux, then: Template Variable: &query=#{T} is equivalent to &query=host:abc os:linux |
| #{T.name} | The value of a specific tag in the current chart query. name can be replaced with any tagKey in the query.For example, if the current chart query is: M::'datakit':(LAST('cpu_usage')) BY 'host', 'os'The query result is: host=abc, os=linux, then: - Template Variable #{T.host} = abc- &query=hostname:#{T.host} is equivalent to &query=hostname:abc |
|
| View Variable | #{V} | The set of all view variables in the current dashboard. For example, if the current dashboard's view variables are: version=V1.7.0 and region=cn-hangzhou Template Variable &query=#{V} is equivalent to &query=version:V1.7.0 region:cn-hangzhou |
| #{V.name} | The value of a specific view variable in the current dashboard. name can be replaced with any variable name.For example, if the current dashboard's view variable is version=V1.7.0, then: - Template Variable #{V.version} = V1.7.0- &query=version:{V.version} is equivalent to &query=version:V1.7.0 |
Link Opening Method
The configured link supports three opening methods: Open in New Page, Open in Current Page, and Open in Side Panel.
2. Correlated Data Analysis
Next, take the Web Application Overview dashboard as an example to demonstrate how to perform data correlation query using chart links.
As shown in the figure below, after selecting a specific application and environment in the view variables, you find 2 error records. Next, we locate these 2 errors:
Click on the chart to open the dropdown menu, select Link > Jump to Error Explorer. This will open the corresponding Explorer page, carrying over the query time range and all filter conditions, and finding those 2 error records. This achieves one-click correlation query. You can then view the details of these errors and find the root cause.

Scenario 2: Correlation Analysis between Monitor and Explorer
User Scenario Example
Create a monitor to detect if a service encounters 5xx errors. Once an error is detected, immediately generate an alert notification and locate these errors as quickly as possible for troubleshooting.
1. Configure a Link in the Monitor
1) Create an Application Performance Metric Detection monitor and configure the Detection Metrics and Trigger Conditions.

2) In the Event Content, insert the link to which you want to jump. The text entered here must use Markdown syntax. According to the user scenario above, when a service encounters a 5xx error, an alert is triggered. Therefore, the link we insert will jump to the Distributed Tracing Explorer and filter out error traces.
-
First, configure parameters like
serviceandhttp_status_codein the link so that the filters are carried over to the Explorer. -
Since the monitor's detection interval is set to Last 15 minutes, the time range for the query in the Explorer should also be the same (i.e., the event notification time as the end time, and 15 minutes before as the start time).

After completing all configurations, save the monitor.
Link Configuration Description
Any link can be inserted in the event content, such as links to the Explorer, dashboards, external links, etc. Configure them according to your use case.
For example, the detection interval is 15 minutes, and the detection metric query is:
The added link will automatically include the following two parameters:
1) Filter condition parameter: &query=http_status_code:>=500 service:{{service}} (the grouping after BY will be filled in as a template variable)
2) Time parameter: Using the event generation time as the end time, and 15 minutes before as the start time, for example: &time={{ date * 1000 - 900000}},{{date * 1000}} (This uses template variable calculations)
Template Variable Description
Template variables are supported in the event content to pass data information. The system will automatically display the currently available template variables. Simply click the {{ button or manually enter {{ to bring up the variable list.
What are Template Variables?
<Template variables> are used to pass dynamic parameter values. When configuring the event title and event content of a monitor, in addition to the fixed text you write, you can use fields in the event to render the text. There are two types of template variables in monitors:
1) Fixed attribute variables: For example,
{{df_status}} (event status), {{df_monitor_checker_name}} (monitor name), {{df_workspace_name}} (workspace name), {{Result}} (the detected value when the event was generated), etc.
2) Detection dimension variables: For example, if the detection metric query has by 'host','service', then you can use template variables {{host}} and {{service}} to render the detection object.
For more details, please click to view Monitor Template Variables.

2. Correlated Data Analysis
Next, take the Application Performance Metric Detection monitor as an example to demonstrate how to correlate data by configuring a link in the monitor.
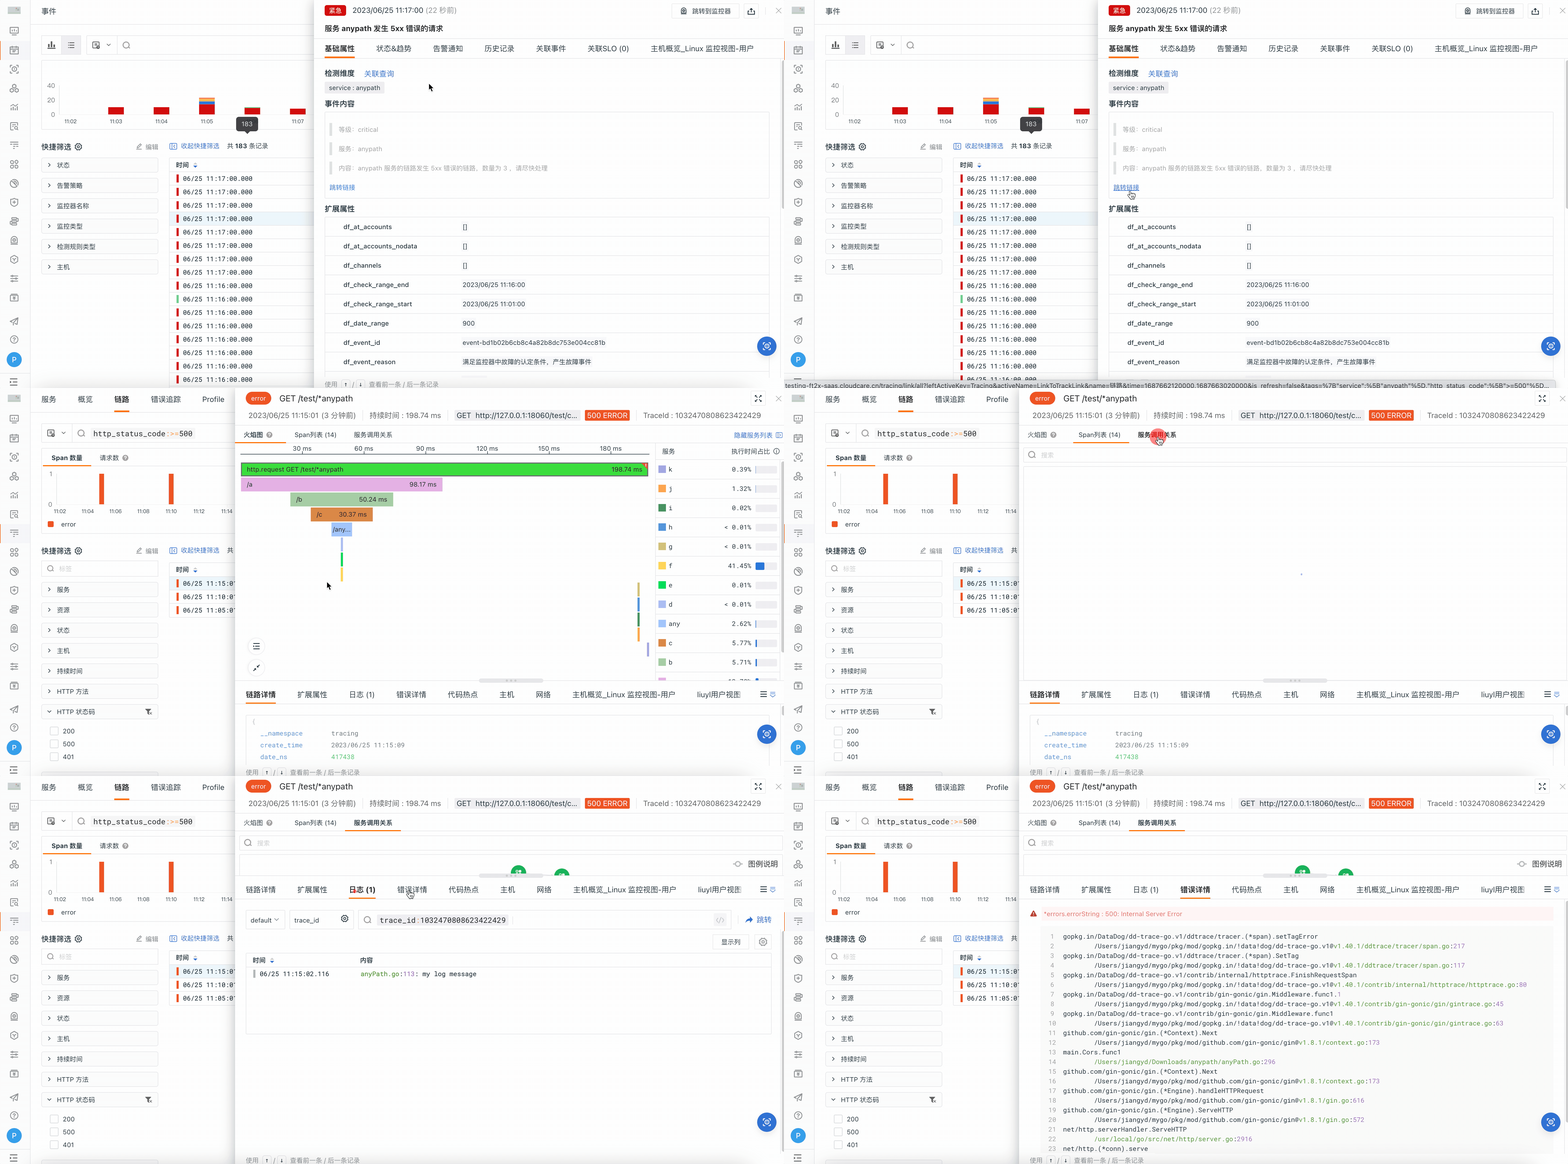
Continuing from the monitor configuration in the previous step, the triggered alert event will display the configured notification content, which includes a Jump Link. Click it to view the corresponding error trace data. You can then analyze the cause of the error from multiple dimensions, such as trace details, associated logs, and network conditions.