Guance vs Alibaba Cloud ARMS 3.0
Product Comparison
Background:
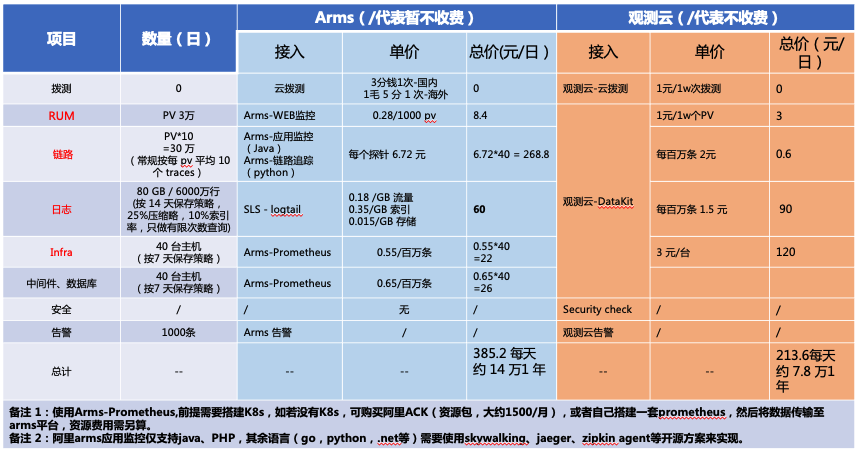
40 Alibaba Cloud servers, log volume 70-80 GB/day (including trace data) ≈ 60 million lines/day, RUM PV 30,000/day
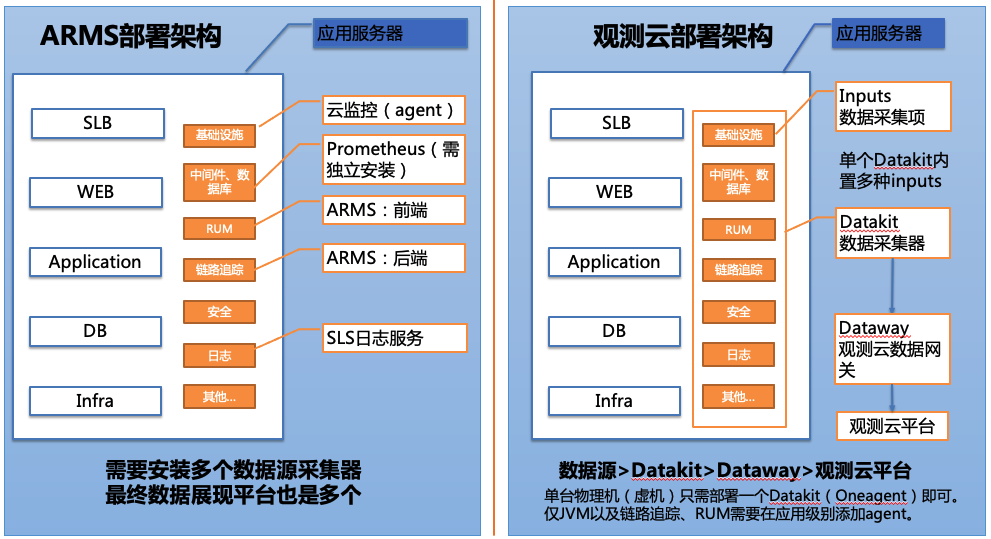
Deployment Architecture Comparison
Cost Comparison
(Based on this test only)
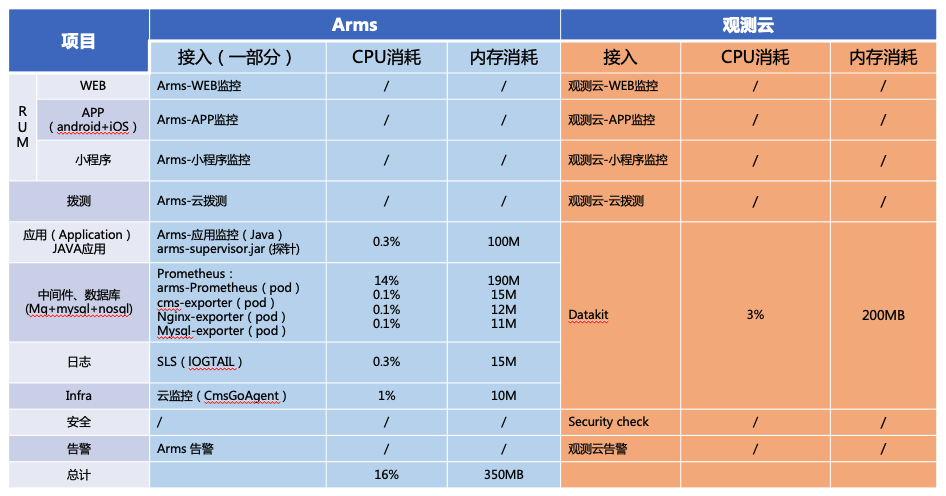
Resource Consumption Comparison
(Based on this test only)
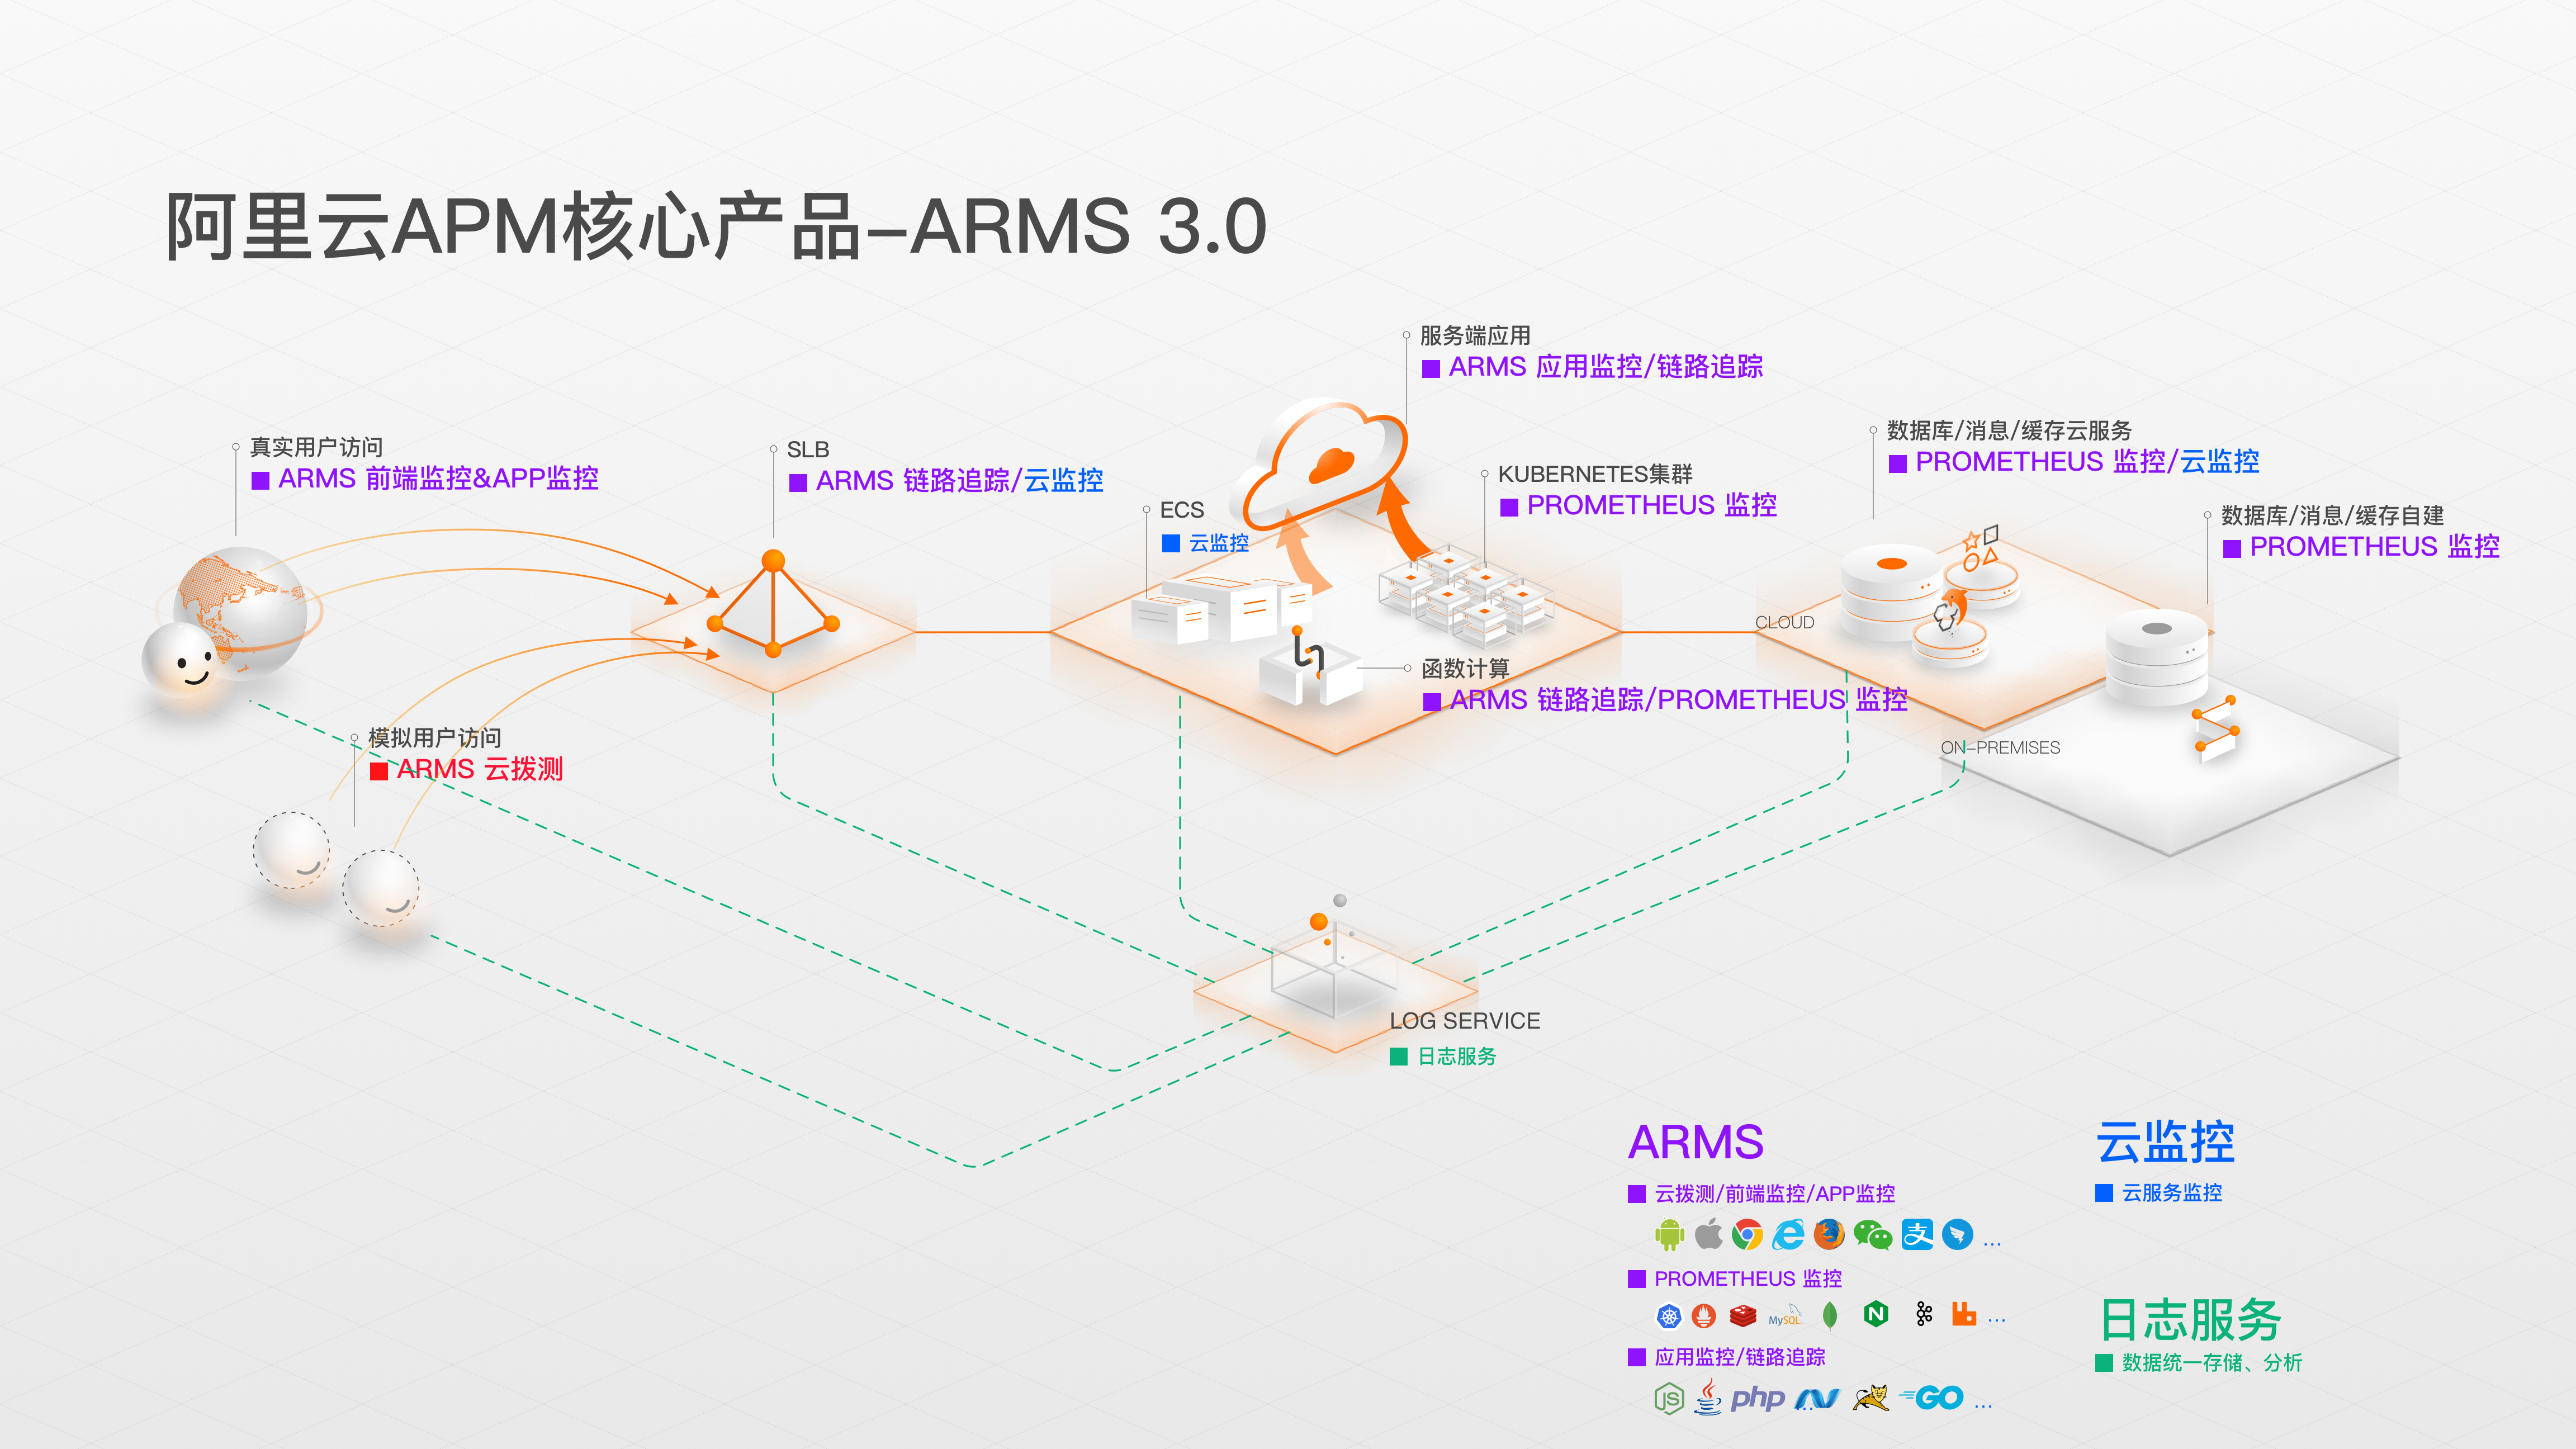
ARMS 3.0
Application Real-Time Monitoring Service (ARMS) is an Application Performance Monitoring (APM) product that includes three sub-products: Application Monitoring, Prometheus Monitoring, and Frontend Monitoring. It covers performance management for distributed applications, container environments, browsers, mini-programs, apps, and more, enabling end users to achieve full-stack performance monitoring and end-to-end distributed tracing diagnosis, making application operations efficient and effortless.
Prometheus
Alibaba Cloud Prometheus Monitoring fully integrates with the open-source Prometheus ecosystem, supports a wide variety of component monitoring, provides multiple out-of-the-box pre-built dashboards, and offers a fully managed Prometheus service.
Integration Methods
-
ACK (Alibaba Cloud Container Service for Kubernetes) clusters
-
Self-built Kubernetes clusters
-
Remote Write
Configuration
Prometheus data is integrated based on Kubernetes clusters. You can directly create a [Managed Kubernetes cluster]. After creation, you can see the built-in Kubernetes views and dashboards on the page.

Pricing
Prometheus Monitoring is billed based on the number of metrics reported. Metrics are divided into two types: basic metrics and custom metrics. [Basic metrics] are free, while custom metrics are charged.
| Daily Reported Metrics Range (millions) | Unit Price (CNY/million) | Daily Cost Range (CNY) |
|---|---|---|
| 0~50 | 0.8 | 0~40 |
| 50~150 | 0.65 | 40~105 |
| 150~300 | 0.55 | 105~187.5 |
| 300~600 | 0.45 | 187.5~322.5 |
| 600~1200 | 0.35 | 322.5~530.5 |
| Over 1200 | 0.25 | Over 530.5 |
Notes
-
Each reported metric cannot exceed 2 KB.
-
Each metric is stored for a maximum of 15 days. Metrics older than 15 days are cleared. You can contact support to adjust the retention period.
CloudMonitor
CloudMonitor is a service that monitors Alibaba Cloud resources and internet applications.
Integration Methods
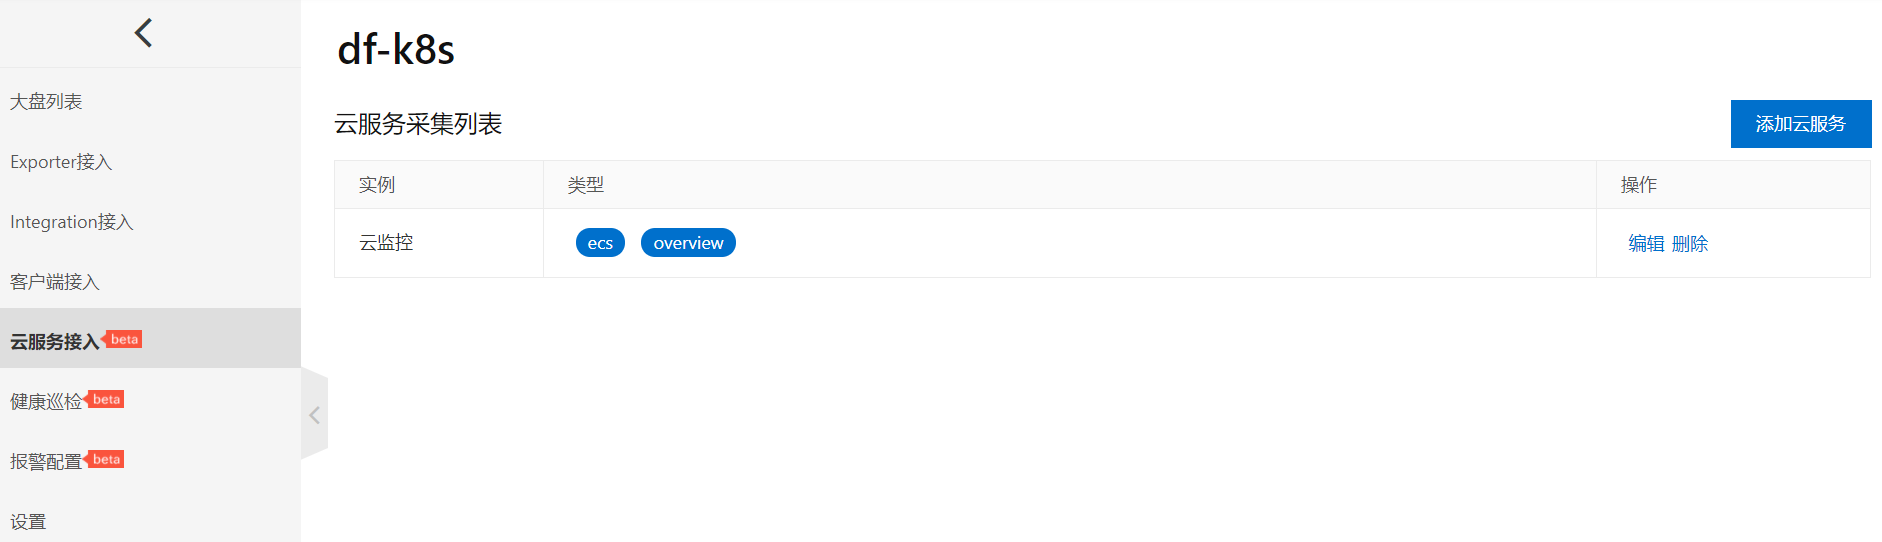
Prometheus integrates with Alibaba Cloud CloudMonitor, allowing you to monitor cloud services in a specified region under your cloud account via Prometheus.
Currently, it supports ECS, RDS, MongoDB, Redis, OSS, RDS, NAT, SLB, RocketMQ, Kafka, EIP, ES, and DRDS.
Configuration
Add cloud service integration from the Prometheus configuration interface.
Pricing
After integrating CloudMonitor with Prometheus, CloudMonitor itself is not charged additionally. The collected monitoring data is billed according to Prometheus rules.
Frontend Monitoring
ARMS Frontend Monitoring focuses on monitoring Web, Weex, and mini-program scenarios. It measures the health of Web and mini-program pages from three aspects: page load speed (performance), page stability (JS errors), and external service call success rate (API).
Integration Methods
Web scenarios
-
CDN installation of the probe
-
NPM installation of the probe
Weex scenarios
- Weex integration
Mini-program scenarios
-
DingTalk mini-program
-
Alipay mini-program
-
WeChat mini-program
-
Others
Configuration
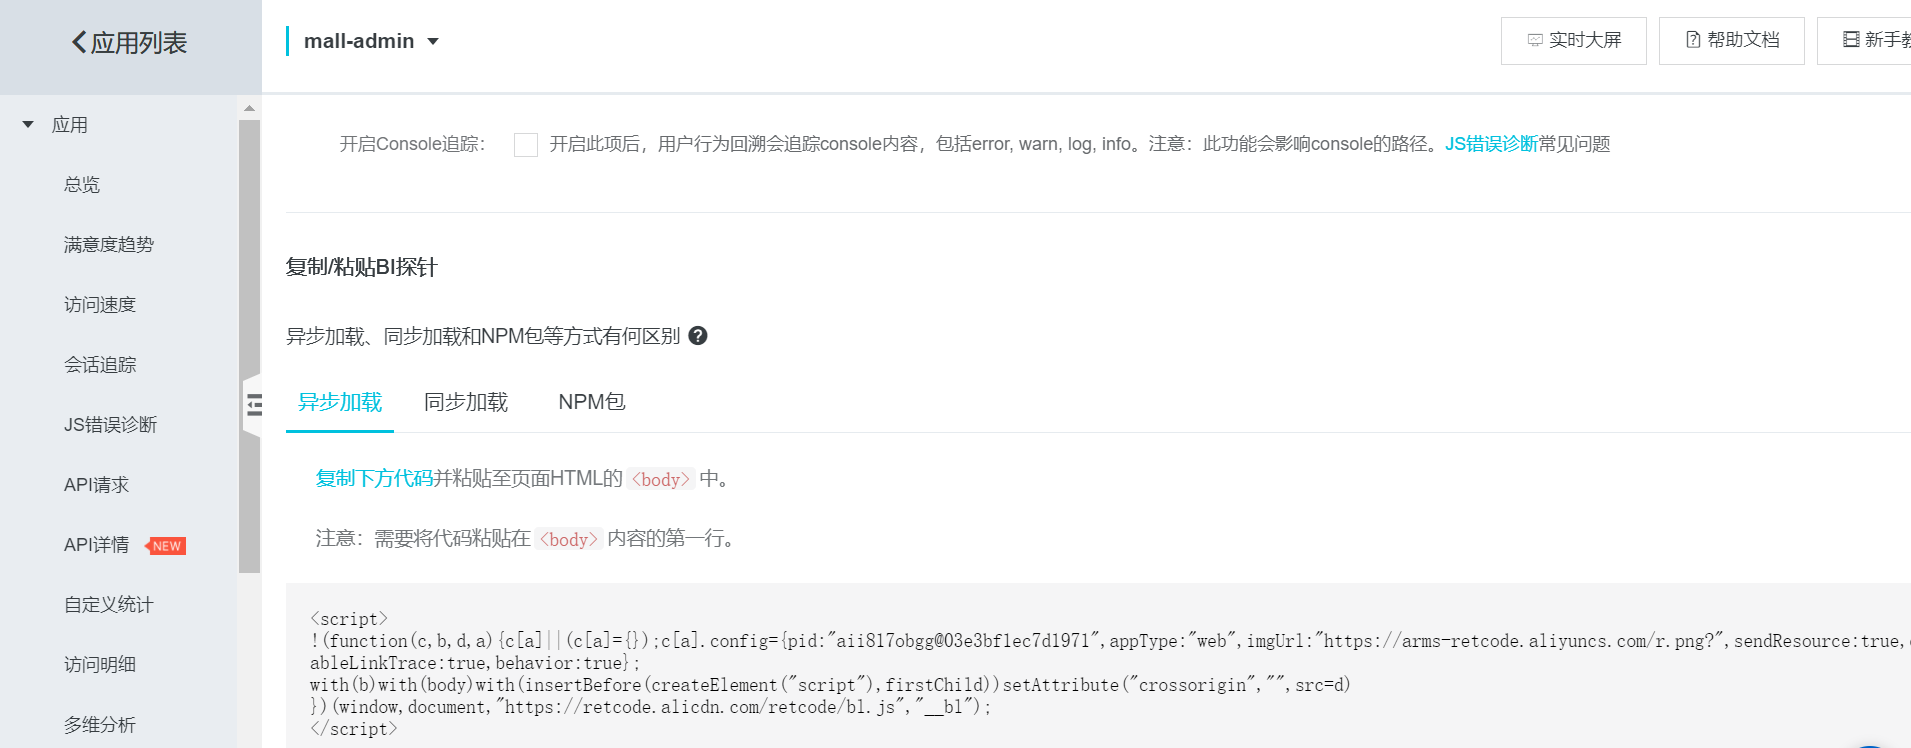
Create an application site, select the Web type, copy the BI probe (code) and place it as the first line inside the HTML <body>.
Pricing
Basic Edition
Pay-as-you-go
| Billing Metric | Unit Price |
|---|---|
| All sites: frontend data report count | 0.028 CNY / 1,000 page views reported |
Professional Edition
Pay-as-you-go
| Billing Metric | Unit Price |
|---|---|
| All sites: frontend data report count | 0.28 CNY / 1,000 page views reported |
Resource Packages
| Name | Specifications | Price | Equivalent Unit Price | Validity Period |
|---|---|---|---|---|
| Starter Package | 2 million page views reported | 420 CNY | 0.21 CNY / 1,000 frontend data reports | 6 months |
| Intermediate Package | 16 million page views reported | 2,520 CNY | 0.158 CNY / 1,000 frontend data reports | 1 year |
| Advanced Package | 128 million page views reported | 15,120 CNY | 0.118 CNY / 1,000 frontend data reports | 1 year |
| Premium Package | 600 million page views reported | 60,000 CNY | 0.1 CNY / 1,000 frontend data reports | 1 year |
Notes
-
Frontend Monitoring: The billing metric is mainly the number of page view (PV) calls and API call reports, plus custom report counts. Billed daily; any portion less than 1,000 reports is rounded up to 1,000. Frontend monitoring data is cached by default for 30 days.
-
Reference formula for daily report traffic: Daily report traffic = Daily PV + (Daily API calls - 500,000) * 0.1 + Custom reports.
-
Data reports generated by one PV = 1 + API calls + custom data reports. In most cases, the number of data reports per page is roughly equal to the number of page views.
Application Monitoring
ARMS Application Monitoring is an Application Performance Management (APM) product. Without modifying code, you only need to install a probe on the application, and ARMS can monitor the application comprehensively, helping you quickly locate faulty and slow interfaces, reproduce call parameters, and identify system bottlenecks, thereby significantly improving the efficiency of online issue diagnosis.
Data Integration
By deployment environment
-
EDAS
-
ACK (Alibaba Cloud Container Service for Kubernetes)
-
Open-source K8s clusters
-
Docker clusters
-
Other environments (e.g., self-built IDC)
By development language
-
Java
-
PHP
Configuration
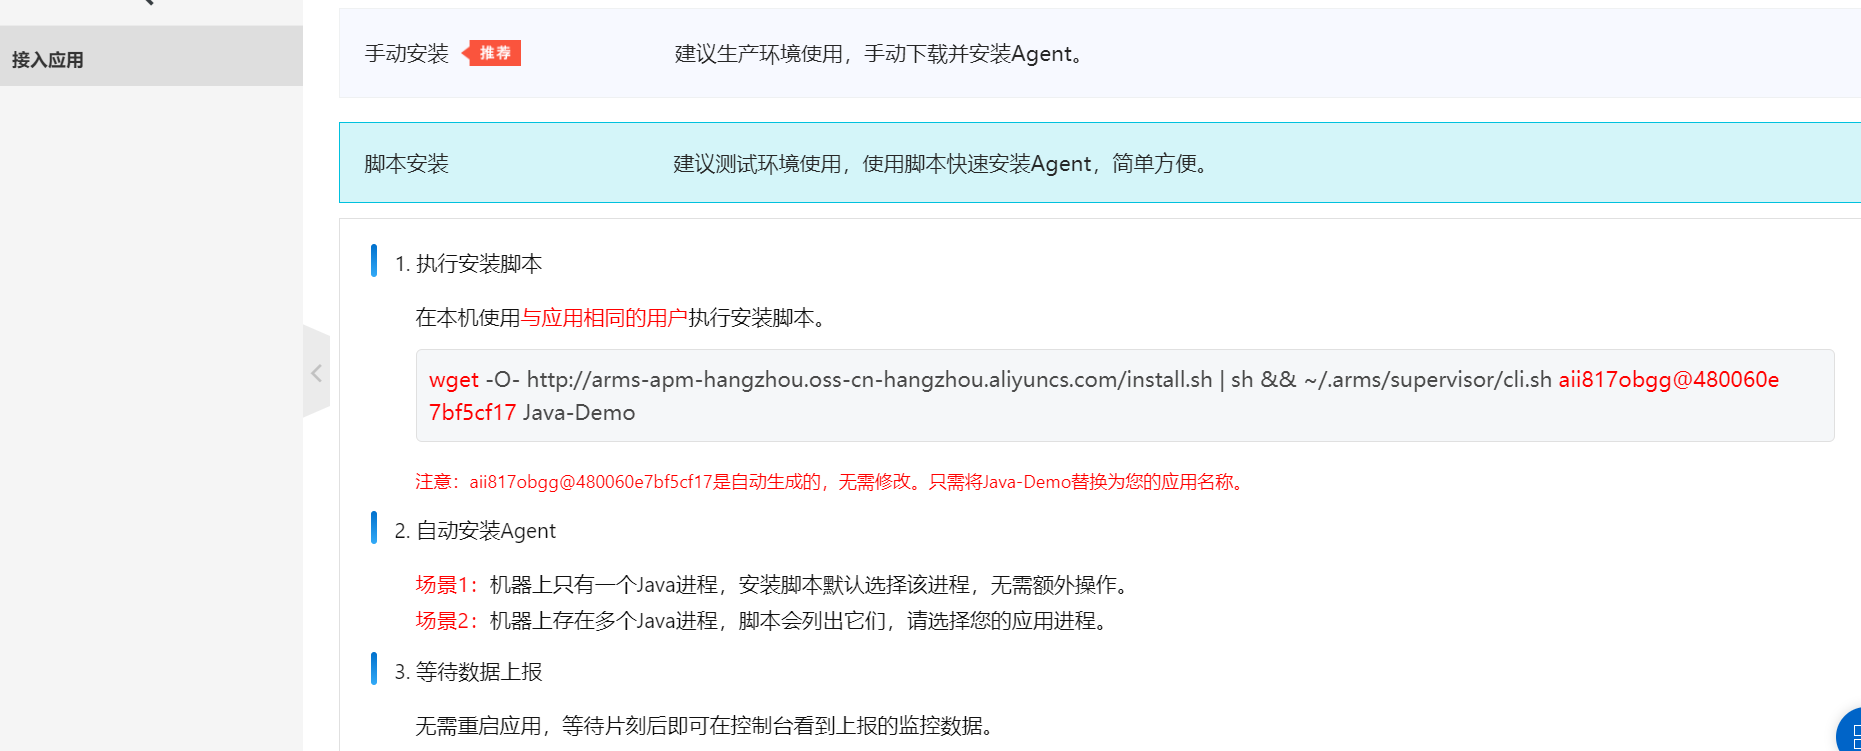
Integrate the application, select Java language, and use the script auto-installation method.
Pricing
Basic Edition
| Name | Billing Content | Notes |
|---|---|---|
| Application Monitoring Basic Edition - Metric Storage Cost | 3-day metric storage: free. 30-day metric storage: 1.2 CNY per probe per day. 90-day metric storage: 2.4 CNY per probe per day. 180-day metric storage: 3.6 CNY per probe per day. |
(1) Default metric storage period is 3 days, free. To extend the metric storage period, go to Application Monitoring > Global Configuration > Storage Period Configuration. (2) One probe monitors one application instance (e.g., one Tomcat instance, one Java process). (3) You can upgrade to the Professional Edition; after upgrading, billing follows the Professional Edition. |
| Application Monitoring Basic Edition - Trace Storage Cost | 0.2 CNY per million request traces per day Default sampling policy: store 1 day for free. |
(1) The first request trace per minute per interface is sampled and stored for free for 1 day. To store more request traces, open the target application page, go to Application Settings > Custom Configuration > Sampling Rate, and adjust; pay-as-you-go. (2) All calls under the same TraceId are considered one request trace. A single trace can contain up to 10 spans; spans beyond 10 are billed as one-tenth of a request trace. (3) You can upgrade to the Professional Edition; after upgrading, billing follows the Professional Edition. |
Professional Edition
Pay-as-you-go:
| Billing Item | Unit Price |
|---|---|
| Pay-as-you-go | 6.72 CNY per probe per day |
Resource Packages:
| Name | Specifications | Price | Equivalent Unit Price | Validity Period |
|---|---|---|---|---|
| Starter Package | 150 probe*days (resources for 150 probes for 1 day, or 5 probes for 30 days) | 700 CNY | 4.68 CNY / probe*day | 6 months |
| Intermediate Package | 1,200 probe*days (resources for 1,200 probes for 1 day, or 40 probes for 30 days) | 4,200 CNY | 4.38 CNY / probe*day | 1 year |
| Advanced Package | 9,600 probe*days (resources for 9,600 probes for 1 day, or 320 probes for 30 days) | 25,200 CNY | 2.616 CNY / probe*day | 1 year |
| Premium Package | 36,500 probe*days (resources for 100 probes for 365 days) | 66,838 CNY | 1.8312 CNY / probe*day | 1 year |
| Platinum Package | 109,500 probe*days (resources for 300 probes for 365 days) | 174,000 CNY | 1.5696 CNY / probe*day | 1 year |
| Diamond Package | 182,500 probe*days (resources for 500 probes for 365 days) | 238,710 CNY | 1.308 CNY / probe*day | 1 year |
Notes
-
One probe monitors one application instance (e.g., one Tomcat instance, one Java process).
-
Application Monitoring: Traffic is calculated based on the total online time of all applications, billed daily. Application monitoring data is cached by default for 60 days.
Cloud Synthetic Monitoring
Cloud Synthetic Monitoring is a service that monitors the performance and user experience of internet applications (e.g., Web pages, network links).
Integration Methods
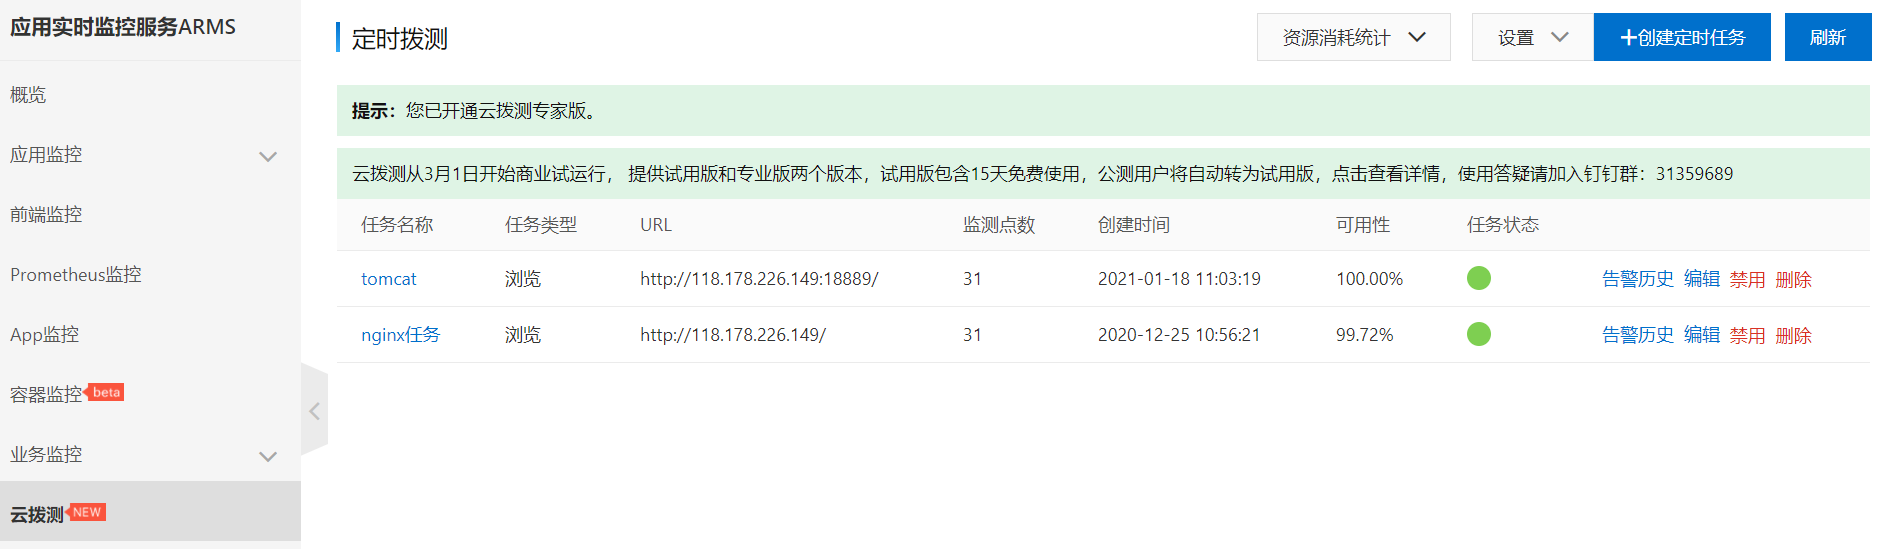
Cloud Synthetic Monitoring uses a globally distributed monitoring network to perform browser or network tests on target web applications (e.g., websites, servers). Each task currently supports up to 50 monitoring points.
Configuration
Create a synthetic test task, add the URL and monitoring points (up to 50) to be monitored.
Pricing
Cloud Synthetic Monitoring started public beta on November 20, 2020. You can enable ARMS 15-day free trial or any paid version to use Cloud Synthetic Monitoring. During the public beta, even after the 15-day trial expires, you can still use Cloud Synthetic Monitoring for free.
Log Monitoring
For highly customized business scenarios, you can create log monitoring tasks to freely aggregate required metrics, generate the data and reports you need, and flexibly configure alerts.
Integration Methods
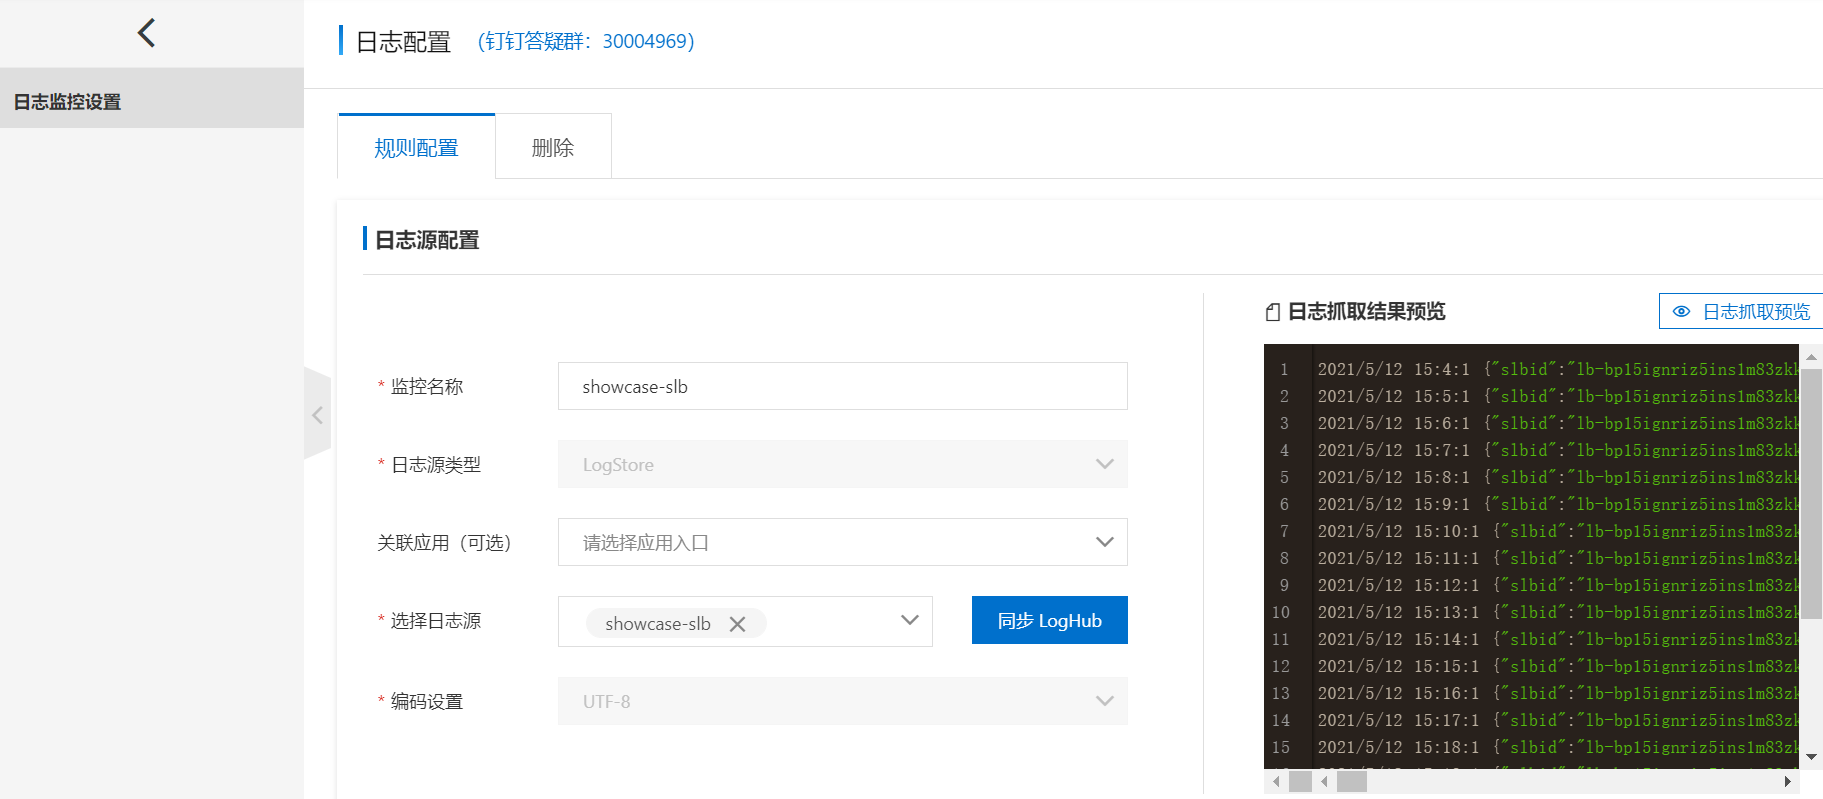
ARMS Log Monitoring supports fully customizable monitoring tasks. The process includes two key steps: configuring data sources and configuring metrics, as shown below.

Configuration
Prerequisites: [Enable Alibaba Cloud Log Service], synchronize LogHub, and generate the required metrics.
Pricing
Metrics generated from log integration are billed according to Prometheus rules.
Guance
Guance is a cloud service platform designed to build full-stack observability for every complete application in the cloud computing and cloud-native era.
Integration Methods
-
Frontend page configuration
-
DataKit data collection
Configuration
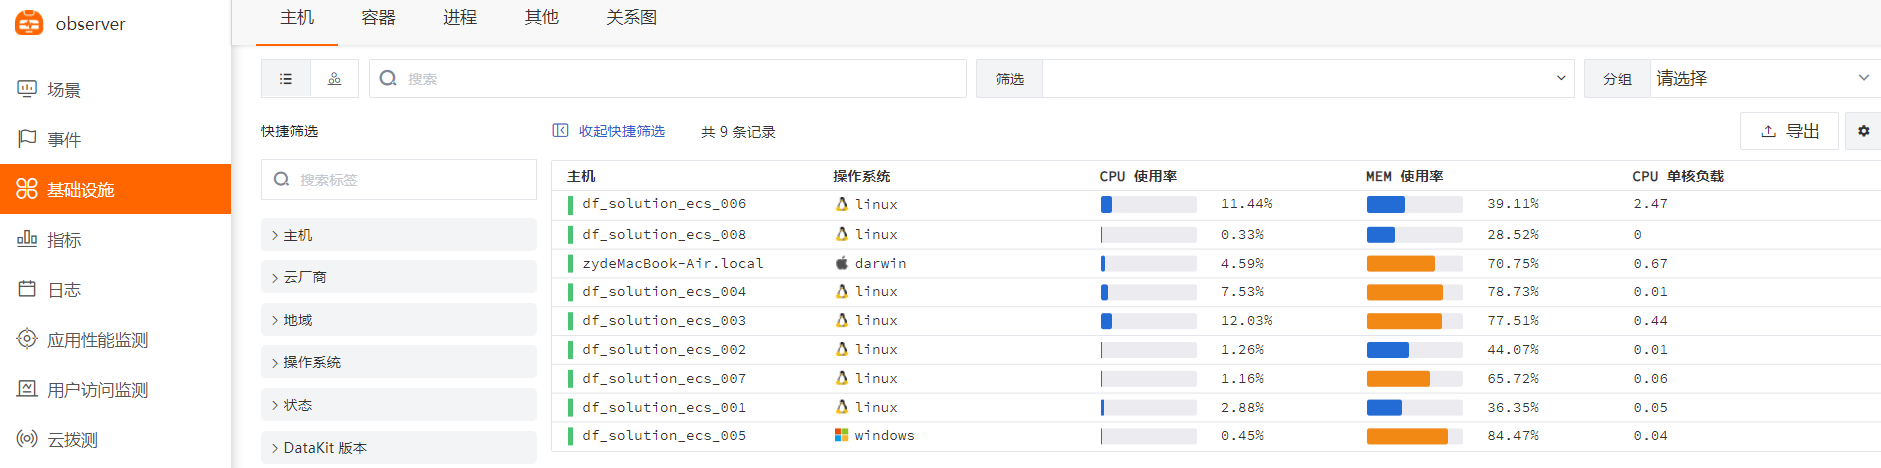
Host Infrastructure
Install DataKit, enable [CPU, System, Mem, Disk, DiskIO, Swap, Net collection] by default, and view Infrastructure information.
Application Middleware
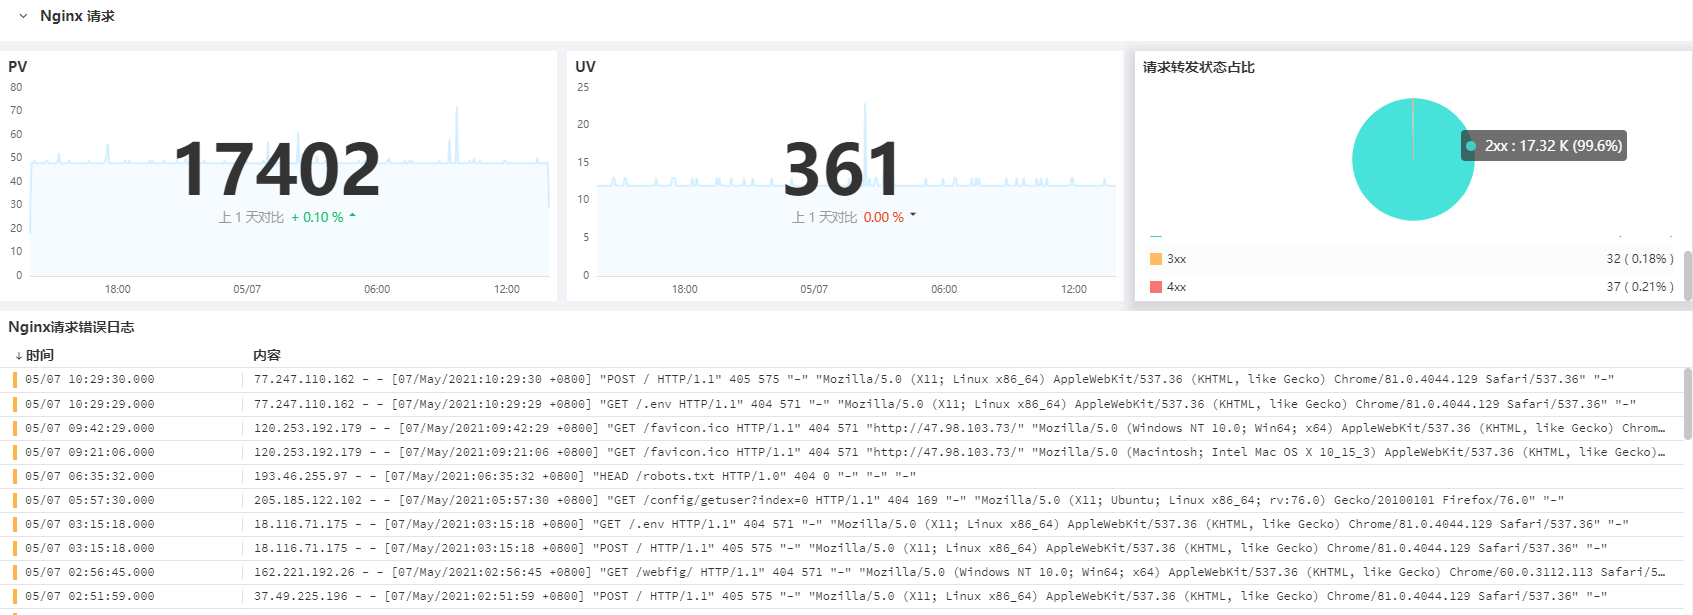
Configure DataKit for [MySQL data collection] and [Nginx data collection]. Click the Nginx in the host's Integrated Runtime Status to navigate to the built-in view.

Logs
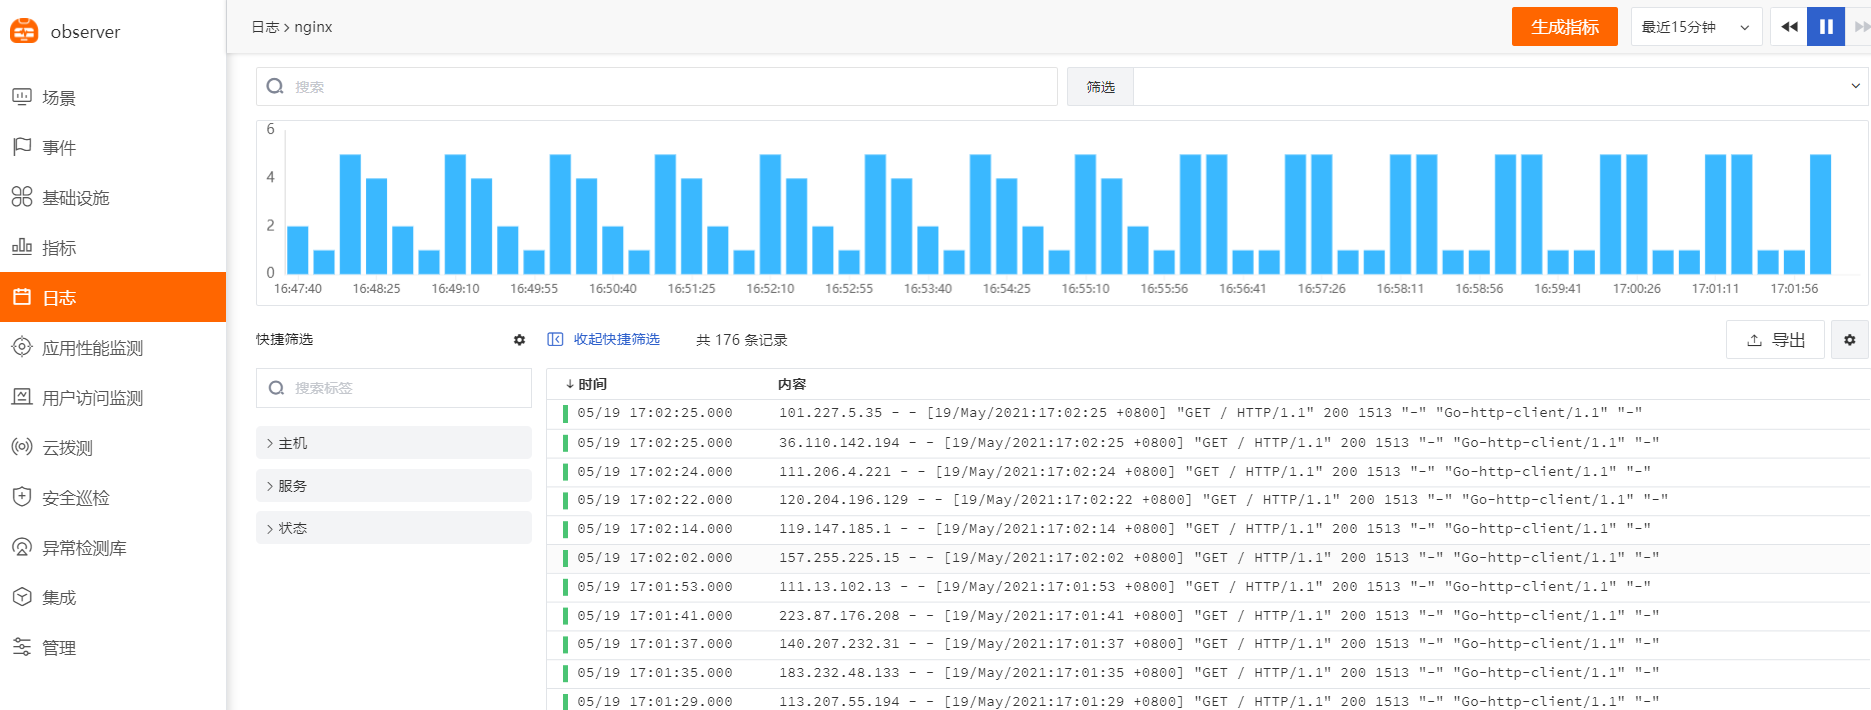
Configure the log settings in [MySQL data collection] and [Nginx data collection] in DataKit, or enable custom log configuration with [Tailf data collection]. Once created, you can see the log list.
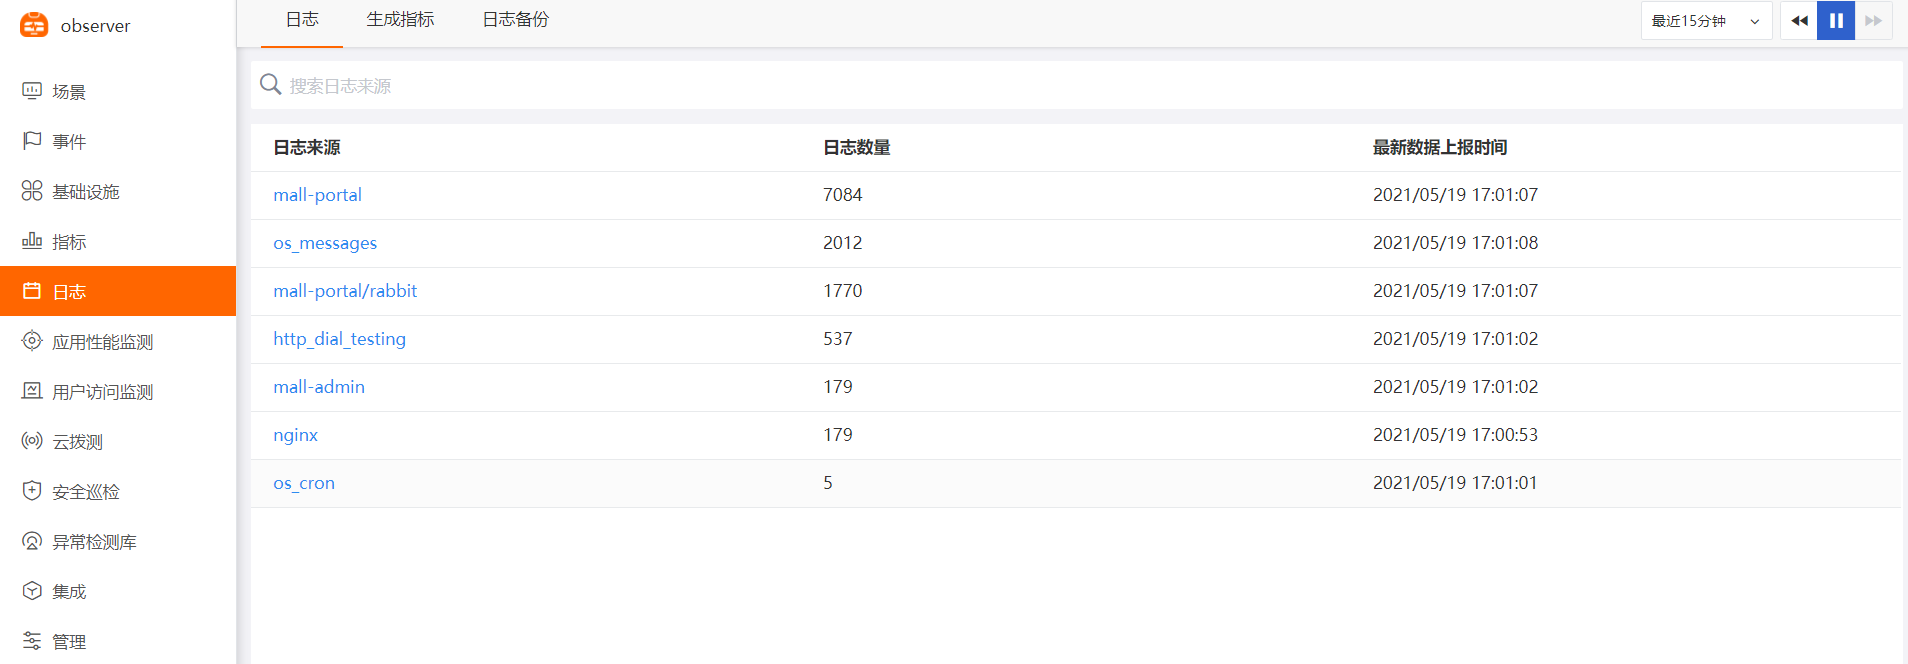
Click the log source to view detailed log information (with Grok data parsing applied).
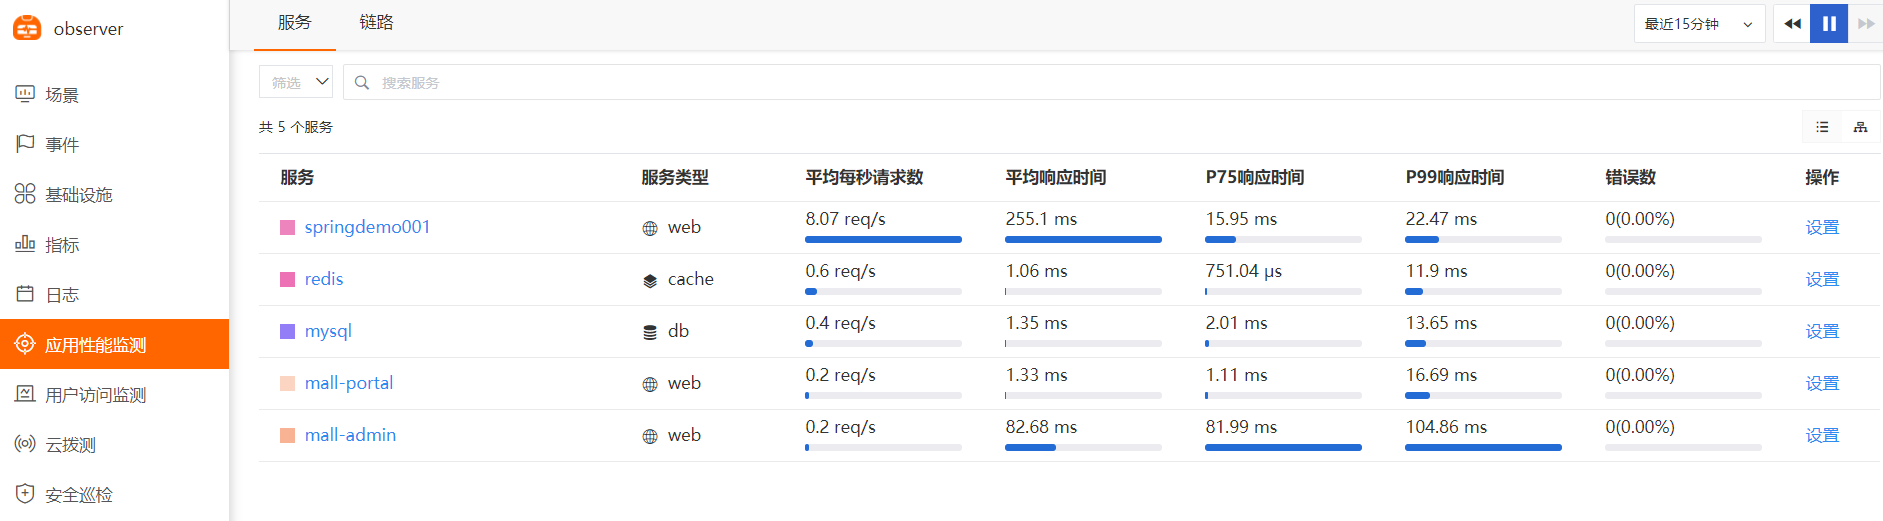
Application Performance Monitoring (APM)
Download dd-java-agent.jar, add it as a javaagent parameter to the Java application startup command (-javaagent:/root/mall/dd-java-agent-0.75.0.jar), configure DataKit's [dd-trace data collection]. After successful creation, you can see the application list.
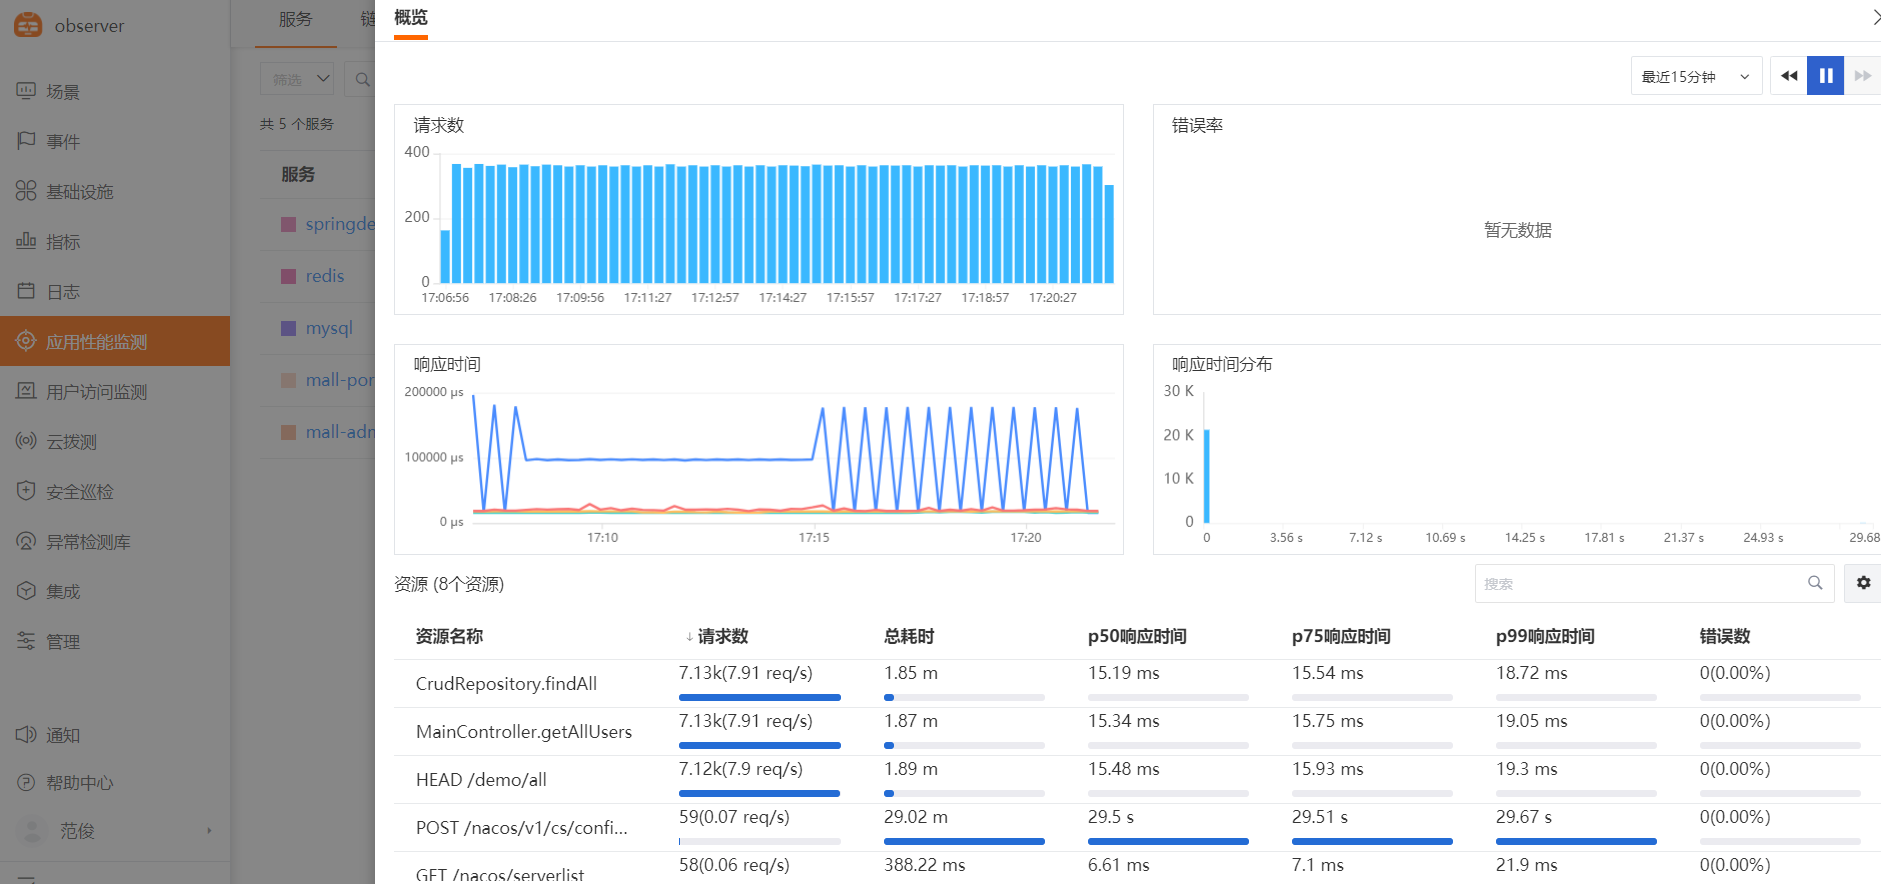
Click the service name to view the overview.
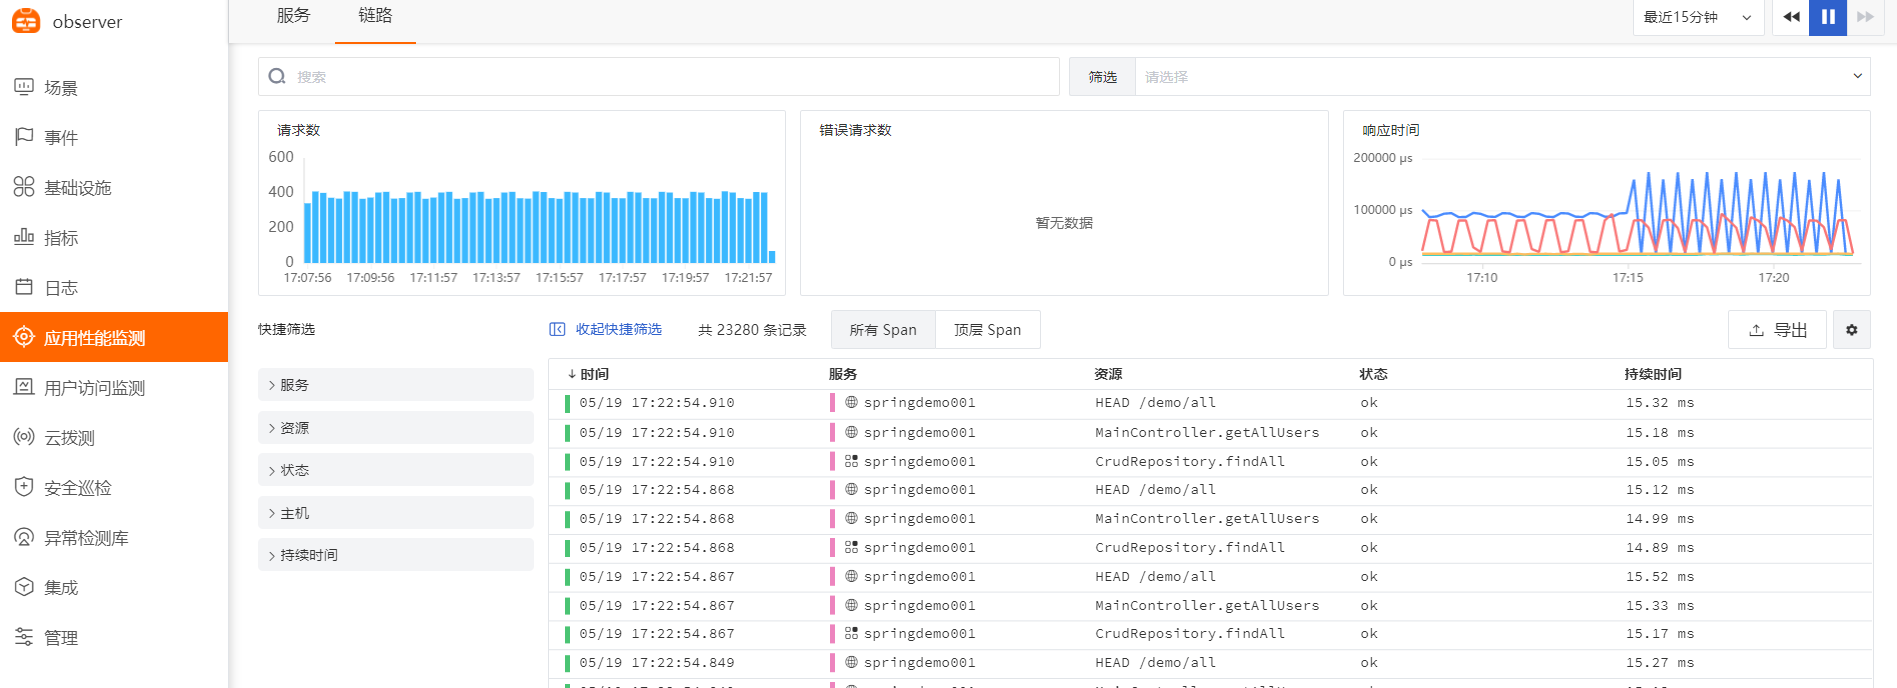
Click the trace to view trace details.
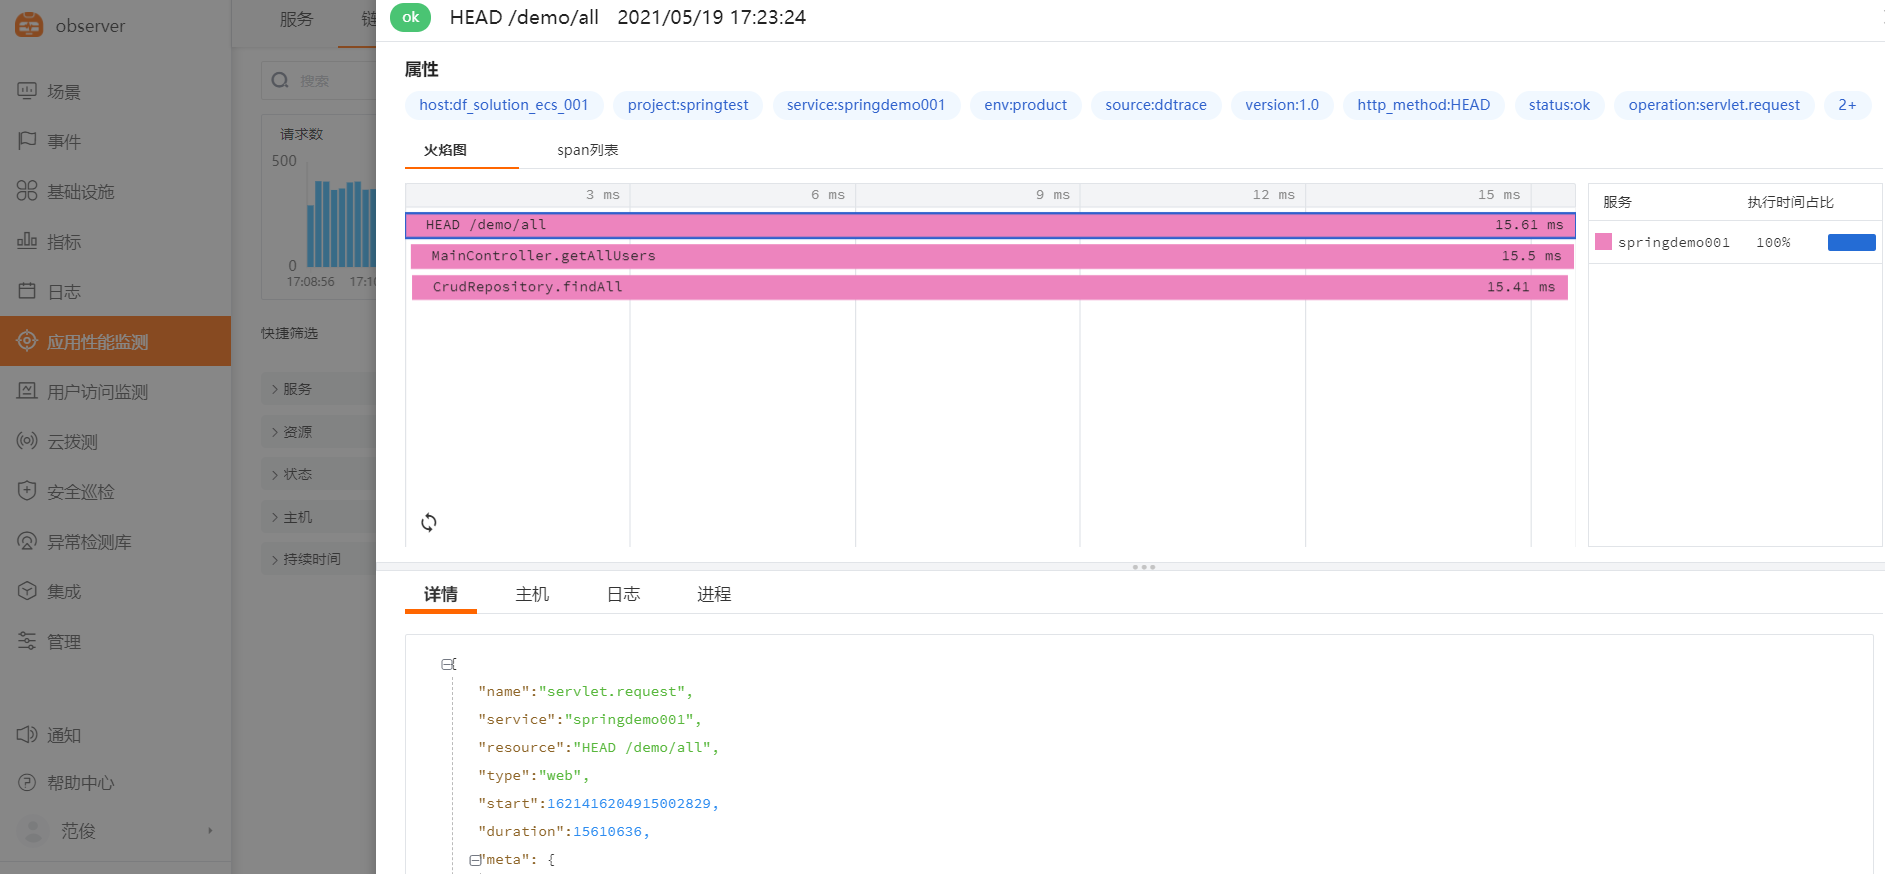
Click the service name to view the flame graph and detailed information.
Real User Monitoring (RUM)
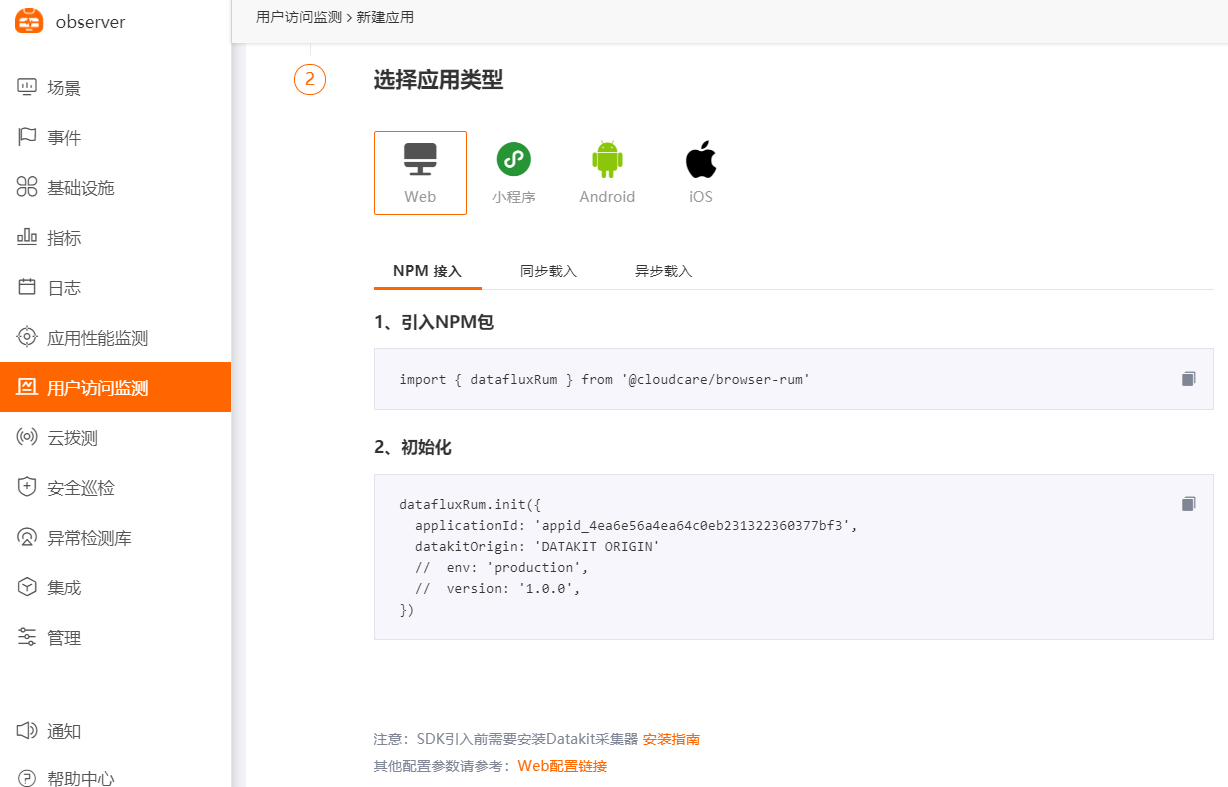
Create an application, select the Web type, copy the probe (code) and place it as the first line inside the HTML <body>.
Cloud Synthetic Monitoring
Create a new synthetic test URL, test points, and frequency.

Anomaly Detection Library
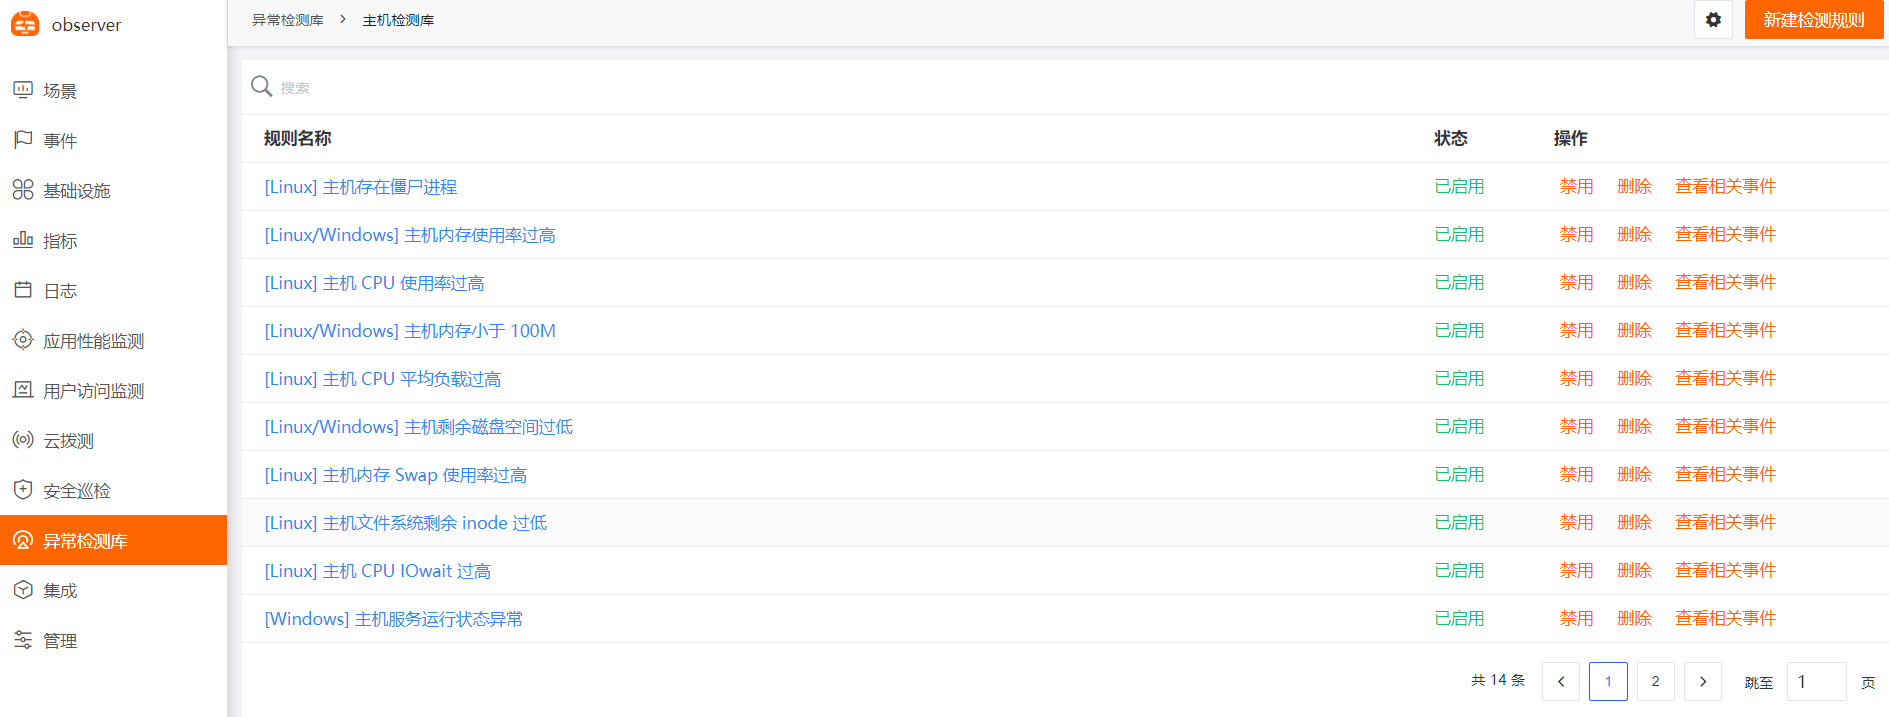
Built-in host detection library (no configuration needed). Add other detection libraries as needed by the actual application.
Pricing
Pay-as-you-go Basic Pricing Model
Guance offers two pricing models, switchable from the Billing Center. One is based on the number of "DataKit + Time Series", the other is based solely on the number of "Time Series". Other billing items (backup log data volume, API test count, task trigger count, SMS count) are universal.
1. Based on "DataKit + Time Series" Count
| Billing Item | Unit | Commercial Plan Unit Price |
|---|---|---|
| DataKit count | Per 1 | 3 CNY |
| Time Series count | Per 500 | 3 CNY |
| Backup log data volume | Per 10 million | 2 CNY |
| API test count | Per 10,000 | 1 CNY Note: Data from self-hosted nodes is not included. |
| Task trigger count | Per 10,000 | 1 CNY |
Time Series calculation formula:
-
Billed Time Series count = Time Series count - DataKit count * 500
-
Billed Time Series bill = (Time Series count - DataKit count * 500) / 500 * 3
-
If the calculated Billed Time Series count <= 0, it is counted as 0.
2. Based on "Time Series" Count
| Billing Item | Unit | Commercial Plan Unit Price |
|---|---|---|
| Time Series count | Per 300 | 3 CNY |
| Backup log data volume | Per 10 million | 2 CNY |
| API test count | Per 10,000 | 1 CNY Note: Data from self-hosted nodes is not included. |
| Task trigger count | Per 10,000 | 1 CNY |
| SMS count | Per 10 | 1 CNY |
Time Series calculation formula:
-
Billed Time Series count = Time Series count
-
Billed Time Series bill = Time Series count / 300 * 3
Tiered Pricing Model
Log Data
| Billing Item | Unit | Commercial Plan Tiered Price | ||
|---|---|---|---|---|
| Data Storage Policy | 14 days | 30 days | 60 days | |
| Log data volume | Per 1 million | 1.5 CNY | 2 CNY | 2.5 CNY |
APM Trace
| Billing Item | Unit | Commercial Plan Tiered Price | |
|---|---|---|---|
| Data Storage Policy | 7 days | 14 days | |
| APM Trace count | Per 1 million | 3 CNY | 6 CNY |
RUM PV
| Billing Item | Unit | Commercial Plan Tiered Price | |
|---|---|---|---|
| Data Storage Policy | 7 days | 14 days | |
| RUM PV count | Per 10,000 | 1 CNY | 2 CNY |
Annual Subscription Packages
Startup Accelerator Package
| Billing Item | Capacity | Pay-as-you-go Price (372 days) | Package Price |
|---|---|---|---|
| DataKit | 20 | CNY 72,168 | CNY 42,000 |
| Log data | 40 million | ||
| APM Trace | 5 million | ||
| RUM PV | 400,000 | ||
| Task triggers | 190,000 |
Growth Package
| Billing Item | Capacity | Pay-as-you-go Price (372 days) | Package Price |
|---|---|---|---|
| DataKit | 100 | CNY 517,080 | CNY 280,000 |
| Log data | 400 million | ||
| APM Trace | 50 million | ||
| RUM PV | 2 million | ||
| Task triggers | 1.4 million |
Enterprise Standard Package
| Billing Item | Capacity | Pay-as-you-go Price (372 days) | Package Price |
|---|---|---|---|
| DataKit | 200 | CNY 1,019,280 | CNY 510,000 |
| Log data | 800 million | ||
| APM Trace | 100 million | ||
| RUM PV | 4 million | ||
| Task triggers | 2.4 million |
Traffic Packages
Traffic packages offer different discounts based on the purchased capacity. For details, contact your account manager.
| Traffic Package | Base Unit | Base Capacity Purchase | Default Data Storage Policy | Unit Price | Price (per day) |
|---|---|---|---|---|---|
| DataKit | 1 | 20 | / | 3 | 60 |
| Log data (10,000s) | 1 million | 1 million | 14 days | 1.5 | 1.5 |
| Backup log (10,000s) | 10 million | 10 million | / | 2 | 2 |
| APM Trace (10,000s) | 1 million | 1 million | 7 days | 3 | 3 |
| RUM PV (10,000s) | 10,000 | 100,000 | 7 days | 1 | 10 |
| API calls (10,000s) | 10,000 | 100,000 | / | 1 | 10 |
| Task triggers (10,000s) | 10,000 | 300,000 | / | 1 | 30 |
| SMS | 1 | 100 | / | 0.1 | 10 |
Important Notes
- Once the capacity of a package is exceeded, the overage can be covered by purchasing traffic packages or billed based on pay-as-you-go using the default data storage policy unit price.
- Packages use the default data storage policy for tiered billing items: log data (14 days), APM Trace (7 days), RUM PV (7 days).
- If the data storage policy for tiered billing items is not the default policy (i.e., log data at 30 or 60 days, APM Trace at 14 days, RUM PV at 14 days), then when Guance billing platform generates the invoice, the usage reported by the workspace and the data storage policy will be converted accordingly. The conversion rules are as follows:
- Log data conversion factor: default 14 days, 30 days usage * 2, 60 days usage * 3
- APM Trace conversion factor: default 7 days, 14 days usage * 2
- RUM PV conversion factor: default 7 days, 14 days usage * 2
Time Series calculation formula:
- Billed Time Series count = Time Series count - DataKit count * 500
- Billed Time Series bill = (Time Series count - DataKit count * 500) / 500 * 3
- If the calculated Billed Time Series count <= 0, it is counted as 0.