Best Practices for Host Observability (Linux)
Overview
Linux, formally GNU/Linux, is a free and freely redistributable Unix-like operating system. As the most widely used operating system in enterprises, its stability is paramount. Leveraging years of customer experience, Guance has achieved comprehensive host observability, helping customers quickly gain insights into infrastructure operations and significantly reduce operational costs.
Use Case Overview
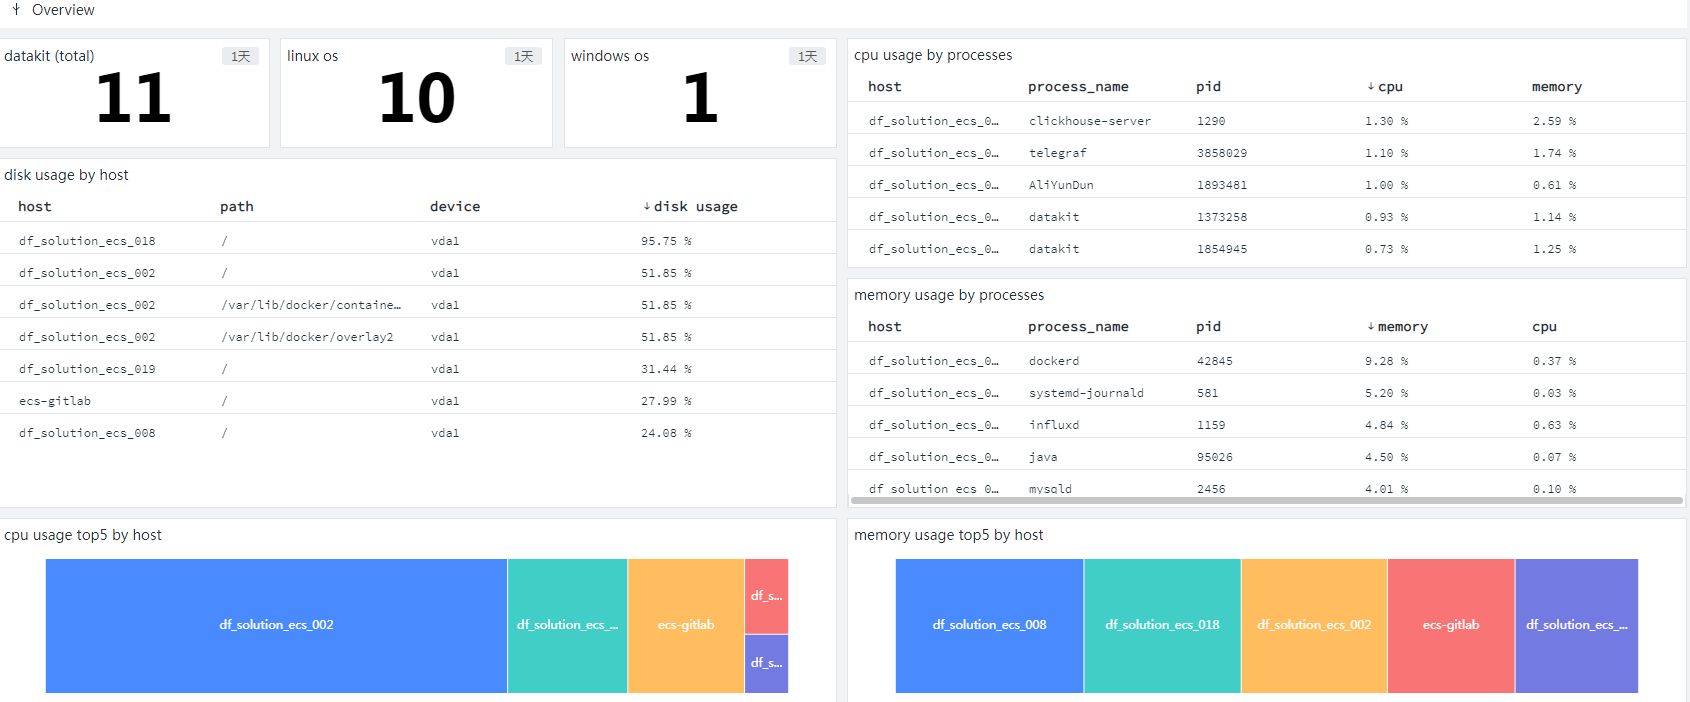
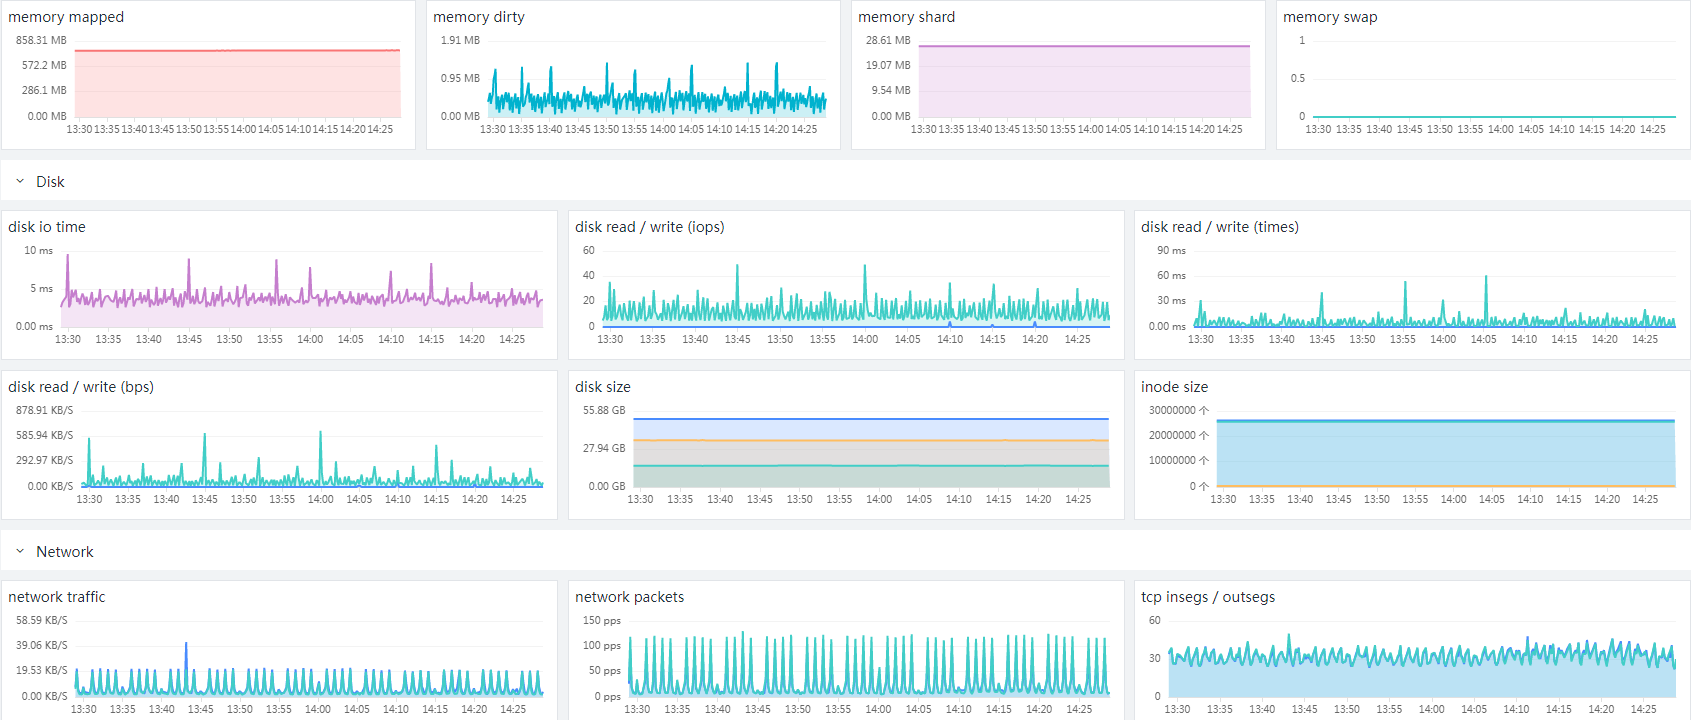
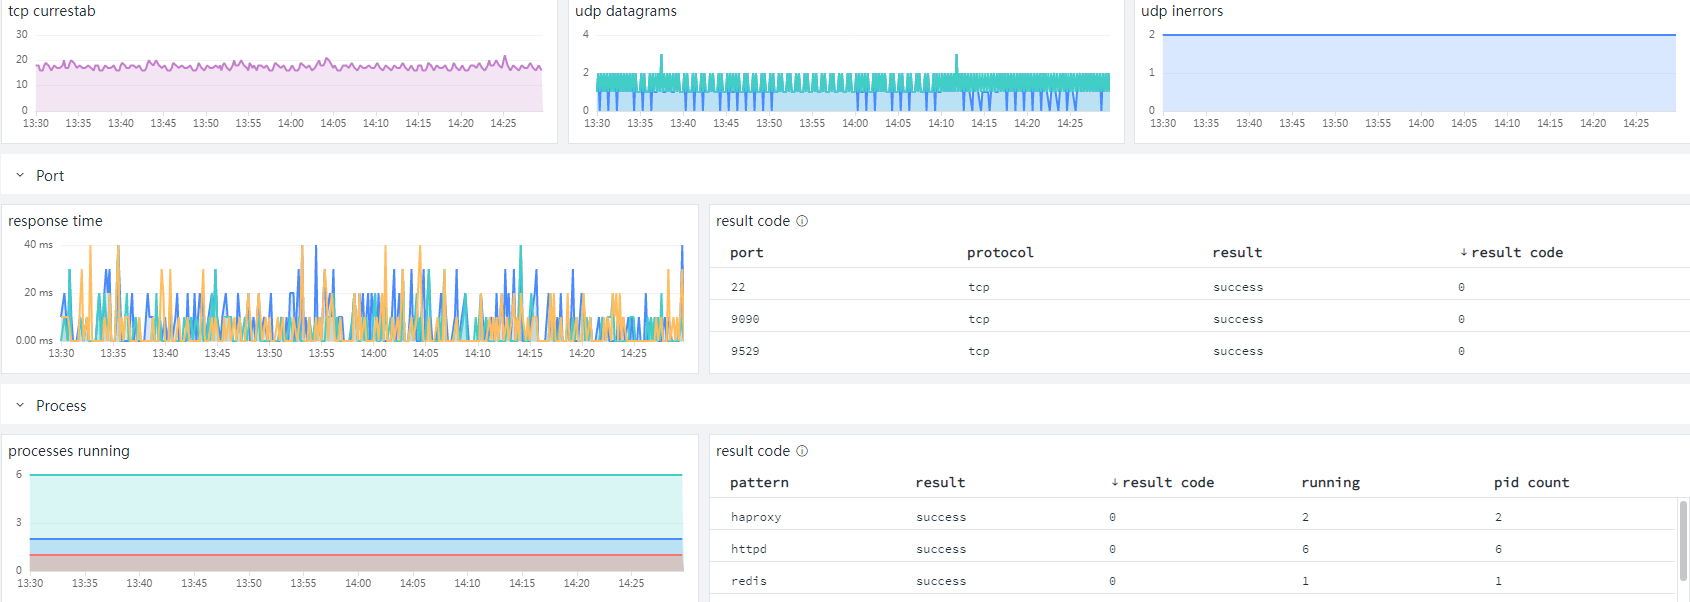
< Guance - Use Cases - Dashboard - Create Dashboard - Host Overview_Linux >


Prerequisites
Go to the official website Guance to register an account, then log in with your registered credentials.
Deployment
One-Click Installation
DataKit is the official data collection agent released by Guance, supporting the collection of hundreds of data types.
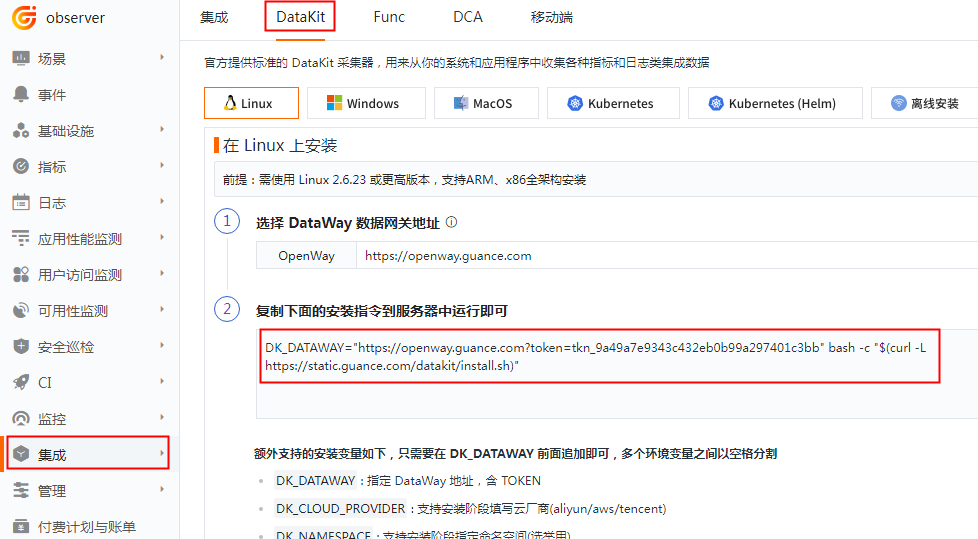
Log in to the Guance console, click Integrations > DataKit, copy the command line, and run it directly on the server.
Default Paths
| Directory | Path |
|---|---|
| Installation Directory | /usr/local/datakit/ |
| Log Directory | /var/log/datakit/ |
| Main Configuration File | /usr/local/datakit/conf.d/datakit.conf |
| Plugin Configuration Directory | /usr/local/datakit/conf.d/ |
Default Plugins
After installation, some plugins (data collection) are enabled by default. You can verify them in the main configuration file datakit.conf.
default_enabled_inputs = ["cpu", "disk", "diskio", "mem", "swap", "hostobject", "net", "host_processes", "container", "system"]
Plugin Description:
Metric data can be viewed in [ Guance - Metrics ], and object data can be viewed directly on the relevant pages.
| Plugin Name | Description | Data Type |
|---|---|---|
| cpu | Collects CPU usage of the host | Metric |
| disk | Collects disk usage | Metric |
| diskio | Collects disk I/O of the host | Metric |
| mem | Collects memory usage of the host | Metric |
| swap | Collects swap memory usage | Metric |
| system | Collects host system load | Metric |
| net | Collects network traffic of the host | Metric |
| host_processes | Collects list of resident processes (alive >10 min) on the host | Object |
| hostobject | Collects basic host information (e.g., OS info, hardware info) | Object |
Data Collection
When viewing metrics in Guance, you can use tags to quickly filter conditions.
Default Collection
CPU Metrics
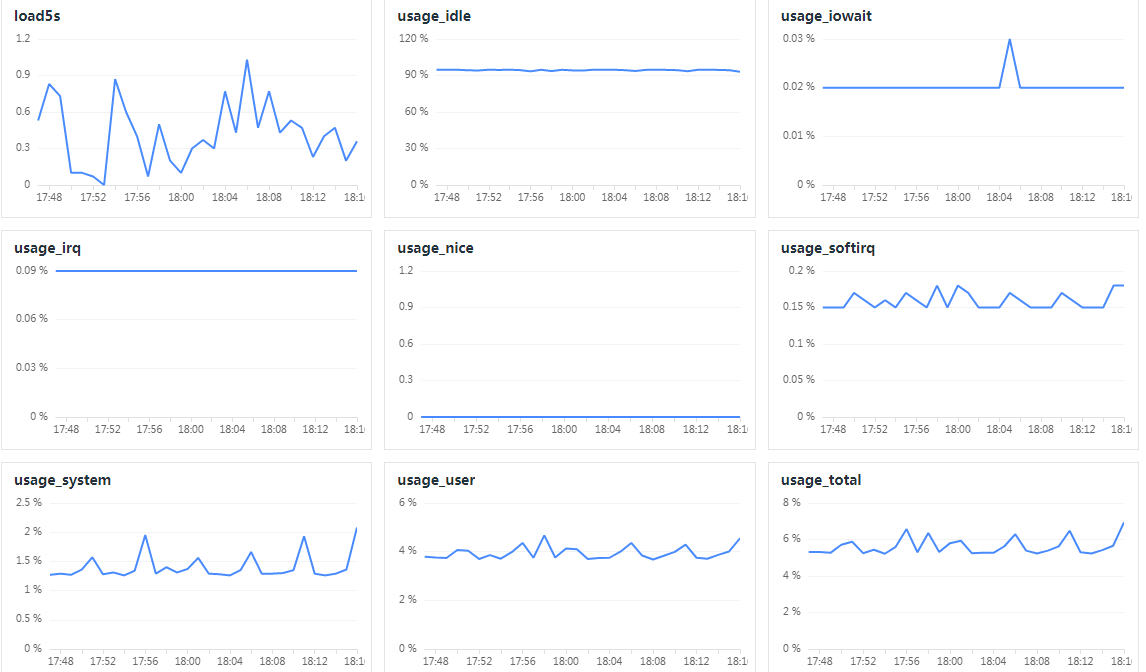
[ Guance - Metrics - cpu, view CPU status data ] [ Guance - Metrics - systecm, view CPU load and core count data ]
Memory Metrics
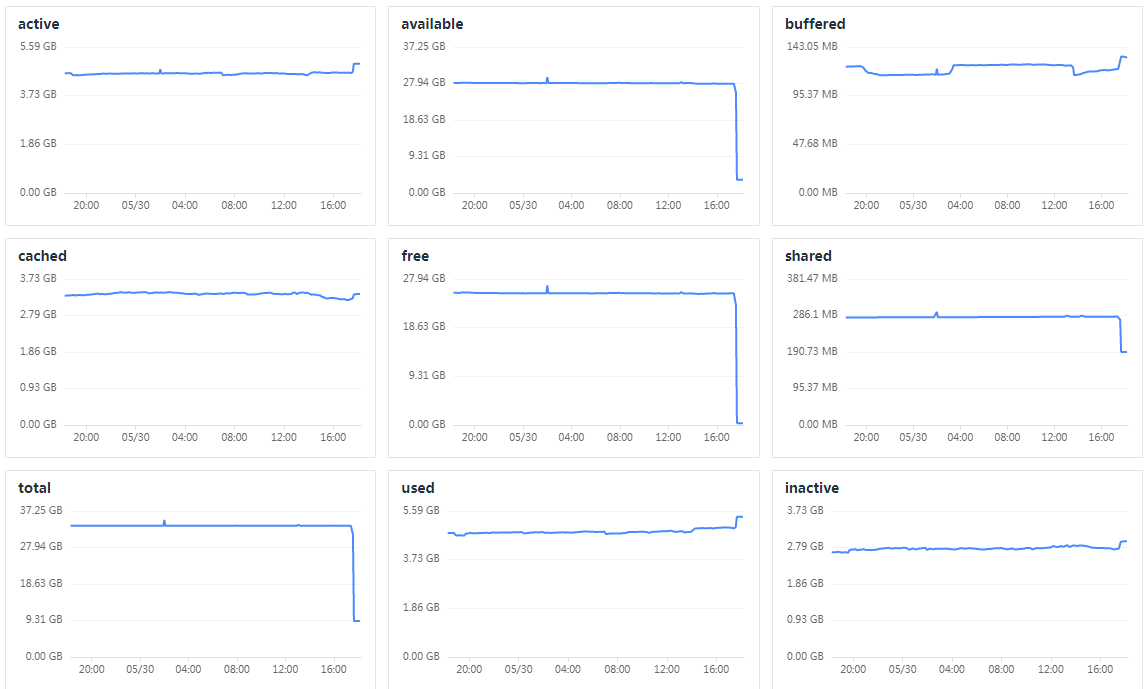
[ Guance - Metrics - mem, view memory data ] [ Guance - Metrics - swap, view swap data ]
Disk Metrics
[ Guance - Metrics - disk, view disk data ] [ Guance - Metrics - disk, view disk I/O data ]
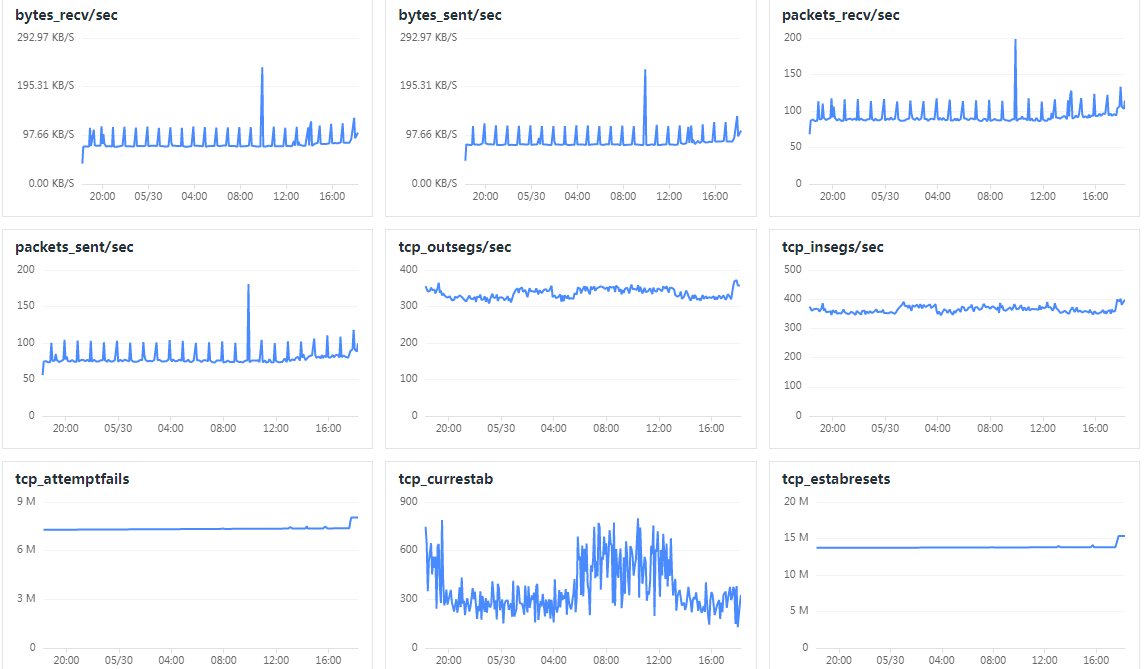
Network Metrics
[ Guance - Metrics - net, view network data ]
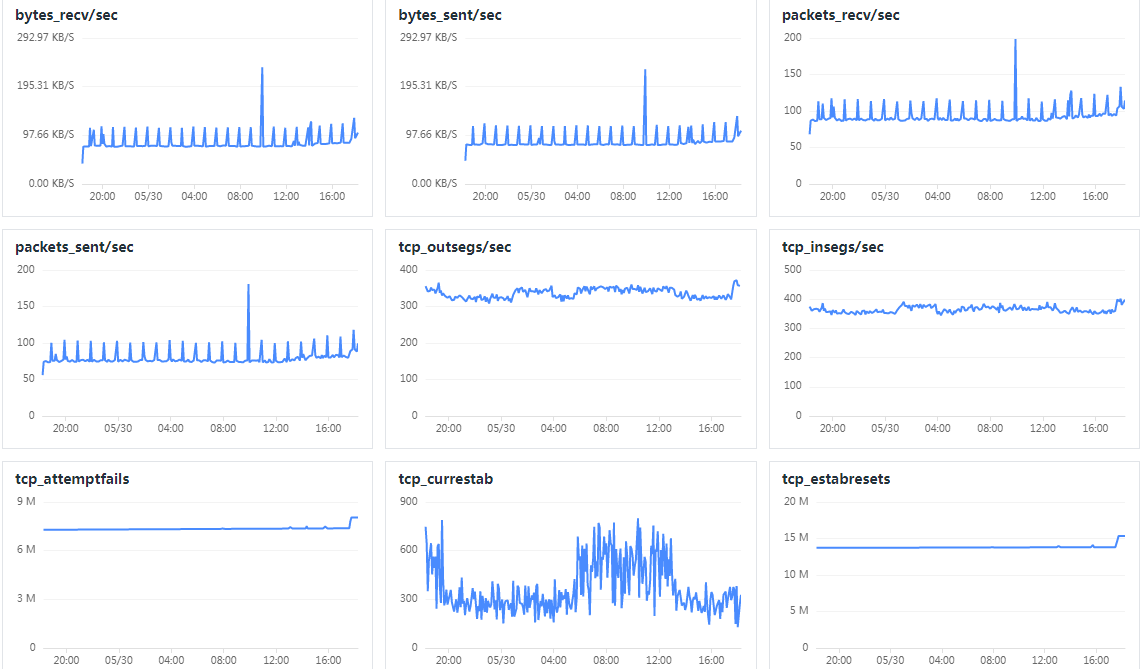
Host Objects
[ Guance - Infrastructure - Host, view list of all hosts ]
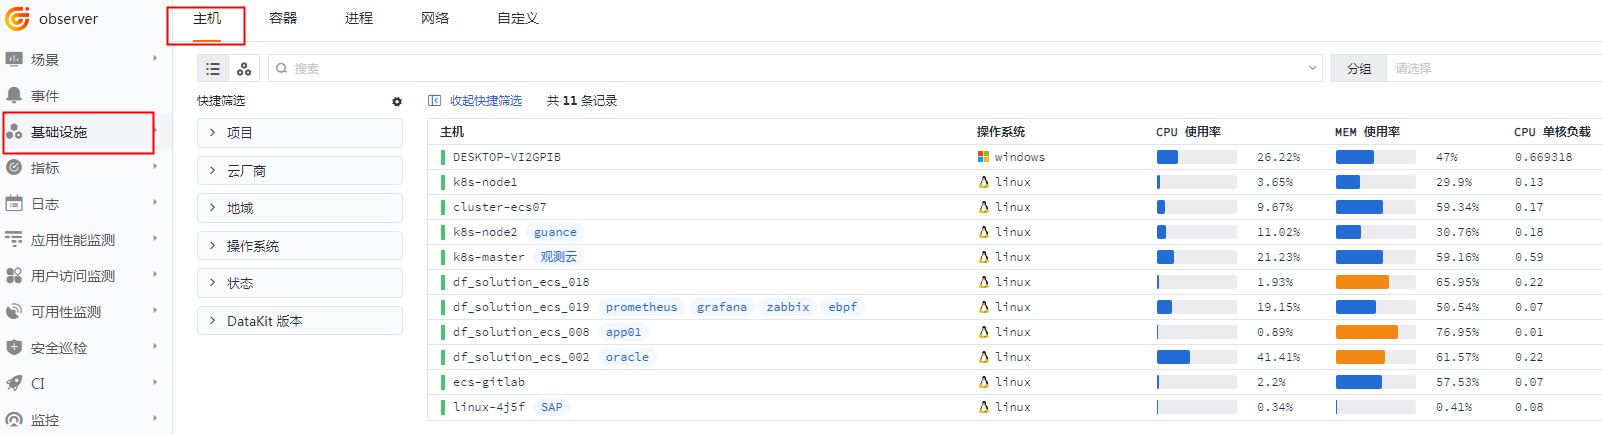
[ Guance - Infrastructure - Host - click any host to view basic system information ]
The integration status represents the list of plugins already running on this server.

Process Objects
[ Guance - Infrastructure - Process, view list of all process objects ]
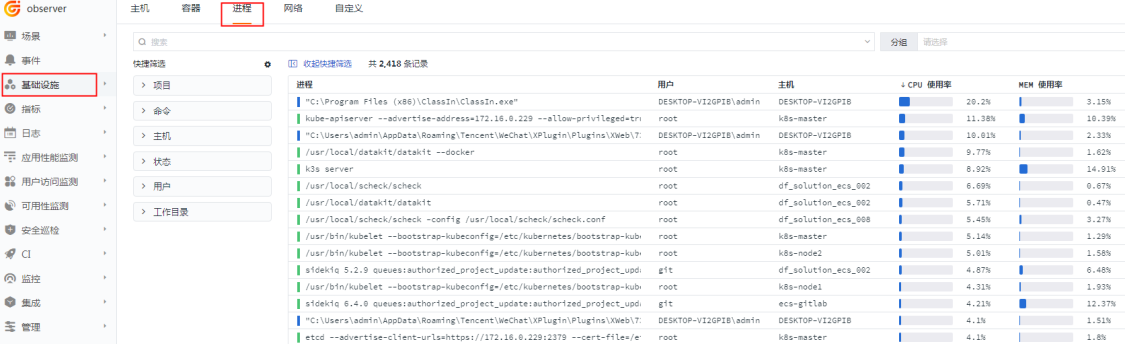
[ Guance - Infrastructure - Process - click any process name to view its related information ]

Advanced Collection
In addition to the default metrics/object data, DataKit can also use other plugins to enhance OS monitoring data.
Process List
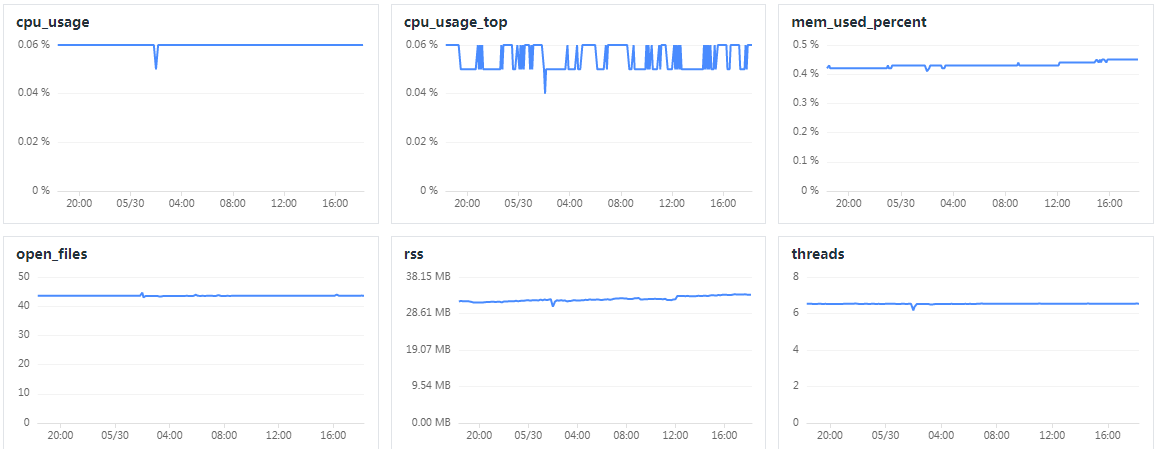
To view the real-time process list of all hosts, enable the process plugin (global top function).
- Navigate to the plugin configuration directory and copy the sample file:
cd /usr/local/datakit/conf.d/host/
cp host_processes.conf.sample host_processes.conf
vi host_processes.conf
- Enable the process plugin:
- Restart DataKit:
[ Guance - Metrics - host_processes, view process data ]
Network Interface Metrics
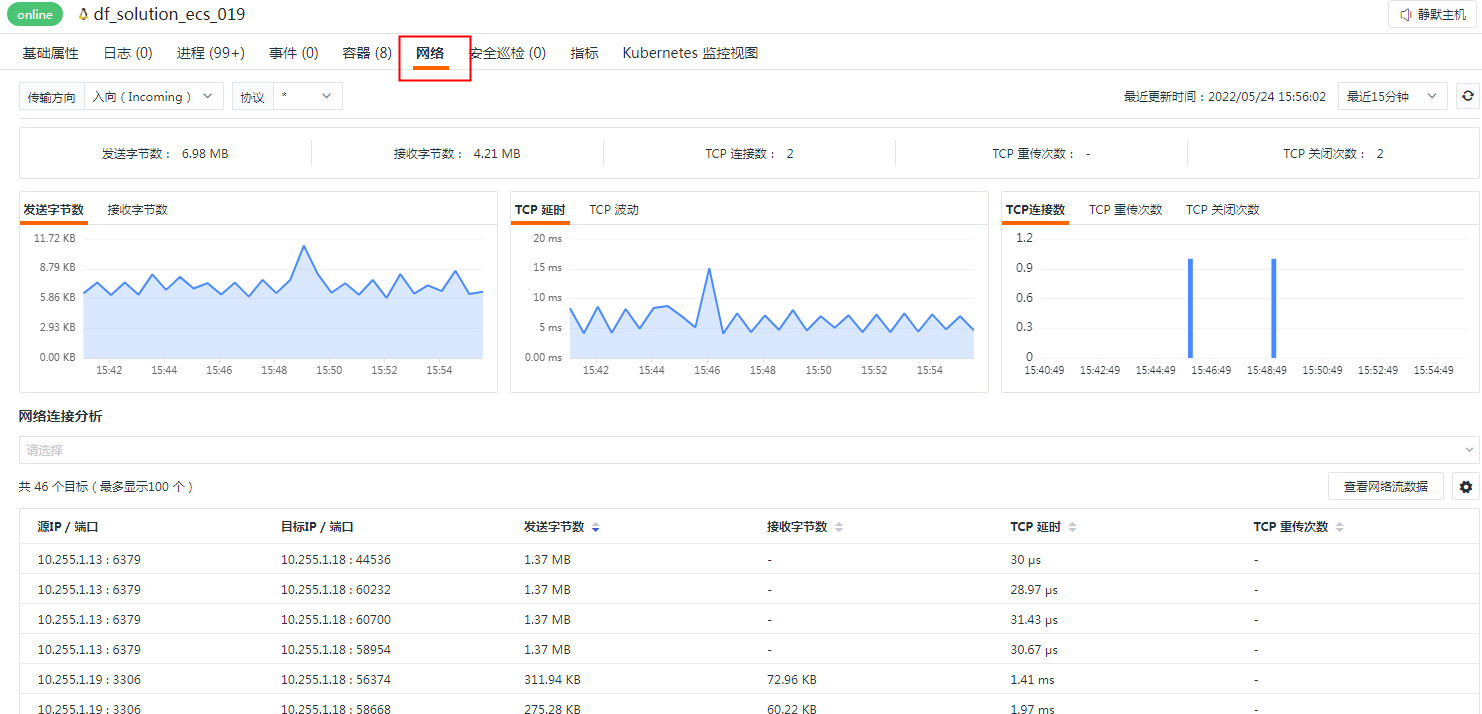
Use eBPF technology to collect TCP/UDP connection information on host network interfaces.
- Install the eBPF plugin:
- Navigate to the plugin configuration directory and copy the sample file:
- Enable the eBPF plugin:
[[inputs.ebpf]]
  daemon = true
  name = 'ebpf'
  cmd = "/usr/local/datakit/externals/datakit-ebpf"
  args = ["--datakit-apiserver", "0.0.0.0:9529"]
  enabled_plugins = ["ebpf-net"]
- Restart DataKit:
[ Guance - Infrastructure - Host - click the host with eBPF plugin installed - Network, view system network interface information ]
Security Check
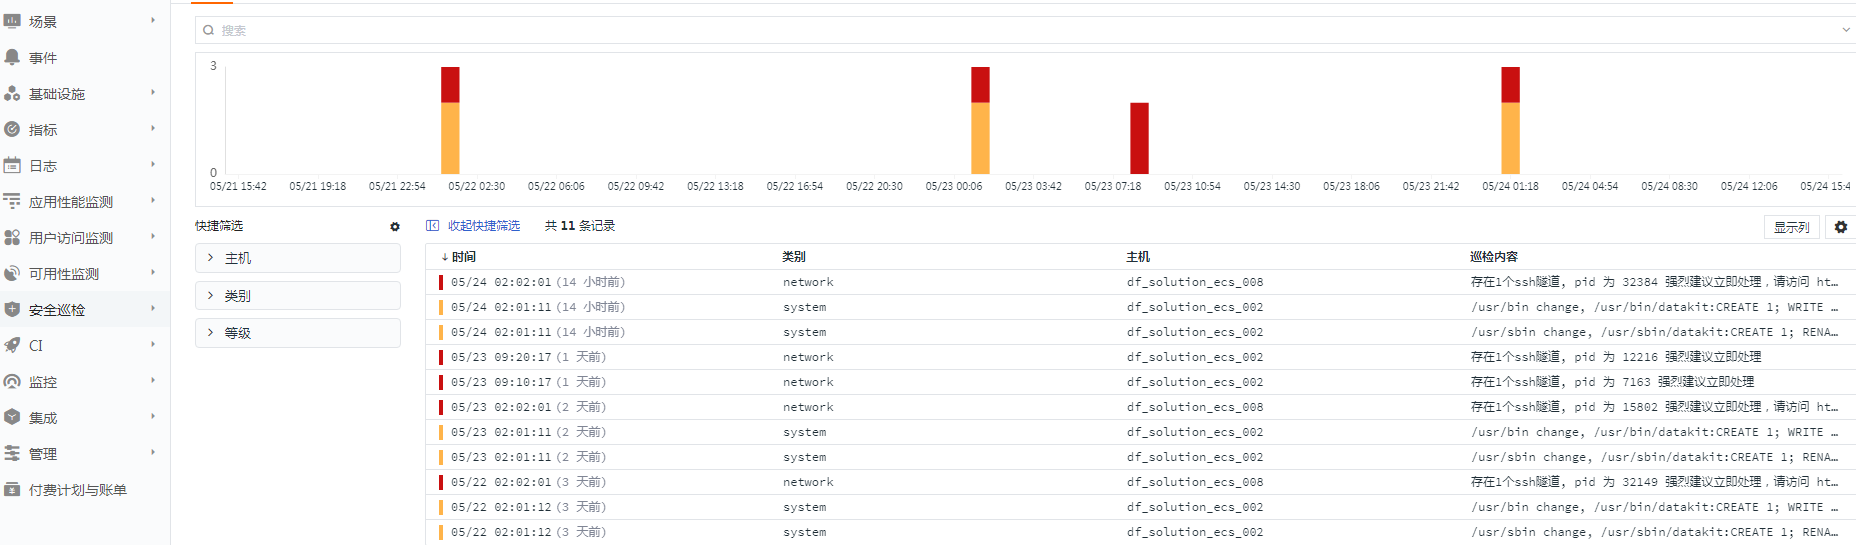
Real-time detection of security vulnerabilities on the host OS.
- Install the Scheck service:
Installation details:
| Directory | Path |
|---|---|
| Installation Directory | /usr/local/scheck |
| Log Directory | /usr/local/scheck/log |
| Main Configuration File | /usr/local/scheck/scheck.conf |
| Detection Rules Directory | /usr/local/scheck/rules.d |
- Modify the main configuration file:
rule_dir='/usr/local/scheck/rules.d'
output='http://127.0.0.1:9529/v1/write/security'
log='/usr/local/scheck/log'
log_level='info'
- Start the service:
[ Guance - Security Check - Explorer, view all security events ]
Extended Collection
In addition to its own data collection, DataKit is fully compatible with the Telegraf collector.
Install Telegraf (using CentOS as an example; for other systems, refer to the Telegraf official documentation).
- Add the yum repository:
cat <<EOF | tee /etc/yum.repos.d/influxdb.repo
[influxdb]
name = InfluxDB Repository - RHEL \$releasever
baseurl = https://repos.influxdata.com/rhel/\$releasever/\$basearch/stable
enabled = 1
gpgcheck = 1
gpgkey = https://repos.influxdata.com/influxdb.key
EOF
- Install the Telegraf collector:
- Modify the main configuration file telegraf.conf:
- Disable the InfluxDB output and enable outputs.http (to send data to DataKit):
- Disable default Telegraf inputs:
#[[inputs.cpu]]
#  percpu = true
#  totalcpu = true
#  collect_cpu_time = false
#  report_active = false
#[[inputs.disk]]
#  ignore_fs = ["tmpfs", "devtmpfs", "devfs", "iso9660", "overlay", "aufs", "squashfs"]
#[[inputs.diskio]]
#[[inputs.mem]]
#[[inputs.processes]]
#[[inputs.swap]]
#[[inputs.system]]
- Start Telegraf:
Port Metrics
Monitor important ports on the OS.
- Modify the main configuration file telegraf.conf:
- Enable port monitoring:
[[inputs.net_response]]
  protocol = "tcp"
  address = "localhost:9090"
  timeout = "3s"
[[inputs.net_response]]
  protocol = "tcp"
  address = "localhost:22"
  timeout = "3s"
- Restart Telegraf:
[ Guance - Metrics - net_response, view port data ]

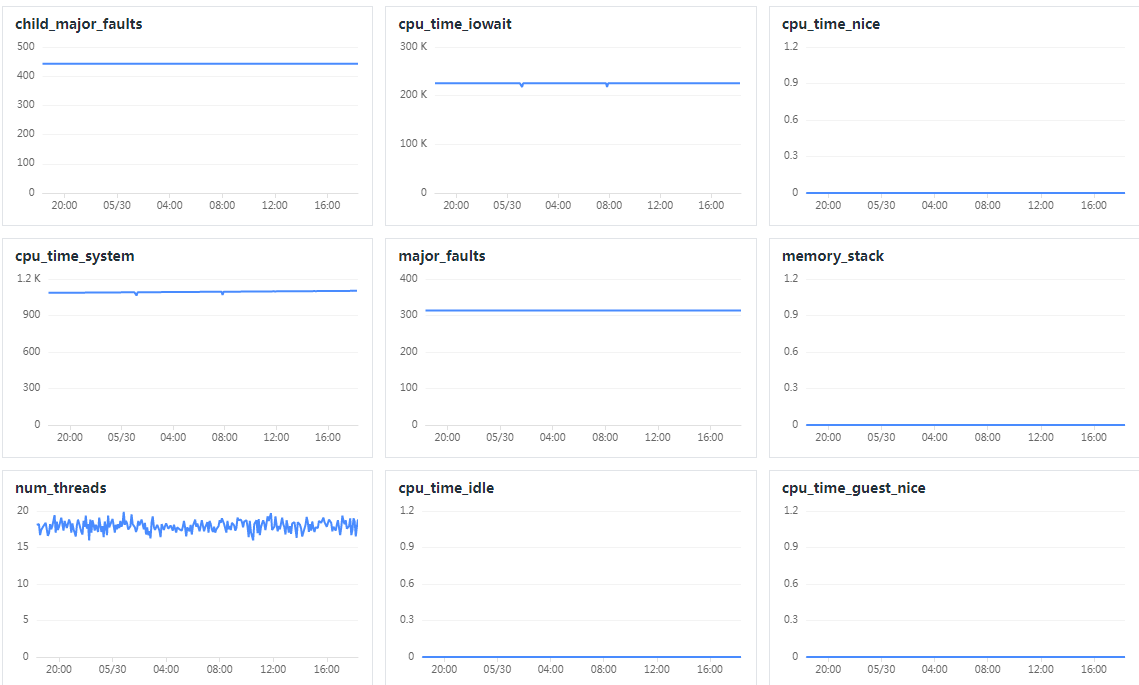
Process Metrics
Monitor important processes on the OS.
- Modify the main configuration file telegraf.conf:
- Enable process monitoring:
- Restart Telegraf:
[ Guance - Metrics - procstat, view process data ]
Single-Node Synthetic Test
Use the local machine as a synthetic test point to monitor important endpoints/sites.
For multi-point tests, see Synthetic Monitoring.
- Modify the main configuration file telegraf.conf:
- Enable HTTP monitoring:
[[inputs.http_response]]
    urls = ["https://www.baidu.com","https://guance.com","http://localhost:9090"]
- Restart Telegraf:
[ Guance - Metrics - http_response, view synthetic test data ]

Monitoring Rules
Used to configure alert rules and notification targets, providing real-time understanding of system stability.
Built-in Templates
Guance includes built-in detection library templates that can be used directly.
[ Guance - Monitoring - Create from Template - Host Detection Library] [ Guance - Monitoring - Create from Template - Ping Status Detection Library] [ Guance - Monitoring - Create from Template - Port Detection Library]
Custom Detection Library
Add detection rules by customizing. Guance supports multiple detection types, such as threshold, process, log, and network detection.
Threshold Detection
[ Guance - Monitoring - Create Monitor - Threshold Detection ]
Detection metric: alert rule expression, where

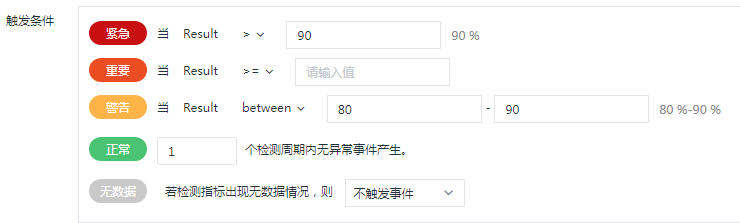
Trigger condition: the final threshold range. When the condition is met, an alert is triggered. After triggering, if the next check does not meet the threshold, the alert can be recovered (fill in the detection period in the "Normal" section).
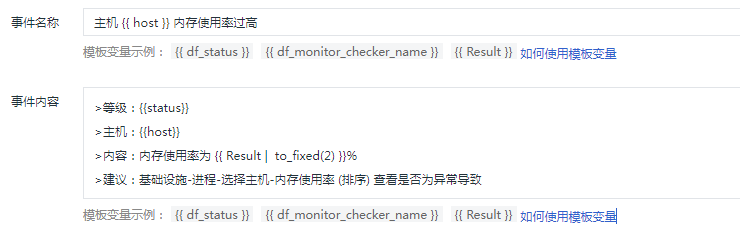
Event names/contents can reference variables. Event content uses Markdown format (e.g., two spaces for line break).
Notification Targets
Customize alert rule notification targets.
[ Guance - Management - Notification Targets ]

Group by monitor and add notification targets.
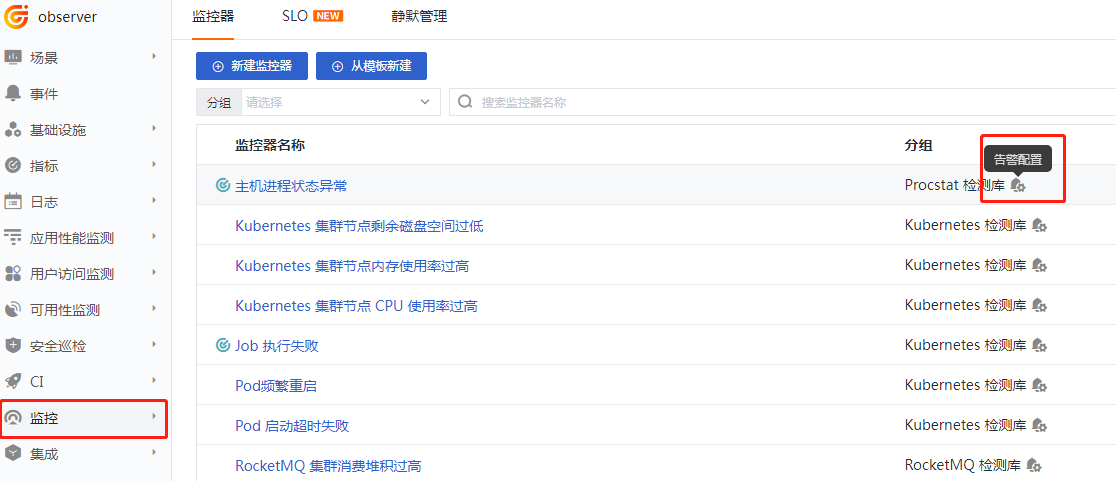
[ Guance - Monitoring - Monitor - Groups - Alert Configuration ]