JVM Observability Best Practices
Prerequisites
Go to the official website Guance to register an account, and log in with your registered account/password.
Install DataKit
Get the Command
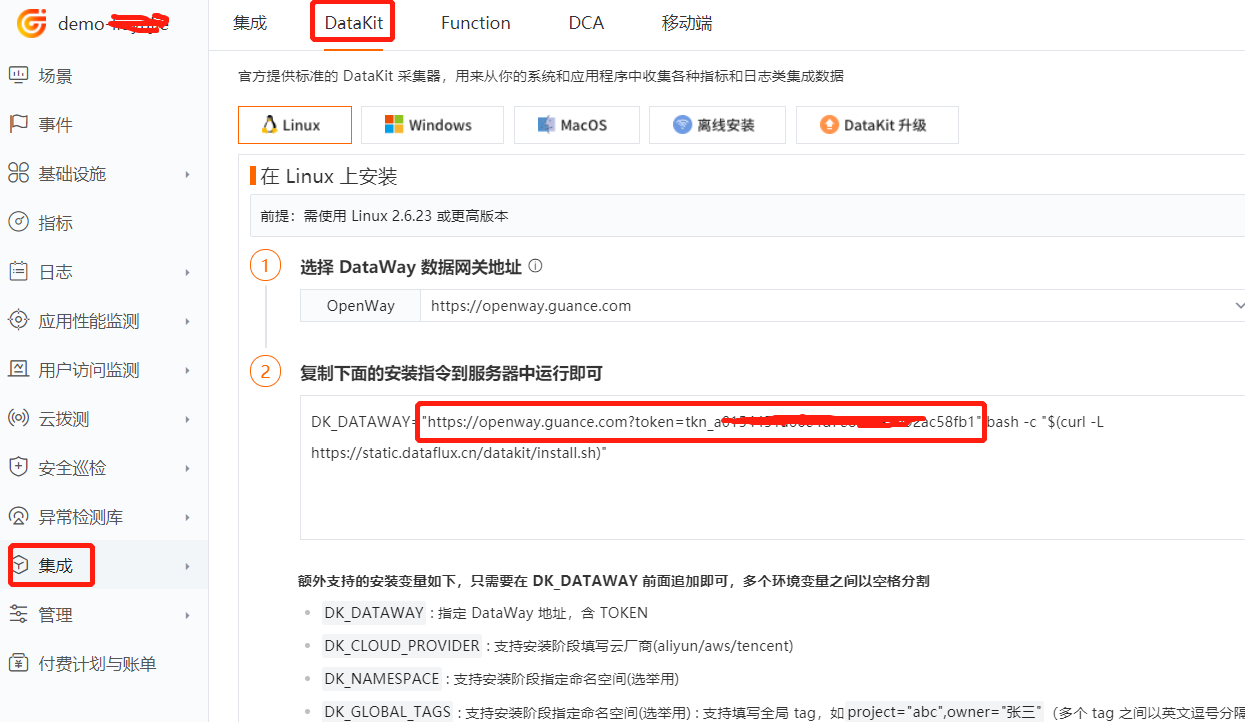
Click on the Integrations module, then DataKit, and select the appropriate installation command based on your operating system and system type.

Execute the Installation
Copy the DataKit installation command and run it directly on the server to be monitored.
- Installation directory:
/usr/local/datakit/ - Log directory:
/var/log/datakit/ - Main configuration file:
/usr/local/datakit/conf.d/datakit.conf - Plugin configuration directory:
/usr/local/datakit/conf.d/
DataKit Has the Following Plugins Installed by Default
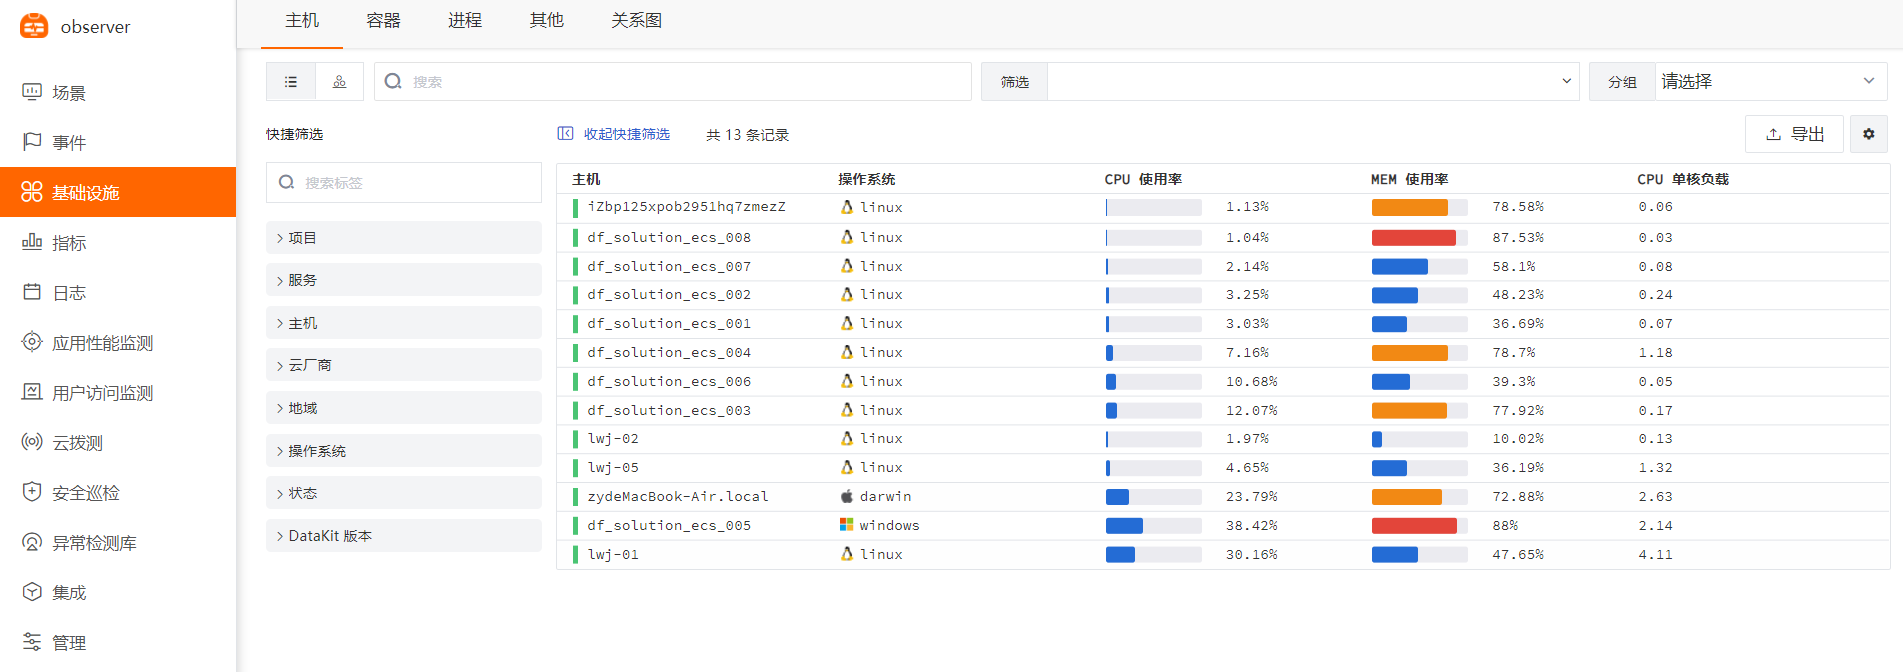
After DataKit is installed, the commonly used Linux host plugins are enabled by default. You can view them in Workspace > Infrastructure by accessing the basic information of the host.
| Collector Name | Description |
|---|---|
| cpu | Collects CPU usage of the host |
| disk | Collects disk usage |
| diskio | Collects disk I/O of the host |
| mem | Collects memory usage of the host |
| swap | Collects swap memory usage |
| system | Collects host operating system load |
| net | Collects host network traffic |
| host_process | Collects the list of persistent processes (alive for more than 10 minutes) on the host |
| hostobject | Collects basic host information (e.g., OS info, hardware info) |
| docker | Collects container objects and container logs on the host |
Built-in Views
Click on the Infrastructure module to view the list of all hosts with DataKit installed and their basic information, such as hostname, CPU, memory, etc.
JVM Collection Configuration:
JAVA_OPTS Declaration
This example uses ddtrace to collect JVM metrics from Java applications. First, define the JAVA_OPTS according to your requirements, and replace JAVA_OPTS when starting the application. The jar startup method is as follows:
The complete JAVA_OPTS is as follows:
-javaagent:/usr/local/datakit/data/dd-java-agent.jar \
 -XX:FlightRecorderOptions=stackdepth=256 \
 -Ddd.profiling.enabled=true  \
 -Ddd.logs.injection=true   \
 -Ddd.trace.sample.rate=1   \
 -Ddd.service.name=your-app-name   \
 -Ddd.env=dev  \
 -Ddd.agent.port=9529   \
 -Ddd.jmxfetch.enabled=true   \
 -Ddd.jmxfetch.check-period=1000   \
 -Ddd.jmxfetch.statsd.port=8125   \
 -Ddd.trace.health.metrics.enabled=true   \
 -Ddd.trace.health.metrics.statsd.port=8125   \
Detailed description:
-Ddd.env:Application environment type, optional
-Ddd.tags:Custom tags, optional
-Ddd.service.name: Application name for JVM data source, required
-Ddd.agent.host=localhost    DataKit address, optional
-Ddd.agent.port=9529         DataKit port, required
-Ddd.version: Version, optional
-Ddd.jmxfetch.check-period: Collection interval in milliseconds, default 1500, optional
-Ddd.jmxfetch.statsd.host=127.0.0.1: Connection address for the statsd collector, same as DataKit address, optional
-Ddd.jmxfetch.statsd.port=8125: UDP connection port for the statsd collector on DataKit, default 8125, optional
-Ddd.trace.health.metrics.statsd.host=127.0.0.1: Address for sending health metrics data, same as DataKit address, optional
-Ddd.trace.health.metrics.statsd.port=8125: Port for sending health metrics data, optional
-Ddd.service.mapping: Aliases for Redis, MySQL, etc. called by the application, optional
1. Jar Usage
Enable statsd
Enable ddtrace
Restart DataKit
Start the jar. Replace your-app with your application name. If the application does not connect to MySQL, remove -Ddd.service.mapping=mysql:mysql01, where mysql01 is the alias of MySQL seen in the DataFlux APM view.
nohup java -Dfile.encoding=utf-8  \
 -javaagent:/usr/local/datakit/data/dd-java-agent.jar \
 -Ddd.service.name=your-app   \
 -Ddd.service.mapping=mysql:mysql01   \
 -Ddd.env=dev  \
 -Ddd.agent.port=9529   \
 -jar your-app.jar > logs/your-app.log  2>&1 &
2. Docker Usage
Enable statsd and ddtrace as in the jar usage.
Open the external access port
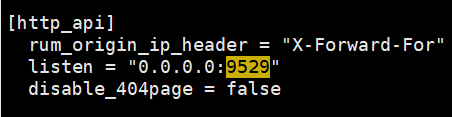
Edit the /usr/local/datakit/conf.d/datakit.conf file, modify listen = "0.0.0.0:9529"
Restart DataKit
In your Dockerfile, use the environment variable JAVA_OPTS in the ENTRYPOINT startup parameters. Example Dockerfile:
FROM openjdk:8u292-jdk

ENV jar your-app.jar
ENV workdir /data/app/
RUN mkdir -p ${workdir}
COPY ${jar} ${workdir}
WORKDIR ${workdir}

ENTRYPOINT ["sh", "-ec", "exec java  ${JAVA_OPTS} -jar ${jar} "]
Build the image
Save the above content to the /usr/local/java/Dockerfile file.
/usr/local/datakit/data/dd-java-agent.jar to the /tmp/work directory.
Docker run startup: Modify 172.16.0.215 to the private IP address of your server, replace 9299 with your application port, replace your-app with your application name, and replace your-app-image:v1 with your image name.
docker run -v /tmp/work:/tmp/work -e JAVA_OPTS="-javaagent:/tmp/work/dd-java-agent.jar -Ddd.service.name=your-app -Ddd.service.mapping=mysql:mysql01 -Ddd.env=dev -Ddd.agent.host=172.16.0.215 -Ddd.agent.port=9529 -Ddd.jmxfetch.statsd.host=172.16.0.215 " --name your-app -d -p 9299:9299 your-app-image:v1
The Dockerfile needs to declare an ARG parameter to receive parameters from docker-compose. Example:
FROM openjdk:8u292-jdk

ARG JAVA_ARG
ENV JAVA_OPTS=$JAVA_ARG
ENV jar your-app.jar
ENV workdir /data/app/
RUN mkdir -p ${workdir}
COPY ${jar} ${workdir}
WORKDIR ${workdir}

ENTRYPOINT ["sh", "-ec", "exec java  ${JAVA_OPTS} -jar ${jar} "]
Save the above content to the /usr/local/java/DockerfileTest file. Create a new docker-compose.yml file in the same directory. Modify 172.16.0.215 to the private IP address of your server, replace 9299 with your application port, replace your-app with your application name, and replace your-app-image:v1 with your image name. Example docker-compose.yml:
version: "3.9"
services:
  ruoyi-gateway:
    image: your-app-image:v1
    container_name: your-app
    volumes:
      - /tmp/work:/tmp/work
    build:
      dockerfile: DockerfileTest
      context: .
      args:
        - JAVA_ARG=-javaagent:/tmp/work/dd-java-agent.jar  -Ddd.service.name=your-app  -Ddd.service.mapping=mysql:mysql01 -Ddd.env=dev  -Ddd.agent.host=172.16.0.215 -Ddd.agent.port=9529  -Ddd.jmxfetch.statsd.host=172.16.0.215
    ports:

    networks:
      - myNet
networks:
  myNet:
    driver: bridge
Start
$ cd /usr/local/java
# Build the image
$ docker build -t your-app-image:v1 .
# Start
$ docker-compose up -d
3. Kubernetes Usage
3.1 Deploy DataKit
Deploy DataKit in Kubernetes using the DaemonSet method. Refer to <Datakit DaemonSet Installation>
To collect JVM metrics, you need to enable the ddtrace and statsd collectors. For DataKit deployed via DaemonSet, add statsd, ddtrace to the ENV_DEFAULT_ENABLED_INPUTS environment variable in the YAML file.
- name: ENV_DEFAULT_ENABLED_INPUTS
  value: cpu,disk,diskio,mem,swap,system,hostobject,net,host_processes,kubernetes,container,statsd,ddtrace
The deployment file for this example is /usr/local/k8s/datakit-default.yaml, with the following content:
apiVersion: v1
kind: Namespace
metadata:
  name: datakit
---
apiVersion: rbac.authorization.k8s.io/v1
kind: ClusterRole
metadata:
  name: datakit
rules:
- apiGroups:
  - rbac.authorization.k8s.io
  resources:
  - clusterroles
  verbs:
  - get
  - list
  - watch
- apiGroups:
  - ""
  resources:
  - nodes
  - nodes/proxy
  - namespaces
  - pods
  - pods/log
  - events
  - services
  - endpoints
  - ingresses
  verbs:
  - get
  - list
  - watch
- apiGroups:
  - apps
  resources:
  - deployments
  - daemonsets
  - statefulsets
  - replicasets
  verbs:
  - get
  - list
  - watch
- apiGroups:
  - batch
  resources:
  - jobs
  - cronjobs
  verbs:
  - get
  - list
  - watch
- apiGroups:
  - metrics.k8s.io
  resources:
  - pods
  - nodes
  verbs:
  - get
  - list
- nonResourceURLs: ["/metrics"]
  verbs: ["get"]

---

apiVersion: v1
kind: ServiceAccount
metadata:
  name: datakit
  namespace: datakit

---

apiVersion: v1
kind: Service
metadata:
  name: datakit-service
  namespace: datakit
spec:
  selector:
    app: daemonset-datakit
  ports:
    - protocol: TCP
      port: 9529
      targetPort: 9529

---

apiVersion: rbac.authorization.k8s.io/v1
kind: ClusterRoleBinding
metadata:
  name: datakit
roleRef:
  apiGroup: rbac.authorization.k8s.io
  kind: ClusterRole
  name: datakit
subjects:
- kind: ServiceAccount
  name: datakit
  namespace: datakit

---

apiVersion: apps/v1
kind: DaemonSet
metadata:
  labels:
    app: daemonset-datakit
  name: datakit
  namespace: datakit
spec:
  revisionHistoryLimit: 10
  selector:
    matchLabels:
      app: daemonset-datakit
  template:
    metadata:
      labels:
        app: daemonset-datakit
    spec:
      hostNetwork: true
      dnsPolicy: ClusterFirstWithHostNet
      containers:
      - env:
        - name: HOST_IP
          valueFrom:
            fieldRef:
              apiVersion: v1
              fieldPath: status.hostIP
        - name: NODE_NAME
          valueFrom:
            fieldRef:
              apiVersion: v1
              fieldPath: spec.nodeName
        - name: ENV_DATAWAY
          value: https://openway.guance.com?token=<your-token>
        - name: ENV_GLOBAL_HOST_TAGS
          value: host=__datakit_hostname,host_ip=__datakit_ip,cluster_name_k8s=k8s-prod
        - name: ENV_DEFAULT_ENABLED_INPUTS
          value: cpu,disk,diskio,mem,swap,system,hostobject,net,host_processes,kubernetes,container,statsd,ddtrace
        - name: ENV_ENABLE_ELECTION
          value: enable
        - name: ENV_HTTP_LISTEN
          value: 0.0.0.0:9529
        - name: ENV_LOG_LEVEL
          value: info
        image: pubrepo.guance.com/datakit/datakit:1.2.1
        imagePullPolicy: IfNotPresent
        name: datakit
        ports:
        - containerPort: 9529
          hostPort: 9529
          name: port
          protocol: TCP
        securityContext:
          privileged: true
        volumeMounts:
        - mountPath: /var/run/docker.sock
          name: docker-socket
          readOnly: true
        - mountPath: /usr/local/datakit/conf.d/container/container.conf
          name: datakit-conf
          subPath: container.conf
        - mountPath: /usr/local/datakit/conf.d/log/logging.conf
          name: datakit-conf
          subPath: logging.conf
        - mountPath: /host/proc
          name: proc
          readOnly: true
        - mountPath: /host/dev
          name: dev
          readOnly: true
        - mountPath: /host/sys
          name: sys
          readOnly: true
        - mountPath: /rootfs
          name: rootfs
        - mountPath: /sys/kernel/debug
          name: debugfs
        workingDir: /usr/local/datakit
      hostIPC: true
      hostPID: true
      restartPolicy: Always
      serviceAccount: datakit
      serviceAccountName: datakit
      volumes:
      - configMap:
          name: datakit-conf
        name: datakit-conf
      - hostPath:
          path: /var/run/docker.sock
        name: docker-socket
      - hostPath:
          path: /proc
          type: ""
        name: proc
      - hostPath:
          path: /dev
          type: ""
        name: dev
      - hostPath:
          path: /sys
          type: ""
        name: sys
      - hostPath:
          path: /
          type: ""
        name: rootfs
      - hostPath:
          path: /sys/kernel/debug
          type: ""
        name: debugfs
  updateStrategy:
    rollingUpdate:
      maxUnavailable: 1
    type: RollingUpdate
---
apiVersion: v1
kind: ConfigMap
metadata:
  name: datakit-conf
  namespace: datakit
data:
    #### container
    container.conf: |-
      [inputs.container]
        docker_endpoint = "unix:///var/run/docker.sock"
        containerd_address = "/var/run/containerd/containerd.sock"

        enable_container_metric = true
        enable_k8s_metric = true
        enable_pod_metric = false
        extract_k8s_label_as_tags = false

        ## Auto-Discovery of PrometheusMonitoring Annotations/CRDs
        enable_auto_discovery_of_prometheus_pod_annotations = false
        enable_auto_discovery_of_prometheus_service_annotations = false
        enable_auto_discovery_of_prometheus_pod_monitors = false
        enable_auto_discovery_of_prometheus_service_monitors = false

        ## Containers logs to include and exclude, default collect all containers. Globs accepted.
        container_include_log = []
        container_exclude_log = ["image:*logfwd*", "image:*datakit*"]

        exclude_pause_container = true

        ## Removes ANSI escape codes from text strings
        logging_remove_ansi_escape_codes = false
        ## Search logging interval, default "60s"
        #logging_search_interval = ""

        ## If the data sent failure, will retry forevery
        logging_blocking_mode = true

        kubernetes_url = "https://kubernetes.default:443"

        ## Authorization level:
        ##   bearer_token -> bearer_token_string -> TLS
        ## Use bearer token for authorization. ('bearer_token' takes priority)
        ## linux at:   /run/secrets/kubernetes.io/serviceaccount/token
        ## windows at: C:\var\run\secrets\kubernetes.io\serviceaccount\token
        bearer_token = "/run/secrets/kubernetes.io/serviceaccount/token"
        # bearer_token_string = "<your-token-string>"

        logging_auto_multiline_detection = true
        logging_auto_multiline_extra_patterns = []

        ## Set true to enable election for k8s metric collection
        election = true

        [inputs.container.logging_extra_source_map]
        # source_regexp = "new_source"

        [inputs.container.logging_source_multiline_map]
        # source = '''^\d{4}'''

        [inputs.container.tags]
          # some_tag = "some_value"
          # more_tag = "some_other_value"


    #### logging
    logging.conf: |-
        [[inputs.logging]]
          ## required
          logfiles = [
            "/rootfs/var/log/k8s/demo-system/info.log",
            "/rootfs/var/log/k8s/demo-system/error.log",
          ]

          ## glob filteer
          ignore = [""]

          ## your logging source, if it's empty, use 'default'
          source = "k8s-demo-system"

          ## add service tag, if it's empty, use $source.
          service = "k8s-demo-system"

          ## grok pipeline script path
          #pipeline = ""

          ## optional status:
          ##   "emerg","alert","critical","error","warning","info","debug","OK"
          ignore_status = []

          ## optional encodings:
          ##    "utf-8", "utf-16le", "utf-16le", "gbk", "gb18030" or ""
          character_encoding = ""

          ## The pattern should be a regexp. Note the use of '''this regexp'''
          ## regexp link: https://golang.org/pkg/regexp/syntax/#hdr-Syntax
          match = '''^\d{4}-\d{2}-\d{2}'''

          [inputs.logging.tags]
          # some_tag = "some_value"
          # more_tag = "some_other_value"
At https://console.guance.com/, find the openway address. Replace the value of ENV_DATAWAY in datakit-default.yaml as shown in the figure below.
Deploy DataKit

If you need to collect system logs in this example, refer to the following content:
#- mountPath: /usr/local/datakit/conf.d/log/demo-system.conf
#  name: datakit-conf
#  subPath: demo-system.conf
    #### kubernetes
    demo-system.conf: |-
        [[inputs.logging]]
          ## required
          logfiles = [
            "/rootfs/var/log/k8s/demo-system/info.log",
            "/rootfs/var/log/k8s/demo-system/error.log",
          ]

          ## glob filteer
          ignore = [""]

          ## your logging source, if it's empty, use 'default'
          source = "k8s-demo-system"

          ## add service tag, if it's empty, use $source.
          service = "k8s-demo-system"

          ## grok pipeline script path
          pipeline = ""

          ## optional status:
          ##   "emerg","alert","critical","error","warning","info","debug","OK"
          ignore_status = []

          ## optional encodings:
          ##    "utf-8", "utf-16le", "utf-16le", "gbk", "gb18030" or ""
          character_encoding = ""

          ## The pattern should be a regexp. Note the use of '''this regexp'''
          ## regexp link: https://golang.org/pkg/regexp/syntax/#hdr-Syntax
          match = '''^\S'''

          [inputs.logging.tags]
          # some_tag = "some_value"
          # more_tag = "some_other_value"
3.2 Sidecar Image
The jar usage method uses dd-java-agent.jar. This jar may not exist in the user's image. To avoid modifying the customer's business image, we need to create an image containing dd-java-agent.jar and then use a sidecar container to start before the business container, providing dd-java-agent.jar via a shared volume.
3.3 Write the Dockerfile for the Java Application
Use the environment variable JAVA_OPTS in the ENTRYPOINT startup parameters of your Dockerfile. Example Dockerfile:
FROM openjdk:8u292

ENV jar your-app.jar
ENV workdir /data/app/
RUN mkdir -p ${workdir}
COPY ${jar} ${workdir}
WORKDIR ${workdir}
ENTRYPOINT ["sh", "-ec", "exec java ${JAVA_OPTS} -jar ${jar}"]
Build the image and push it to the harbor repository. Replace 172.16.0.215:5000/dk with your image repository.
$ cd /usr/local/k8s/agent
$ docker build -t 172.16.0.215:5000/dk/your-app-image:v1 .
$ docker push 172.16.0.215:5000/dk/your-app-image:v1
3.4 Write the Deployment
Create a new file /usr/local/k8s/your-app-deployment-yaml with the following content:
apiVersion: v1
kind: Service
metadata:
  name: your-app-name
  labels:
    app: your-app-name
spec:
  selector:
    app: your-app-name
  ports:
    - protocol: TCP
      port: 9299
      nodePort: 30001
      targetPort: 9299
  type: NodePort
---
apiVersion: apps/v1
kind: Deployment
metadata:
  name: your-app-name
  labels:
    app: your-app-name
spec:
  replicas: 1
  selector:
    matchLabels:
      app: your-app-name
  template:
    metadata:
      labels:
        app: your-app-name
    spec:
      containers:
      - env:
        - name: PODE_NAME
          valueFrom:
            fieldRef:
              fieldPath: metadata.name
        - name: JAVA_OPTS
          value: |-
            -javaagent:/usr/dd-java-agent/agent/dd-java-agent.jar -Ddd.service.name=<your-app-name> -Ddd.tags=container_host:$(PODE_NAME)  -Ddd.env=dev  -Ddd.agent.port=9529
        - name: DD_AGENT_HOST
          valueFrom:
            fieldRef:
              apiVersion: v1
              fieldPath: status.hostIP
        name: your-app-name
        image: 172.16.0.215:5000/dk/your-app-image:v1
        #command: ["sh","-c"]
        ports:
        - containerPort: 9299
          protocol: TCP
        volumeMounts:
        - mountPath: /usr/dd-java-agent/agent
          name: ddagent
      initContainers:
      - command:
        - sh
        - -c
        - set -ex;mkdir -p /ddtrace/agent;cp -r /datadog-init/* /ddtrace/agent;
        image: pubrepo.guance.com/datakit-operator/dd-lib-java-init
        imagePullPolicy: Always
        name: ddtrace-agent-sidecar
        volumeMounts:
        - mountPath: /ddtrace/agent
          name: ddagent
      restartPolicy: Always
      volumes:
      - emptyDir: {}
        name: ddagent
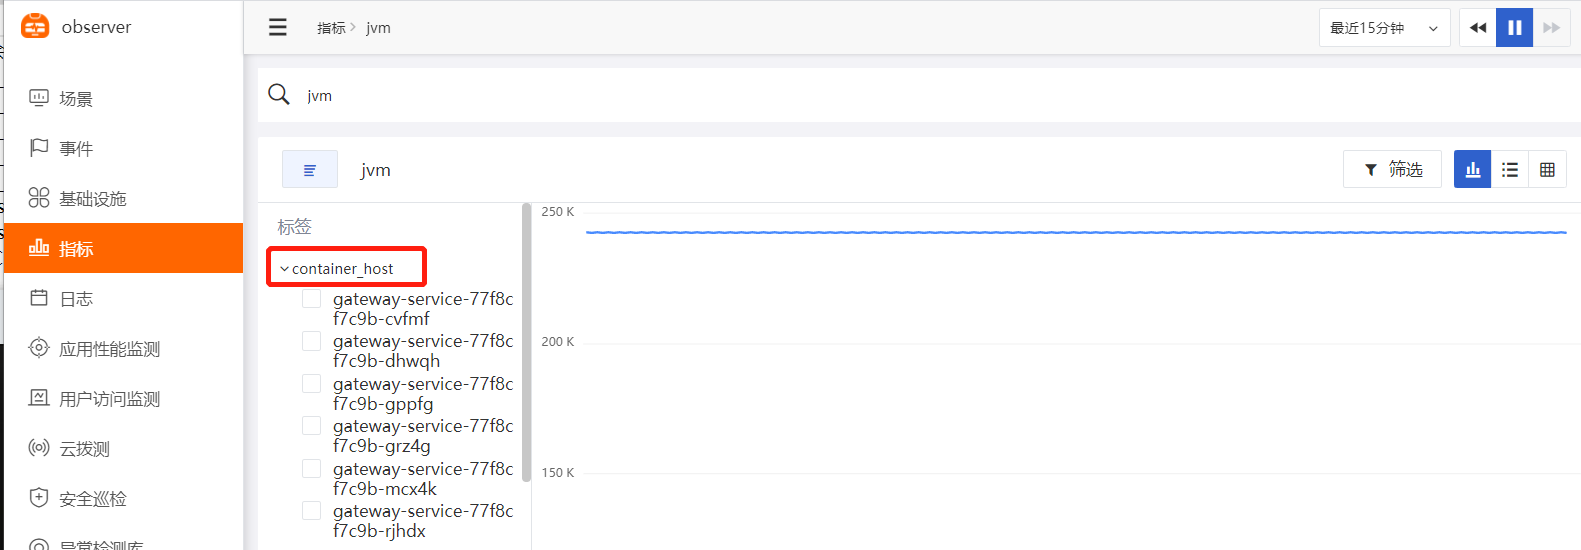
Note: In JAVA_OPTS, -Ddd.tags=container_host:$(PODE_NAME) passes the value of the environment variable PODE_NAME to the tag container_host. Replace 9299 with your application port, replace your-app-name with your service name, replace 30001 with the port exposed to the outside, and replace 172.16.0.215:5000/dk/your-app-image:v1 with your image name.
Start
Create a JVM Monitoring Scenario:
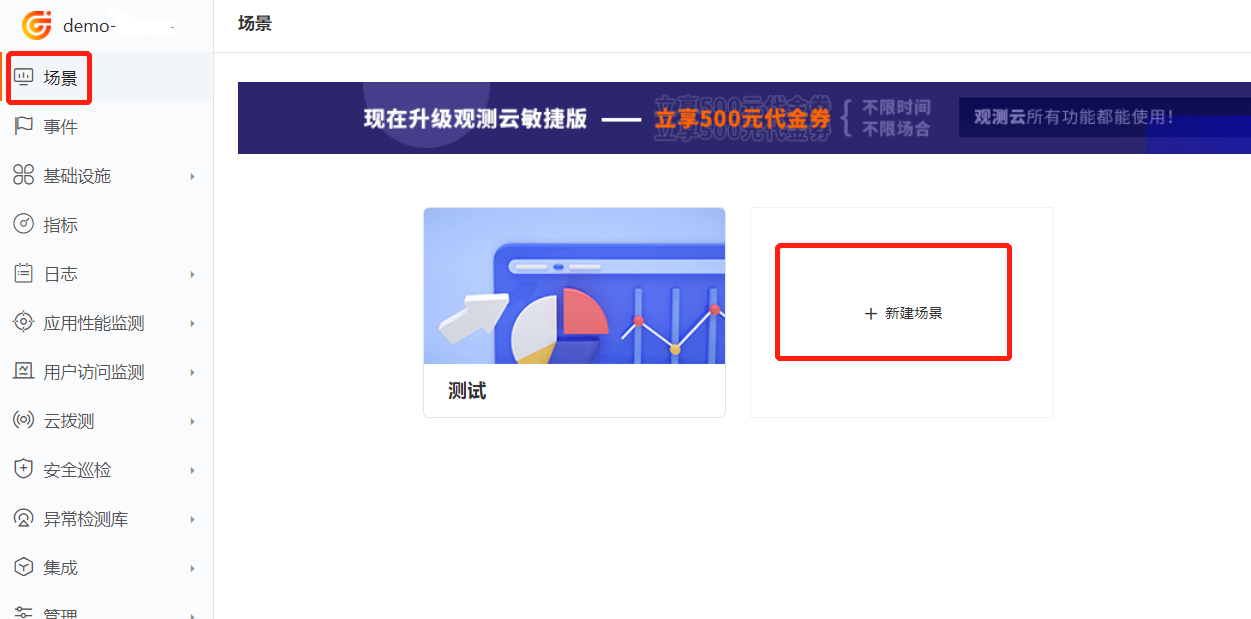
Log in to Guance, enter the workspace, and click Create Dashboard
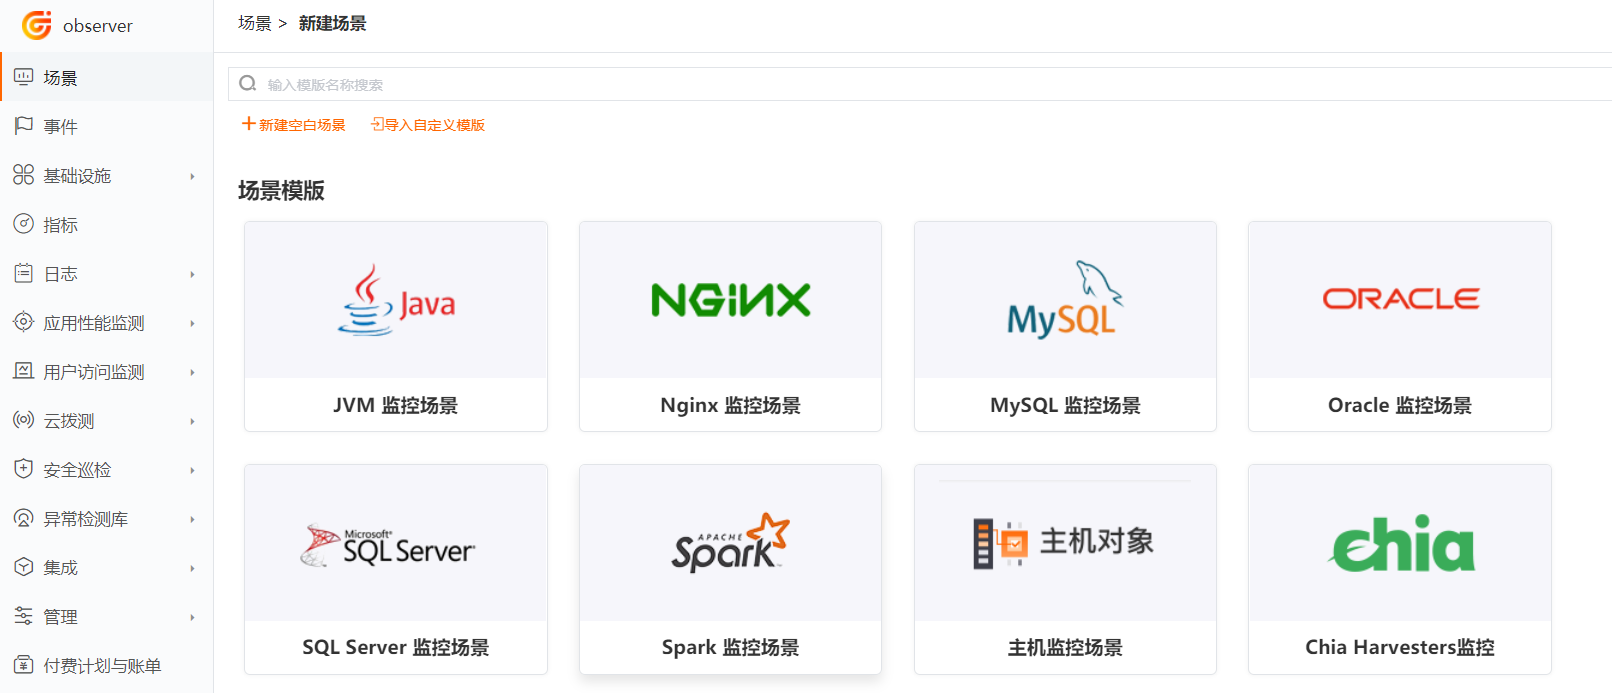
Click JVM Monitoring Dashboard
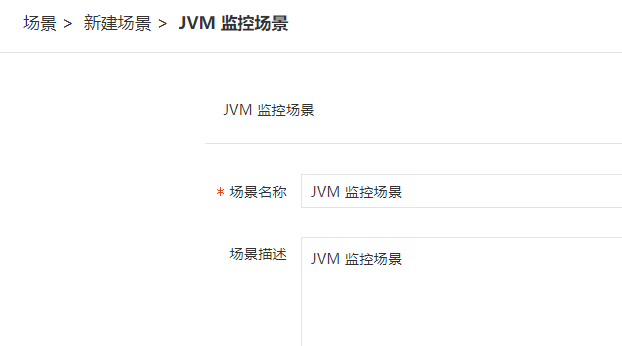
Enter the dashboard name JVM Monitoring Dashboard, and click OK.
Find the JVM monitoring view in the figure above, hover over it, and click Create.
JVM monitoring view:
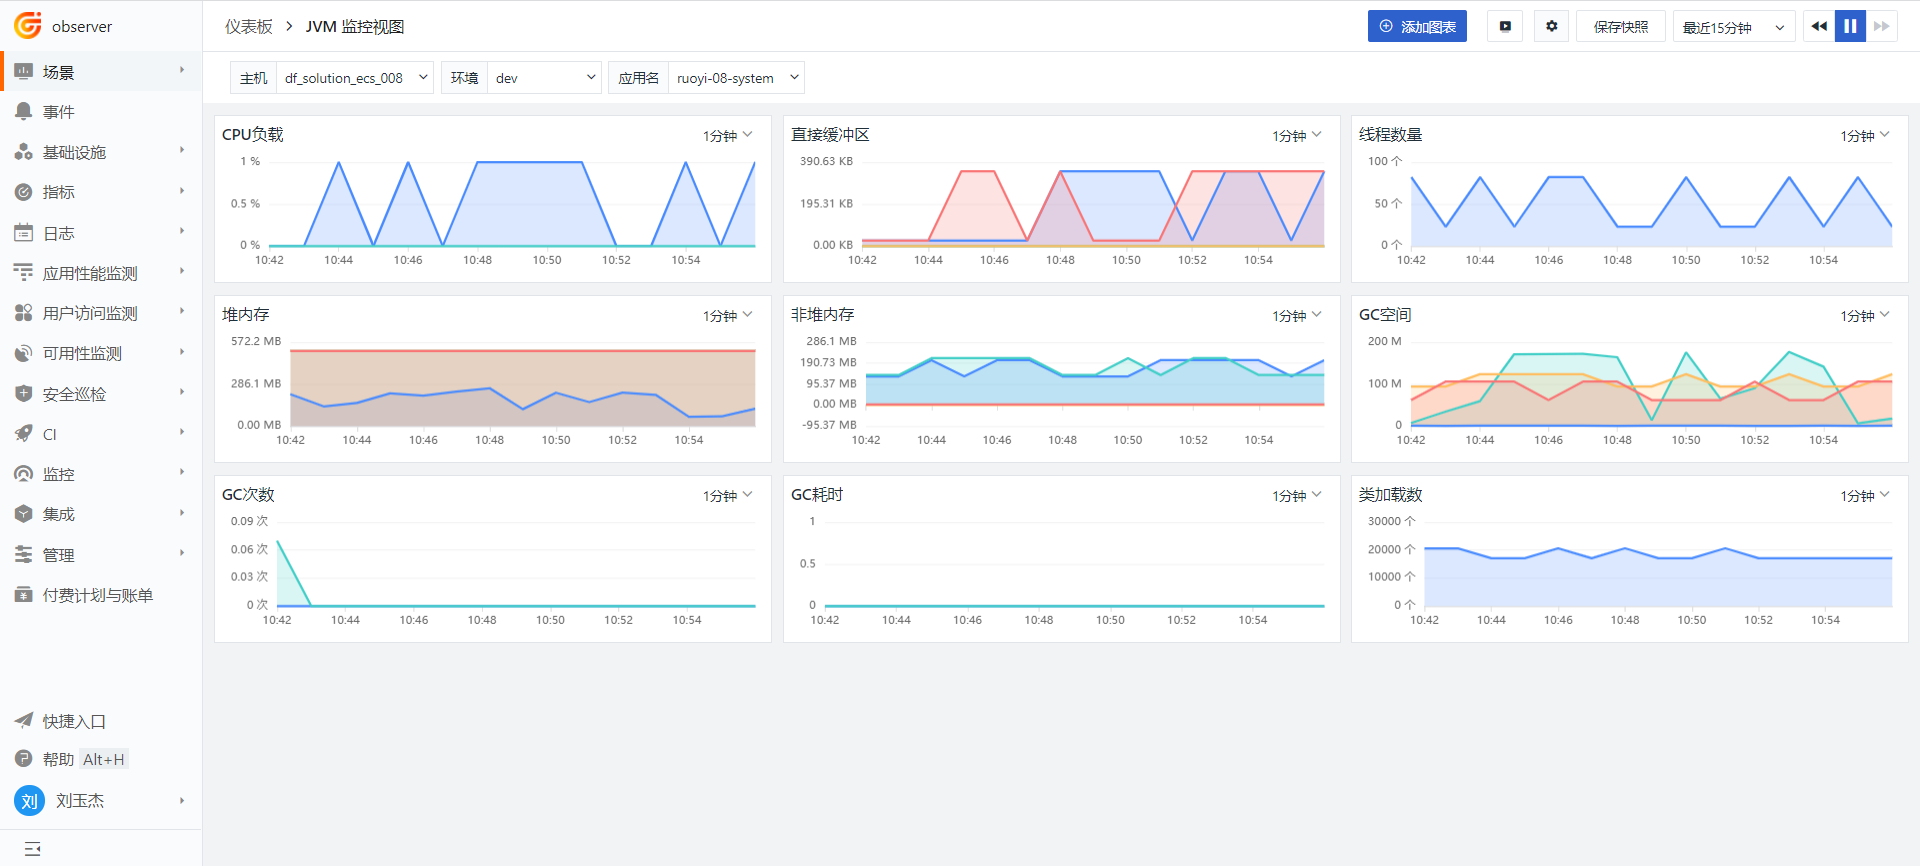
JVM and Related Metrics Overview
1 JVM Overview
1.1 What is the JVM
JVM stands for Java Virtual Machine. It is a virtual computer that runs on top of the operating system and executes Java bytecode.
1.2 Class Loading Mechanism
First, Java source files are compiled into bytecode by the Java compiler. Then, the class loader in the JVM loads the bytecode. After loading, it is passed to the JVM execution engine for execution.
1.3 Class Lifecycle
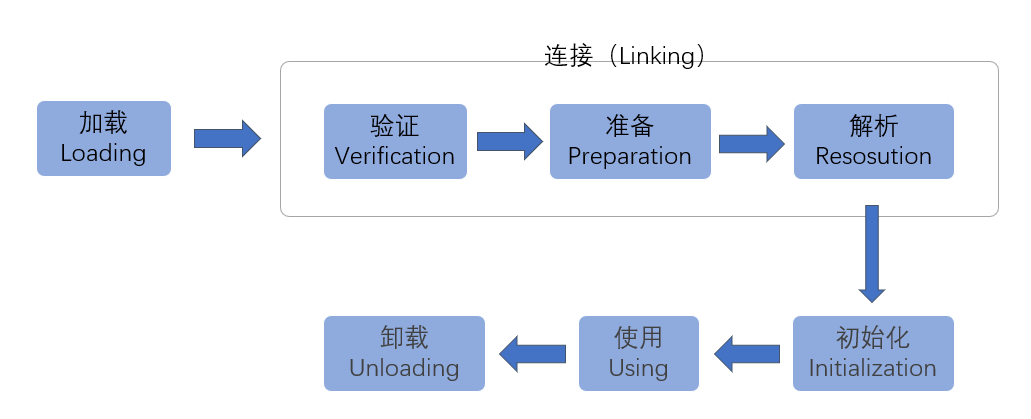
The entire lifecycle of a Java class, from start to end, goes through seven stages: Loading, Verification, Preparation, Resolution, Initialization, Using, and Unloading. Among these, Verification, Preparation, and Resolution are collectively referred to as Linking.
1.4 JVM Memory Structure
During the entire class loading process, the JVM uses a portion of space to store data and related information. This space is commonly referred to as JVM memory. According to the JVM specification, JVM memory is divided into:
- Execution Engine
Java is a cross-platform programming language. The execution engine translates bytecode into machine instructions that can be recognized by the corresponding platform.
- Program Counter Register
The program counter register is a small memory space. Its role can be seen as the line number indicator of the bytecode being executed by the current thread. In the conceptual model of the virtual machine, the bytecode interpreter works by changing the value of this counter to select the next bytecode instruction to be executed. Basic functions such as branching, looping, jumping, exception handling, and thread recovery all rely on this counter.
Features: Very small memory footprint, negligible; thread-isolated; when executing native methods, the program counter value is empty; this memory region is the only one where no OutOfMemoryError condition is specified in the Java Virtual Machine Specification.
- Java Virtual Machine Stack
Describes the memory model of Java method execution. Each method creates a "Stack Frame" when executed. It is thread-private and has the same lifecycle as the thread. The stack frame structure consists of the local variable table, operand stack, dynamic linking, and method exit.
The "stack memory" often referred to as "heap memory, stack memory" refers to the Java Virtual Machine Stack, specifically the local variable table within the stack frame, because it stores all local variables of a method. When a method is called, a stack frame is created and pushed onto the Java Virtual Machine Stack; when the method execution completes, the stack frame is popped and destroyed.
The JVM allocates a certain amount of memory for each thread's Java Virtual Machine Stack (via the -Xss parameter). If the stack depth requested by a single thread exceeds the allowed depth, a StackOverflowError is thrown. When the entire Java Virtual Machine Stack memory is exhausted and no new memory can be allocated, an OutOfMemoryError exception is thrown.
- Native Method Stack
The functionality and characteristics of the Native Method Stack are similar to those of the Java Virtual Machine Stack. Both are thread-isolated and can throw StackOverflowError and OutOfMemoryError exceptions.
The difference is that the Native Method Stack serves native methods executed by the JVM, while the Java Virtual Machine Stack serves Java methods executed by the JVM. How to serve native methods? What language is used to implement native methods? How to organize data structures like stack frames to serve methods? The virtual machine specification does not provide mandatory rules, so different virtual machines can implement them freely. The commonly used HotSpot virtual machine chooses to combine the Java Virtual Machine Stack and the Native Method Stack.
- Method Area
In JDK8, the permanent generation is removed. The runtime constant pool for each class and the compiled code are moved to another local memory area called Metaspace, which is not contiguous with the heap.
Metaspace: Metaspace is the implementation of the Method Area in the HotSpot JVM. The Method Area is mainly used to store class information, constant pools, method data, method code, symbol references, etc. The essence of Metaspace is similar to the permanent generation, both are implementations of the Method Area in the JVM specification. However, the biggest difference is that Metaspace is not located in the virtual machine; it uses local memory. Theoretically, it depends on the memory size of the 32-bit/64-bit system. You can configure the memory size using -XX:MetaspaceSize and -XX:MaxMetaspaceSize.
Metaspace has two parameters: MetaspaceSize: initial Metaspace size, controls the threshold for triggering GC. MaxMetaspaceSize: limits the maximum Metaspace size to prevent abnormal excessive physical memory usage.
- Heap
The heap is shared by all threads and is mainly used to store object instances and arrays. It can be physically non-contiguous but logically contiguous.
Heap memory is divided into the Young Generation and the Old Generation. The Young Generation is further divided into Eden and Survivor areas. The Survivor area consists of FromSpace and ToSpace. The Eden area occupies a large capacity, while the two Survivor areas occupy a small capacity, with a default ratio of 8:1:1.
If there is not enough memory in the Java heap to complete instance allocation, and the heap cannot be expanded further, the Java virtual machine will throw an OutOfMemoryError exception.
Common JVM heap memory parameters
| Parameter | Description |
|---|---|
| -Xms | Initial heap size, in m or g |
| -Xmx (MaxHeapSize) | Maximum allowed heap size, generally should not exceed 80% of physical memory |
| -XX:PermSize | Initial non-heap memory size, generally set to initial 200m, max 1024m for applications |
| -XX:MaxPermSize | Maximum allowed non-heap memory size |
| -XX:NewSize (-Xns) | Initial Young Generation size |
| -XX:MaxNewSize (-Xmn) | Maximum allowed Young Generation size, can also be abbreviated |
| -XX:SurvivorRatio=8 | Capacity ratio between Eden and Survivor areas in the Young Generation, default is 8, i.e., 8:1 |
| -Xss | Stack memory size |
- Runtime Data Area
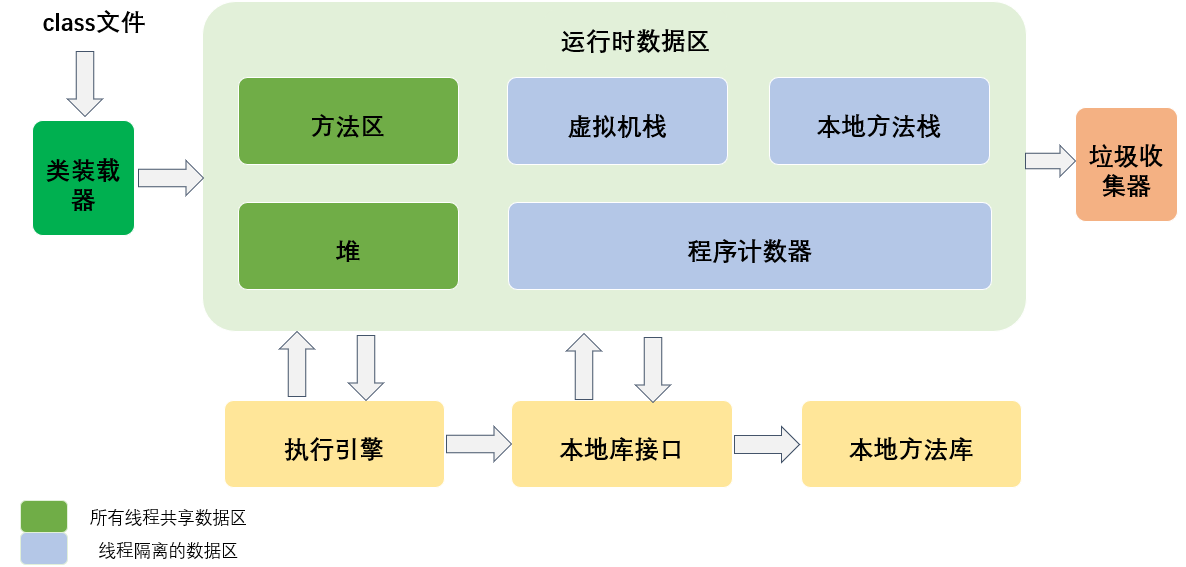
During the execution of a Java program, the Java Virtual Machine divides the memory it manages into several different data areas. Each area has its own purpose, as well as creation and destruction times. Some areas exist as the virtual machine process starts, while others depend on the start and end of user threads.
According to the "Java Virtual Machine Specification (Java SE 8 Edition)", the memory managed by the Java Virtual Machine includes the following runtime data areas: Program Counter Register, Java Virtual Machine Stack, Native Method Stack, Java Heap, and Method Area.
- Direct Memory
Direct memory is not part of the virtual machine runtime data area, nor is it a memory area defined in the Java Virtual Machine Specification. It is not limited by the Java heap size but is limited by the total native memory size.
Direct memory can also be specified using -XX:MaxDirectMemorySize. Allocating direct memory space has higher performance overhead, but direct memory I/O read/write performance is superior to ordinary heap memory. When exhausted, it throws an OutOfMemoryError exception.
- Garbage Collection
The Program Counter Register, Java Virtual Machine Stack, and Native Method Stack are born and die with threads (because they are thread-private). The stack frames in the stack are pushed and popped in an orderly manner as methods are entered and exited. However, the Java heap and Method Area are different. Multiple implementation classes of an interface may require different memory, and multiple branches of a method may also require different memory. Only when the program is running do we know which objects will be created. The allocation and recycling of this part of memory are dynamic. The garbage collector focuses on this part of memory.
Garbage Collectors:
Serial Collector
Parallel Collector
CMS Collector (Concurrent Mark Sweep)
G1 Collector (Garbage First)
Garbage Collection Algorithms:
Mark-Sweep
Copying
Mark-Compact
1.5 GC and Full GC
For generational garbage collection, the Java heap memory is divided into three generations: Young Generation, Old Generation, and Permanent Generation. Whether the Permanent Generation performs GC depends on the JVM used. Newly created objects are preferentially placed in the Young Generation Eden area. Large objects go directly to the Old Generation. When the Eden area does not have enough space, a Minor GC is triggered. Surviving objects are moved to the Survivor0 area. When the Survivor0 area is full, a Minor GC is triggered, and surviving objects in the Survivor0 area are moved to the Survivor1 area. This ensures that one Survivor area is always empty for a period of time. Objects that survive multiple Minor GCs (default 15 times) are promoted to the Old Generation. The Old Generation stores long-lived objects. When the objects promoted to the Old Generation exceed the remaining space in the Old Generation, a Major GC occurs. When the Old Generation space is insufficient, a Full GC is triggered. During a Major GC, user threads are paused, which can reduce system performance and throughput. Therefore, applications with high response requirements should minimize the occurrence of Major GC to avoid response timeouts. If, after GC, the Old Generation still cannot accommodate objects copied from the Survivor area, an OOM (Out of Memory) occurs.
1.6 Causes of OutOfMemoryError
Common causes of OOM (Out of Memory) exceptions include:
1) Insufficient Old Generation memory: java.lang.OutOfMemoryError:Javaheapspace
2) Insufficient Permanent Generation memory: java.lang.OutOfMemoryError:PermGenspace
3) Code bugs causing memory that cannot be reclaimed in time. OOM can occur in any of these memory areas. When encountering OOM, you can locate which area's memory overflowed based on the exception information. You can add the parameter -XX:+HeapDumpOnOutMemoryError to have the virtual machine dump the current heap memory snapshot when an OOM occurs for later analysis.
1.7 JVM Tuning
Having understood the Java memory management mechanism and configuration parameters, here are some tuning configurations for Java application startup options:
-
Set the minimum heap size
-Xmsand maximum heap size-Xmxto be equal to avoid reallocating memory after each garbage collection. -
Set the GC collector to G1:
-XX:+UseG1GC -
Enable GC logs for later analysis:
-Xloggc:../logs/gc.log
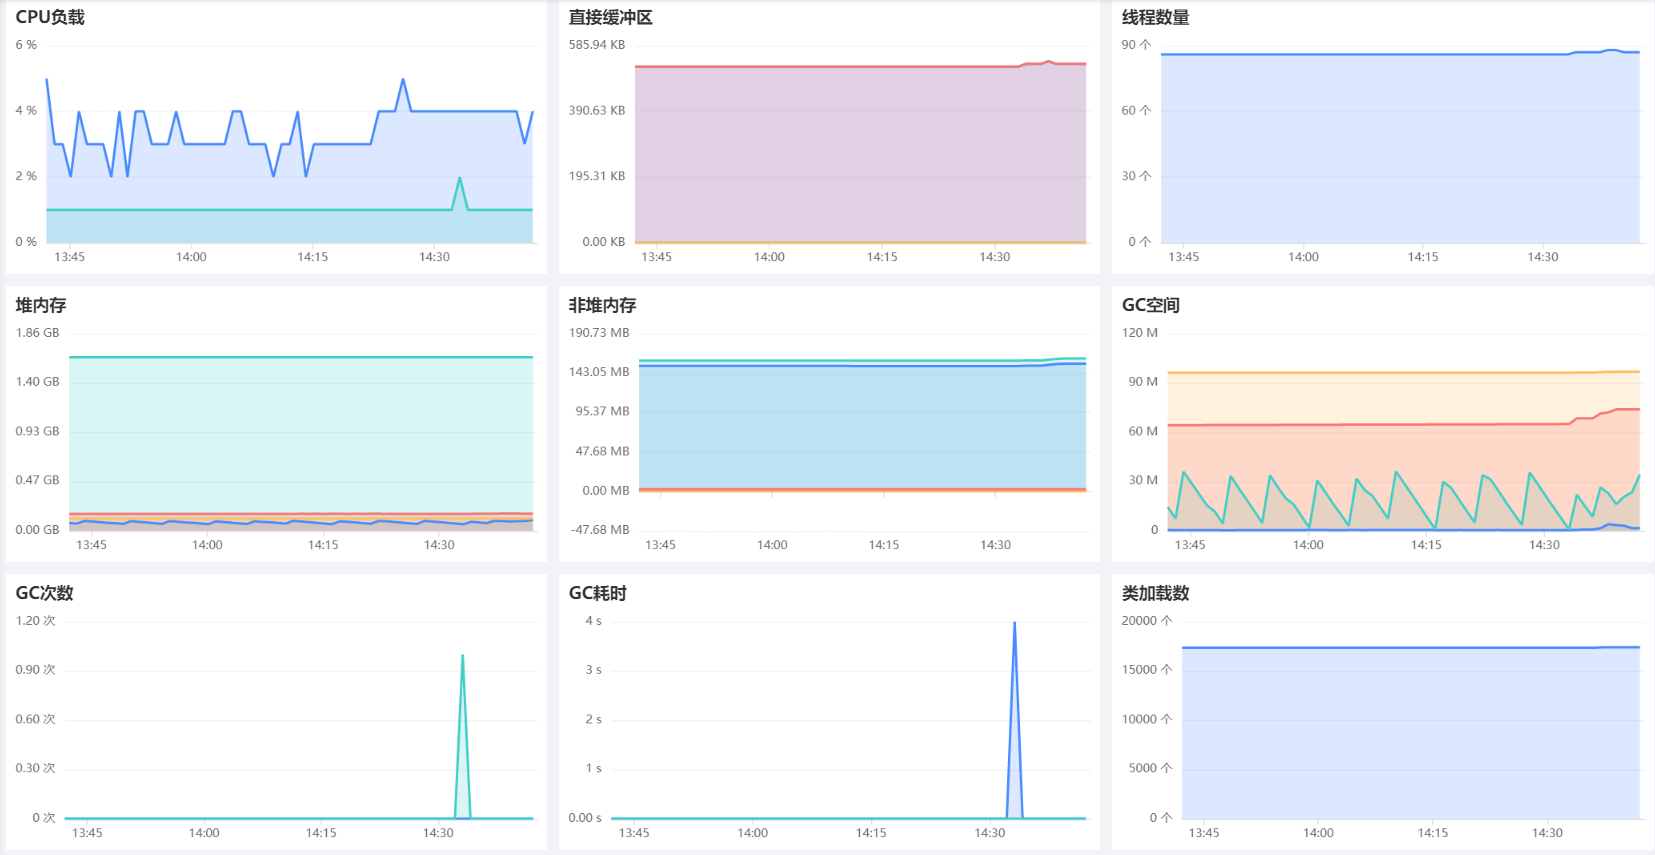
2 Built-in Views
3 Performance Metrics
| Metric | Description | Data Type | Unit |
|---|---|---|---|
| buffer_pool_direct_capacity | Total capacity of direct buffer | int | Byte |
| buffer_pool_direct_count | Direct buffer count | int | count |
| buffer_pool_direct_used | Used size of direct buffer | int | Byte |
| buffer_pool_mapped_capacity | Total capacity of memory-mapped buffer | int | Byte |
| buffer_pool_mapped_count | Memory-mapped buffer count | int | count |
| buffer_pool_mapped_used | Used size of memory-mapped buffer | int | Byte |
| cpu_load_process | CPU percentage used by the process | decimal | percent |
| cpu_load_system | CPU percentage used by the system | decimal | percent |
| gc_eden_size | Eden area size in the Young Generation | int | Byte |
| gc_survivor_size | Survivor area size in the Young Generation | int | Byte |
| gc_old_gen_size | Old Generation size | int | Byte |
| gc_metaspace_size | Metaspace size | int | Byte |
| gc_major_collection_count | Number of Major GCs in the Old Generation | int | count |
| gc_major_collection_time | Time spent on Major GC in the Old Generation | int | ms |
| gc_minor_collection_count | Number of Minor GCs in the Young Generation | int | count |
| gc_minor_collection_time | Time spent on Minor GC in the Young Generation | int | ms |
| heap_memory_committed | Committed heap memory bytes | int | Byte |
| heap_memory_init | Initial heap memory bytes | int | Byte |
| heap_memory_max | Maximum heap memory bytes | int | Byte |
| heap_memory | Used heap memory bytes | int | Byte |
| loaded_classes | Number of loaded classes | int | count |
| non_heap_memory_committed | Committed non-heap memory bytes | int | Byte |
| non_heap_memory_init | Initial non-heap memory bytes | int | Byte |
| non_heap_memory_max | Maximum non-heap memory bytes | int | Byte |
| non_heap_memory | Used non-heap memory bytes | int | Byte |
| os_open_file_descriptors | Number of open file descriptors | int | count |
| thread_count | Total number of threads | int | count |