OpenTelemetry Operator Best Practices
Author: Liu Rui
OpenTelemetry Operator is a Kubernetes Operator implementation.
It mainly manages the following operations:
- OpenTelemetry Collector
- Auto-instrumentation: Automatically instrument workloads using OpenTelemetry instrumentation libraries
Guance's collector, DataKit, incorporates the OpenTelemetry design philosophy and is compatible with the OTLP protocol. Therefore, you can bypass the OpenTelemetry Collector and push data directly to DataKit, or set the OpenTelemetry Collector's exporter to OTLP with the endpoint pointing to DataKit.
We will use two approaches to integrate APM data into Guance:
- APM data is pushed to Guance via the OpenTelemetry Collector;
- APM data is pushed directly to Guance.
Prerequisites
-
k8senvironment - Guance account
Installing OpenTelemetry Components
Install OpenTelemetry Operator
- Download
opentelemetry-operator.yaml
wget https://github.com/open-telemetry/opentelemetry-operator/releases/latest/download/opentelemetry-operator.yaml
- Install
opentelemetry-operator.yaml
[root@k8s-master ~]# kubectl apply -f opentelemetry-operator.yaml
namespace/opentelemetry-operator-system created
customresourcedefinition.apiextensions.k8s.io/instrumentations.opentelemetry.io created
customresourcedefinition.apiextensions.k8s.io/opentelemetrycollectors.opentelemetry.io created
serviceaccount/opentelemetry-operator-controller-manager created
role.rbac.authorization.k8s.io/opentelemetry-operator-leader-election-role created
clusterrole.rbac.authorization.k8s.io/opentelemetry-operator-manager-role created
clusterrole.rbac.authorization.k8s.io/opentelemetry-operator-metrics-reader created
clusterrole.rbac.authorization.k8s.io/opentelemetry-operator-proxy-role created
rolebinding.rbac.authorization.k8s.io/opentelemetry-operator-leader-election-rolebinding created
clusterrolebinding.rbac.authorization.k8s.io/opentelemetry-operator-manager-rolebinding created
clusterrolebinding.rbac.authorization.k8s.io/opentelemetry-operator-proxy-rolebinding created
service/opentelemetry-operator-controller-manager-metrics-service created
service/opentelemetry-operator-webhook-service created
deployment.apps/opentelemetry-operator-controller-manager created
certificate.cert-manager.io/opentelemetry-operator-serving-cert created
issuer.cert-manager.io/opentelemetry-operator-selfsigned-issuer created
mutatingwebhookconfiguration.admissionregistration.k8s.io/opentelemetry-operator-mutating-webhook-configuration created
validatingwebhookconfiguration.admissionregistration.k8s.io/opentelemetry-operator-validating-webhook-configuration created
- Check
pod
[root@k8s-master df-demo]# kubectl get pod -n opentelemetry-operator-system
NAME                                                         READY   STATUS    RESTARTS   AGE
opentelemetry-operator-controller-manager-7b4687df88-9s967   2/2     Running   0          26h
Install OpenTelemetry Collector
- Create
opentelemetry-collector.yaml
apiVersion: opentelemetry.io/v1alpha1
kind: OpenTelemetryCollector
metadata:
  name: demo
spec:
  config: |
    receivers:
      otlp:
        protocols:
          grpc:
          http:
    processors:
      memory_limiter:
        check_interval: 1s
        limit_percentage: 75
        spike_limit_percentage: 15
      batch:
        send_batch_size: 10000
        timeout: 10s

    exporters:
      logging:
      otlp:
        endpoint: "http://datakit-service.datakit:4319" # Send trace data to Guance platform
        tls:
          insecure: true
        #compression: none # Disable gzip compression

    service:
      pipelines:
        traces:
          receivers: [otlp]
          processors: [memory_limiter, batch]
          exporters: [logging,otlp]
        metrics:
          receivers: [otlp]
          processors: [memory_limiter, batch]
          exporters: [logging]
        logs:
          receivers: [otlp]
          processors: [memory_limiter, batch]
          exporters: [logging]
- Apply
opentelemetry-collector.yaml
- Check
pod
[root@k8s-master ~]# kubectl get pod
NAME                                 READY   STATUS    RESTARTS   AGE
demo-collector-59b9447bf9-dz47k      1/1     Running   0          61m
Install Instrumentation
The OpenTelemetry Operator can inject and configure OpenTelemetry auto-instrumentation libraries. Currently supports Apache HTTPD, DotNet, Go, Java, NodeJS, and Python.
To use auto-instrumentation, configure the instrumentation resource with the SDK and instrumentation configuration.
- Create
opentelemetry-instrumentation.yaml
apiVersion: opentelemetry.io/v1alpha1
kind: Instrumentation
metadata:
  name: my-instrumentation
spec:
  exporter:
    endpoint: http://demo-collector:4317 # OpenTelemetry Collector address
    # endpoint: http://datakit-service.datakit:4319 # Guance DataKit OpenTelemetry collector address
  propagators:
    - tracecontext
    - baggage
    - b3
  #sampler:
      #type: parentbased_traceidratio
      #argument: "0.25"
  java:
    image: ghcr.io/open-telemetry/opentelemetry-operator/autoinstrumentation-java:latest
  nodejs:
    image: ghcr.io/open-telemetry/opentelemetry-operator/autoinstrumentation-nodejs:latest
  python:
    image: ghcr.io/open-telemetry/opentelemetry-operator/autoinstrumentation-python:latest
exporter: Data export endpoint. Can be the OpenTelemetry Collector or another collector that can receiveotlpprotocol data.propagators: Trace context propagators. For more information about propagator behavior, refer to the documentation.sampler: Sampling configuration.-
java\nodejs\python: Agent images for different languages. Fill in according to the actual project requirements. -
Apply
opentelemetry-instrumentation.yaml
- Check
instrumentation
[root@k8s-master ~]# kubectl get instrumentation
NAME                 AGE   ENDPOINT                     SAMPLER   SAMPLER ARG
my-instrumentation   65m   http://demo-collector:4317
Alternatively, use the kubectl get otelinst command to view.
[root@k8s-master ~]#  kubectl get otelinst
NAME                 AGE   ENDPOINT                     SAMPLER   SAMPLER ARG
my-instrumentation   71m   http://demo-collector:4317
Guance
Install DataKit on Kubernetes
OpenTelemetry Collector Configuration
- Add
volumeMountsunderDaemonSetindatakit.yaml:
apiVersion: apps/v1
kind: DaemonSet
metadata:
  labels:
    app: daemonset-datakit
  name: datakit
  namespace: datakit
spec:
  revisionHistoryLimit: 10
  selector:
    matchLabels:
      app: daemonset-datakit
  template:
    metadata:
      labels:
        app: daemonset-datakit
    spec:
      hostNetwork: true
      dnsPolicy: ClusterFirstWithHostNet
      containers:
      ...
      volumeMounts:
        - mountPath: /usr/local/datakit/conf.d/opentelemetry/opentelemetry.conf
          name: datakit-conf
          subPath: opentelemetry.conf
      ....
- Add
opentelemetry.confunderConfigMapdata indatakit.yaml
apiVersion: v1
kind: ConfigMap
metadata:
  name: datakit-conf
  namespace: datakit
data:
    opentelemetry.conf: |-
        [[inputs.opentelemetry]]
            [inputs.opentelemetry.grpc]
            trace_enable = true
            metric_enable = true
            addr = "0.0.0.0:4319" # default 4317
            [inputs.opentelemetry.http]
            enable = false
            http_status_ok = 200
- Restart DataKit
Application
Here we prepare a JAVA application springboot-server
- Create
springboot-server.yaml
apiVersion: v1
kind: Service
metadata:
  name: springboot-server
  labels:
    app: springboot-server
spec:
  selector:
    app: springboot-server
  ports:
    - protocol: TCP
      port: 8080
      targetPort: 8080
      nodePort: 31010
  type: NodePort
---
apiVersion: apps/v1
kind: Deployment
metadata:
  name: springboot-server
spec:
  selector:
    matchLabels:
      app: springboot-server
  replicas: 1
  template:
    metadata:
      labels:
        app: springboot-server
      annotations:
        sidecar.opentelemetry.io/inject: "true"
        instrumentation.opentelemetry.io/inject-java: "true"
    spec:
      containers:
      - name: app
        image: registry.cn-shenzhen.aliyuncs.com/lr_715377484/springboot-server
        ports:
          - containerPort:  8080
            protocol: TCP
- Apply
springboot-server.yaml
- Check
pod
[root@k8s-master ~]# kubectl get pod -owide
NAME                                 READY   STATUS    RESTARTS   AGE    IP                NODE        NOMINATED NODE   READINESS GATES
demo-collector-59b9447bf9-dz47k      1/1     Running   0          24h    100.111.156.98    k8s-node1   <none>           <none>
springboot-server-64b78f4487-9hv9r   1/1     Running   0          24h    100.111.156.108   k8s-node1   <none>           <none>
- Check
poddetails
[root@k8s-master ~]# kubectl describe pod springboot-server-64b78f4487-9hv9r
Name:         springboot-server-64b78f4487-9hv9r
Namespace:    default
Priority:     0
Node:         k8s-node1/172.31.22.247
Start Time:   ...
Labels:       app=springboot-server
              pod-template-hash=64b78f4487
Annotations:  cni.projectcalico.org/containerID: 5700e2ab666a8bbc32b1ac84cc3d98137a7e186ca5cf4b0b6e7407ac8139d391
              cni.projectcalico.org/podIP: 100.111.156.108/32
              cni.projectcalico.org/podIPs: 100.111.156.108/32
              instrumentation.opentelemetry.io/inject-java: true
              sidecar.opentelemetry.io/inject: true
Status:       Running
IP:           100.111.156.108
IPs:
  IP:           100.111.156.108
Controlled By:  ReplicaSet/springboot-server-64b78f4487
Init Containers:
  opentelemetry-auto-instrumentation:
    Container ID:  containerd://c5747d8217b43fcb1a8eac00fbd33d70c7b25d1a3f0faaccdacea94c8b1e016b
    Image:         ghcr.io/open-telemetry/opentelemetry-operator/autoinstrumentation-java:latest
    Image ID:      ghcr.io/open-telemetry/opentelemetry-operator/autoinstrumentation-java@sha256:f903e6eb067f28cba1f37b6ac592b511c61ce0bf2a73f6e7619359ac5d500d85
    Port:          <none>
    Host Port:     <none>
    Command:
      cp
      /javaagent.jar
      /otel-auto-instrumentation/javaagent.jar
    ...
    Mounts:
      /otel-auto-instrumentation from opentelemetry-auto-instrumentation (rw)
      /var/run/secrets/kubernetes.io/serviceaccount from kube-api-access-lbmf6 (ro)
Containers:
  app:
    Container ID:   containerd://0db185a75e9eeb5eed97aaf8e707f4bd30f210e404f5fae98fc0d55a300a4470
    Image:          registry.cn-shenzhen.aliyuncs.com/lr_715377484/springboot-server
    Image ID:       registry.cn-shenzhen.aliyuncs.com/lr_715377484/springboot-server@sha256:bf394ec31566653bc6aa0e56dfc94a602bde3d95dfb08ac96d7f33c5dc00005e
    Port:           8080/TCP
    Host Port:      0/TCP
    State:          Running
      Started:      ...
    Ready:          True
    Restart Count:  0
    Environment:
      JAVA_TOOL_OPTIONS:                    -javaagent:/otel-auto-instrumentation/javaagent.jar
      OTEL_SERVICE_NAME:                   springboot-server
      OTEL_EXPORTER_OTLP_ENDPOINT:         http://demo-collector:4317
      OTEL_RESOURCE_ATTRIBUTES_POD_NAME:   springboot-server-64b78f4487-9hv9r (v1:metadata.name)
      OTEL_RESOURCE_ATTRIBUTES_NODE_NAME:   (v1:spec.nodeName)
      OTEL_PROPAGATORS:                    tracecontext,baggage,b3
      OTEL_RESOURCE_ATTRIBUTES:            k8s.container.name=app,k8s.deployment.name=springboot-server,k8s.namespace.name=default,k8s.node.name=$(OTEL_RESOURCE_ATTRIBUTES_NODE_NAME),k8s.pod.name=$(OTEL_RESOURCE_ATTRIBUTES_POD_NAME),k8s.replicaset.name=springboot-server-64b78f4487
    Mounts:
      /otel-auto-instrumentation from opentelemetry-auto-instrumentation (rw)
      /var/run/secrets/kubernetes.io/serviceaccount from kube-api-access-lbmf6 (ro)
Init Containers: The init container executed the opentelemetry-auto-instrumentation sidecar.
Default environment variables injected for JAVA applications:
    Environment:
      JAVA_TOOL_OPTIONS:                    -javaagent:/otel-auto-instrumentation/javaagent.jar
      OTEL_SERVICE_NAME:                   springboot-server
      OTEL_EXPORTER_OTLP_ENDPOINT:         http://demo-collector:4317
      OTEL_RESOURCE_ATTRIBUTES_POD_NAME:   springboot-server-64b78f4487-9hv9r (v1:metadata.name)
      OTEL_RESOURCE_ATTRIBUTES_NODE_NAME:   (v1:spec.nodeName)
      OTEL_PROPAGATORS:                    tracecontext,baggage,b3
      OTEL_RESOURCE_ATTRIBUTES:            k8s.container.name=app,k8s.deployment.name=springboot-server,k8s.namespace.name=default,k8s.node.name=$(OTEL_RESOURCE_ATTRIBUTES_NODE_NAME),k8s.pod.name=$(OTEL_RESOURCE_ATTRIBUTES_POD_NAME),k8s.replicaset.name=springboot-server-64b78f4487
At this point, the JAVA application has successfully injected the opentelemetry-auto-instrumentation sidecar.
Generate Trace Data
-
On the host, execute the following command to generate
100.111.156.108 is thetracedata:ipof the pod. -
Alternatively, access the svc port to generate
tracedata:
View Application Logs
[root@k8s-master ~]# kubectl logs -f springboot-server-64b78f4487-9hv9r
....
2023-08-* 16:34:17.454 [http-nio-8080-exec-8] INFO  c.z.o.s.c.ServerController - [auth,74] traceId=a1b510158fc09c55c04de2d9472d10d7 spanId=61b6bd8264f7d8b1 - this is auth
2023-08-* 16:34:17.456 [http-nio-8080-exec-5] INFO  c.z.o.s.f.CorsFilter - [doFilter,32] traceId=a1b510158fc09c55c04de2d9472d10d7 spanId=62370160a0fc0738 - url:/billing,header:
accept              :application/json, application/*+json
traceparent             :00-a1b510158fc09c55c04de2d9472d10d7-057f9e068e9cc007-01
b3              :a1b510158fc09c55c04de2d9472d10d7-057f9e068e9cc007-1
user-agent              :Java/1.8.0_212
host                :localhost:8080
connection              :keep-alive

2023-08-* 16:34:17.456 [http-nio-8080-exec-5] INFO  c.z.o.s.c.ServerController - [billing,82] traceId=a1b510158fc09c55c04de2d9472d10d7 spanId=9514404368a2d4fd - this is method3,null
Trace-related information traceparent and b3 have been generated.
You can also see traceId and spanId in the logs. For details on how to correlate logs with traces, refer to the documentation Log Correlation.
Push Application Data Directly to Guance
- Modify the
OTEL_EXPORTER_OTLP_ENDPOINTin theopentelemetry-instrumentation.yamlfile:
[root@k8s-master ~]# kubectl describe pod springboot-server-64b78f4487-t7gph |grep OTEL_EXPORTER_OTLP_ENDPOINT
      OTEL_EXPORTER_OTLP_ENDPOINT:         http://datakit-service.datakit:4319
- Re-apply the following
yaml:
kubectl delete -f opentelemetry-instrumentation.yaml
kubectl apply -f opentelemetry-instrumentation.yaml

kubectl delete -f springboot-server.yaml
kubectl apply -f springboot-server.yaml
-
Access the application URL to generate trace data.
-
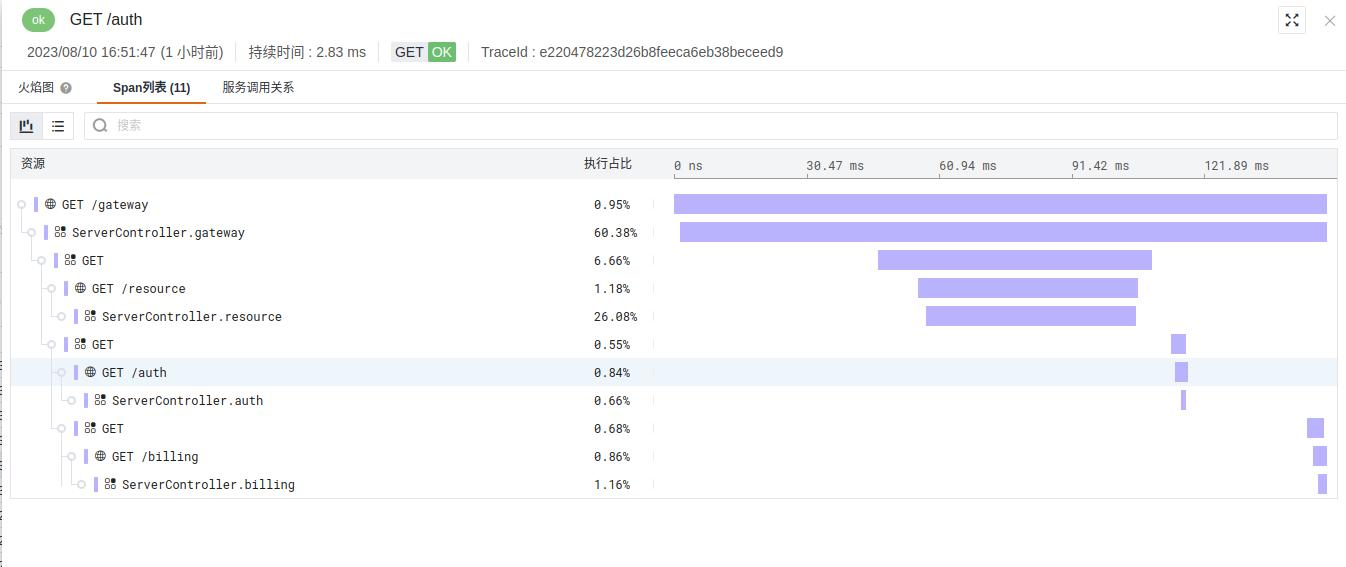
Log in to the Guance account and view the trace view.