Web Application Monitoring (RUM) Best Practices
Prerequisites
- Go to the Guance official website to register an account, then log in with your registered account/password.
- On the server, <install DataKit>
Introduction to Web Application Monitoring (RUM)
RUM stands for Real user monitor (real user experience management). With the development of mobile internet, more and more enterprises have their final business representations concentrated on the end-user side, i.e., the RUM side, in the forms of Mobile-APP, web pages, and mini-programs (WeChat, Alipay, Toutiao, etc.). As the internet industry develops, competition in various industries has become increasingly fierce. The terminal experience of real users directly affects user acquisition, retention, corporate image, and even revenue. Therefore, improving the end-user experience has become a critical issue for the internet industry and even for traditional enterprises that are undergoing or about to undergo digital transformation.
Brief Introduction to RUM Principles
Principle introduction: The way RUM collects data has gone through several generations of changes. Currently, the common approach is based on the [navigation-timing] standard defined by the W3C (World Wide Web Consortium) (see figure below). This standard defines various browser events. By simply calculating these browser events, you can derive the durations of first screen, white screen, DOM loading, HTML loading, etc. on the frontend. Compared to the F12 inspector mode in a test environment, this method more effectively collects the real user frontend experience in a production environment. Therefore, it is extremely popular in the current H5 application landscape. Domestic commercial software (Tingyun, Borui, Cloudwise, oneAPM) all rely on this standard to build their web monitoring systems. This standard is applicable to most H5 scenarios.
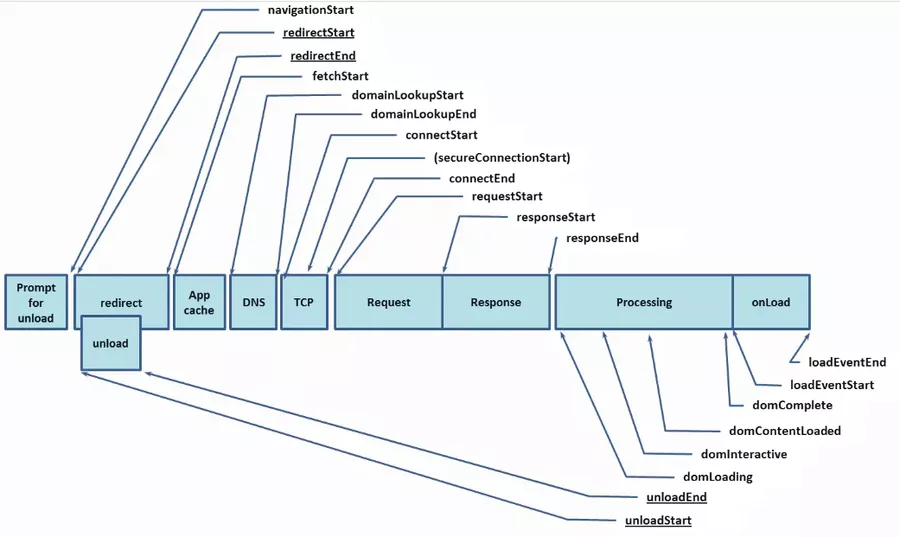
With the development of browsers (especially Chrome) and frontend technologies, the limitations of navigation-timing have become increasingly apparent. For example, in the separation of frontend and backend, the number of single-page applications is increasing. In such scenarios, data collection based on navigation-timing becomes cumbersome. Therefore, the W3C introduced a new standard: [PaintTiming-github] [PaintTiming-api]. The new metrics proposed by this standard include First Paint, First Contentful Paint, etc., which better reflect the real experience of users when accessing web pages. DF-RUM uses the data collection that supports the PaintTiming specification. If you are interested in this specification, you can read further: [Using the Paint Timing API to improve performance] [Using Paint Timing].
Currently, DF officially supports the following RUM monitoring methods:
Web Application: [Web Application Access to DF Monitoring] [Web Application Monitoring Best Practices]
APP (Android & iOS): [ Android Access to DF Monitoring] [ iOS Access to DF Monitoring] [APP Monitoring Best Practices - To be added][]
Mini Program (WeChat): [f] [Mini Program Monitoring Best Practices - To be added]
Steps to Access RUM from a Web Page
1. Log in to Guance
2. Select User Access Monitoring → Create Application → Select Web type → Synchronous Loading
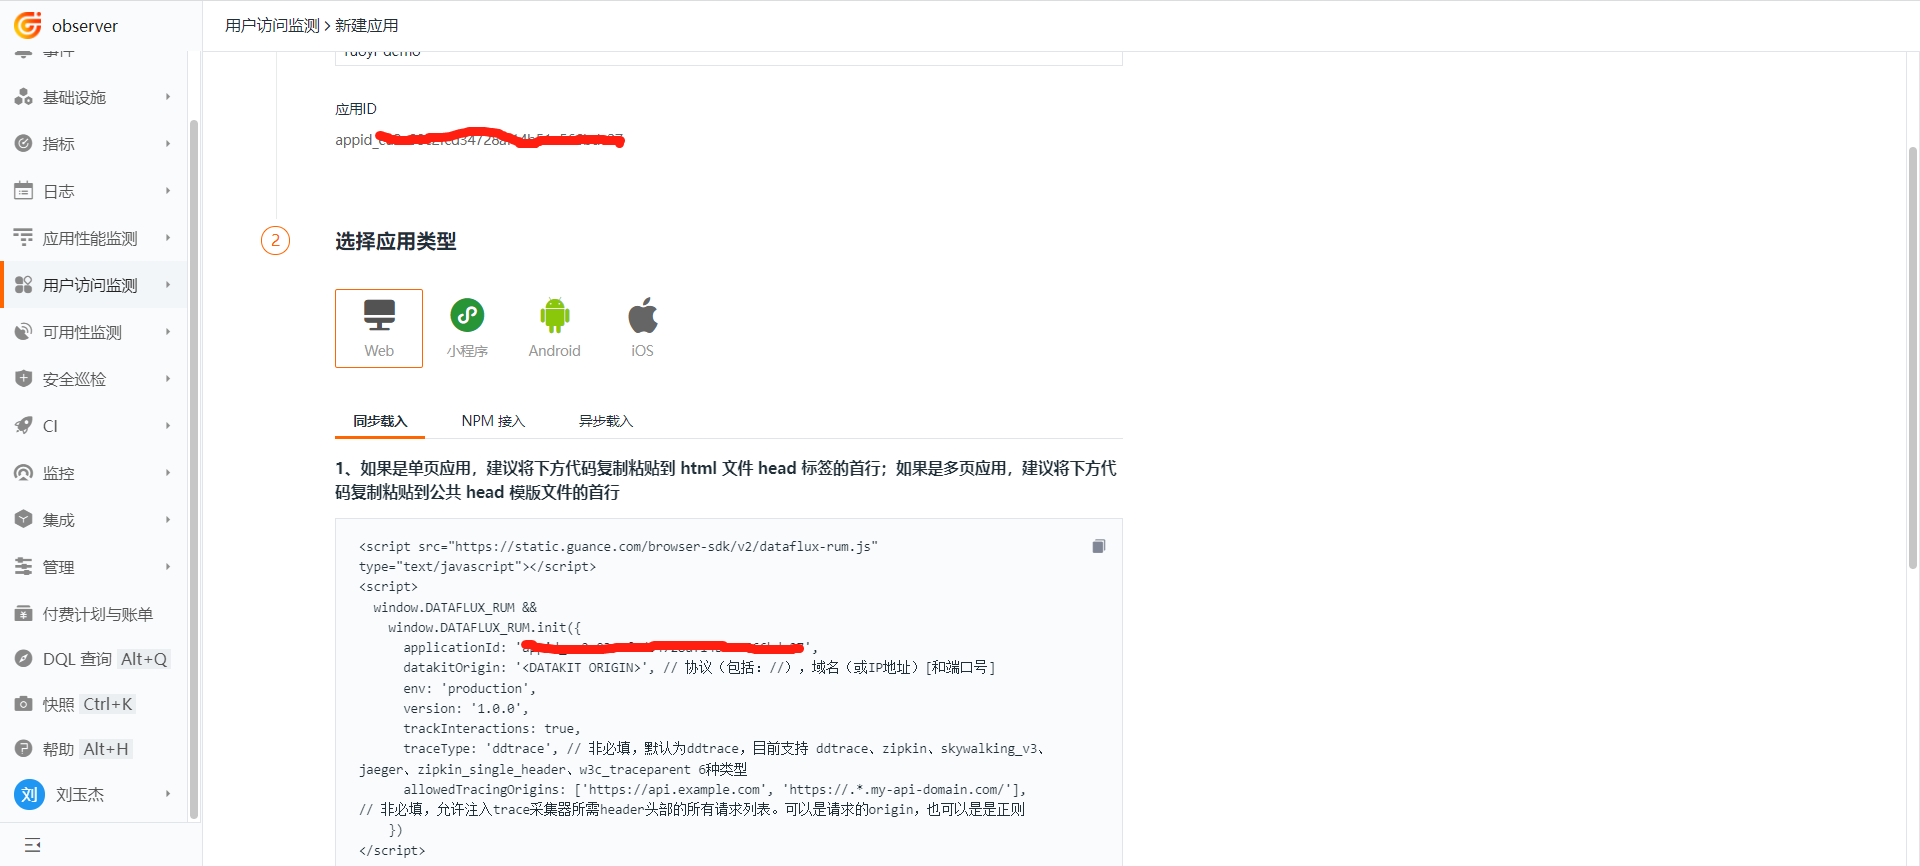
Note: Here, select CDN Synchronous Loading.
• Modify the frontend index.html page (remember to backup with cp).
Add the copied JS snippet before :
| Access Method | Description |
|---|---|
| NPM | Package the SDK code together with your frontend project. This method ensures no impact on frontend page performance, but may miss requests and errors that occur before SDK initialization. |
| CDN Asynchronous Loading | Introduce the SDK script as an asynchronous script via CDN cache acceleration. This method ensures that downloading the SDK script does not affect page loading performance, but may miss requests and errors that occur before SDK initialization. |
| CDN Synchronous Loading | Introduce the SDK script as a synchronous script via CDN cache acceleration. This method ensures that all errors, resources, requests, and performance metrics are collected. However, it may affect page loading performance. |
3. Add the RUM Observability JS File to the Frontend Page index.html
$ cd /usr/local/ruoyi/dist/index.html

// Remember to backup
$ cp index.html index.html.bkd

// Add df-js to index.html
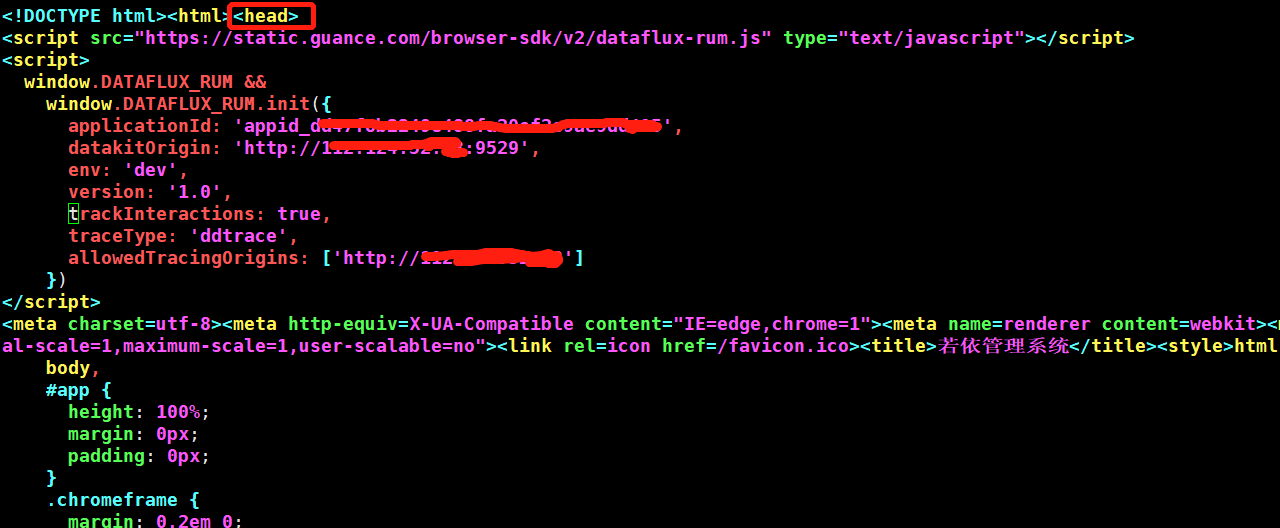
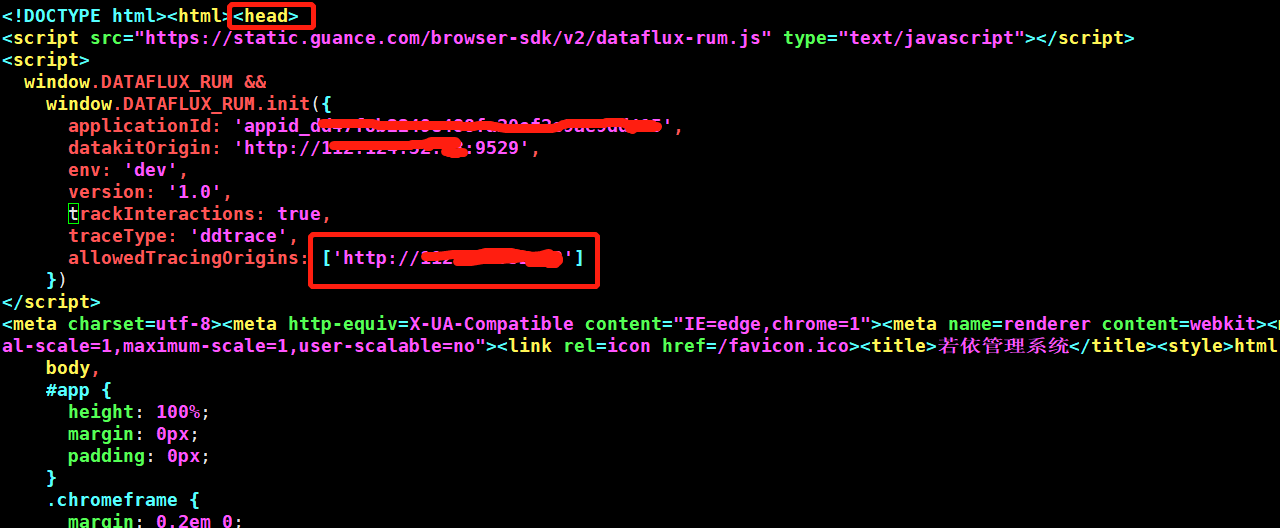
// Copy the JS content from the DF platform, place it before </head> in index.html, then save the file. Example:
// datakitOrigin: the address of the DataKit. In DF, the RUM data flow is: rum.js file → DataKit → DataWay → DF platform.
//   In a production environment, set this IP as a domain name. In a test environment, use the internal IP, corresponding to port 9529 of the server running DataKit.
// trackInteractions: user behavior collection configuration, used to collect statistics on user operations on the page.
// allowedTracingOrigins: configuration for integrating frontend and backend (RUM and APM). Configure as needed. Fill in the domain or IP of the backend server that interacts with the frontend page. 127.0.0.1 is just an example.

$ vim index.html

<head>
<script src="https://static.guance.com/browser-sdk/v2/dataflux-rum.js" type="text/javascript"></script>
<script>
  window.DATAFLUX_RUM &&
    window.DATAFLUX_RUM.init({
      applicationId: 'xxxxxxxxxxxxxxxxxxxxxxxxxx',
      datakitOrigin: 'http://127.0.0.1:9529',
      env: 'test',
      version: '1.0.0',
      trackInteractions: true,
      traceType: 'ddtrace',
      allowedTracingOrigins: ['http://127.0.0.1']
    })
</script>
</head>
Important Notes:
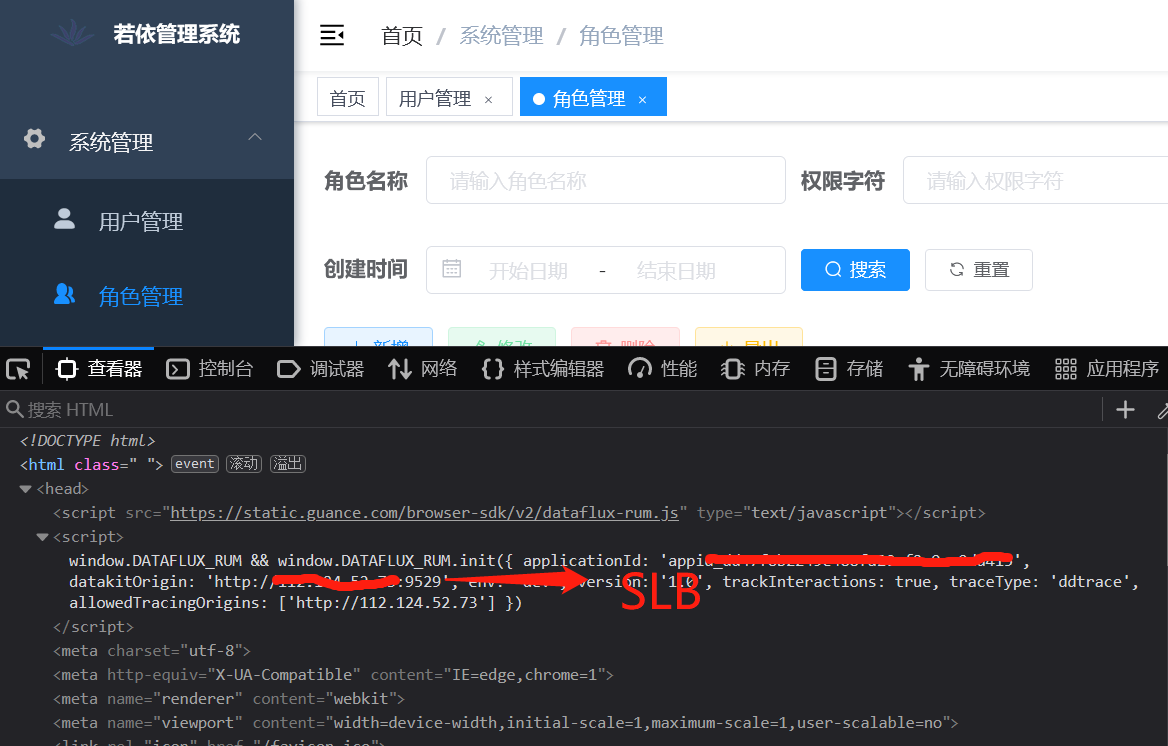
- datakitOrigin: The address for data transmission. In a production environment, if configured as a domain name, you can forward domain requests to any server running DataKit on port 9529. If the frontend traffic is heavy, you can add an SLB between the domain and the server running DataKit. The frontend JS sends data to the SLB, and the SLB distributes requests to multiple servers running DataKit on port 9529. Multiple DataKits can handle RUM data. Because frontend requests are multiplexed, session data will not be interrupted, and this does not affect the display of RUM data.
Example:
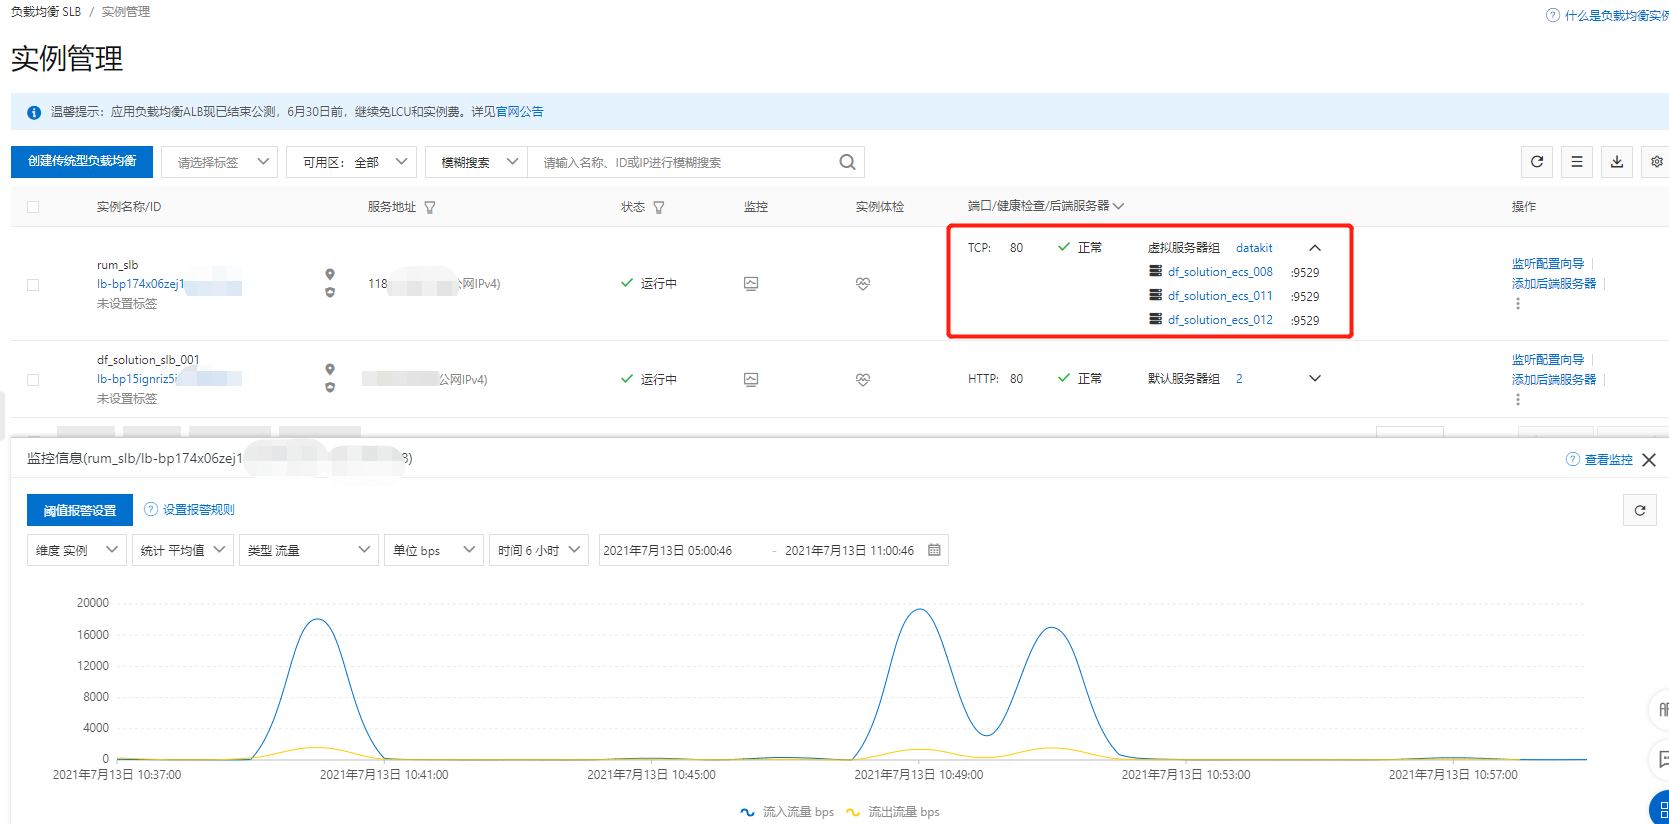
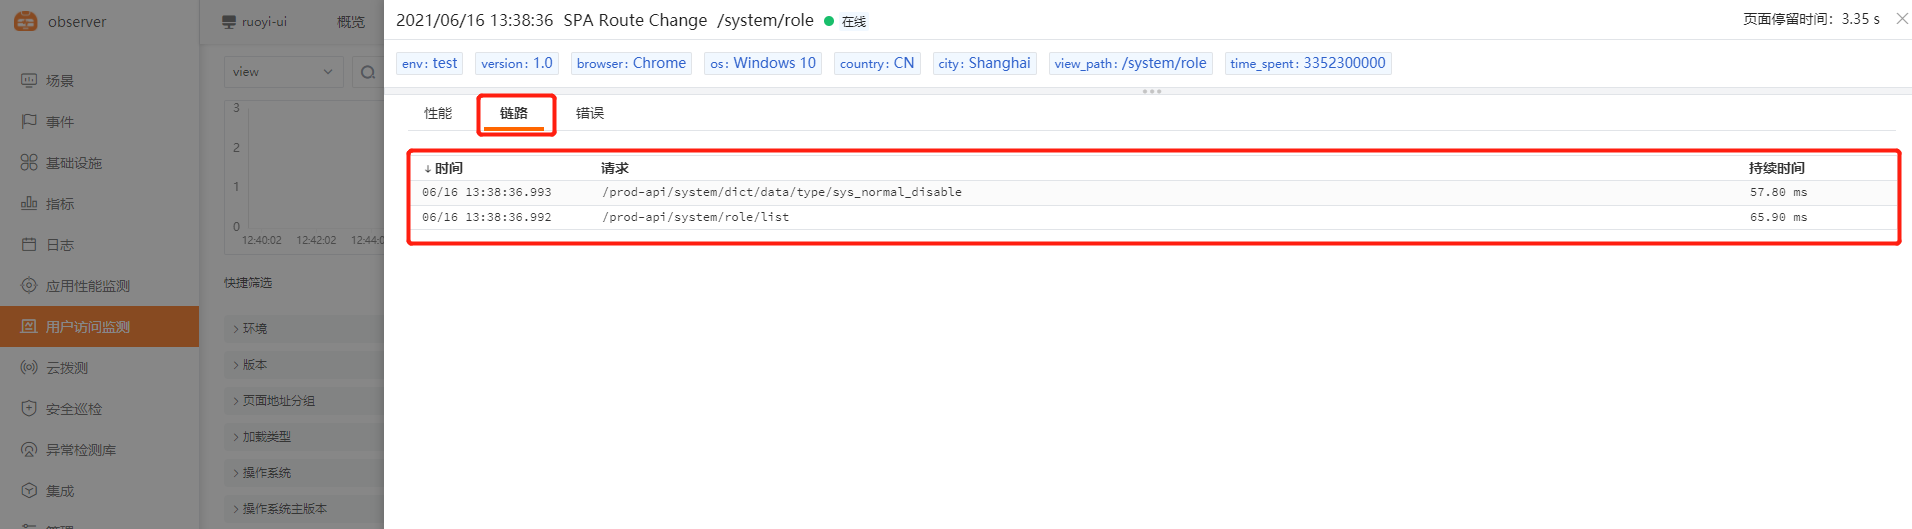
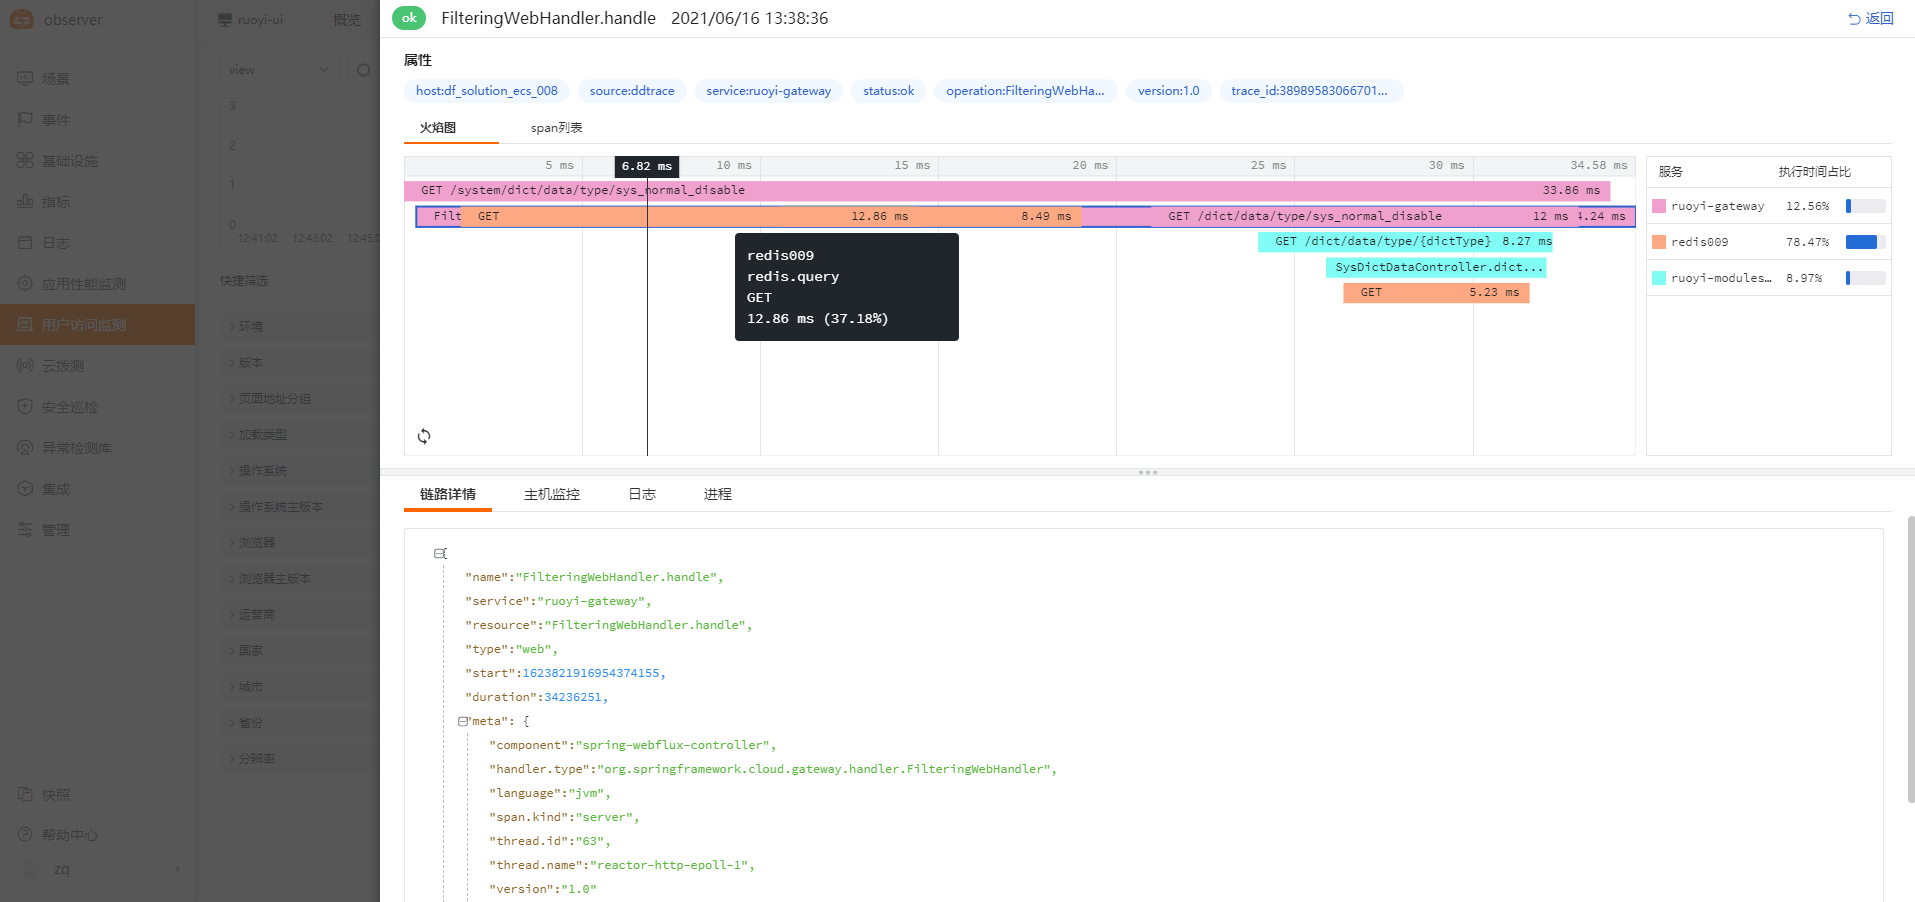
- allowedTracingOrigins: Enable frontend-backend integration (APM and RUM). This scenario only takes effect when RUM is deployed on the frontend and APM is deployed on the backend. Fill in the domain (production) or IP (test) of the backend application server that interacts with the frontend page. Use case: When a slow frontend user access is caused by abnormal backend code logic, you can jump from the frontend RUM slow request data to the APM data to view the backend code call chain at that time, determining the root cause of the slowness. Implementation principle: When a user accesses the frontend application, the frontend application makes resource and request calls, triggering RUM JS performance data collection. RUM JS generates a trace-id and writes it in the request header of the request. When the request reaches the backend, the backend's ddtrace reads the trace_id and records it in its own trace data, thus enabling data linkage between Application Performance Monitoring and User Access Monitoring through the same trace_id.
- env: Required. The environment of the application, such as
test,product, or other fields. - version: Required. The version number of the application.
- trackInteractions: User behavior statistics, such as clicking buttons, submitting forms, etc.
- traceType: Optional. Default is
ddtrace. Currently supports 6 types:ddtrace,zipkin,skywalking_v3,jaeger,zipkin_single_header,w3c_traceparent.
4. Save, Verify, and Publish the Page
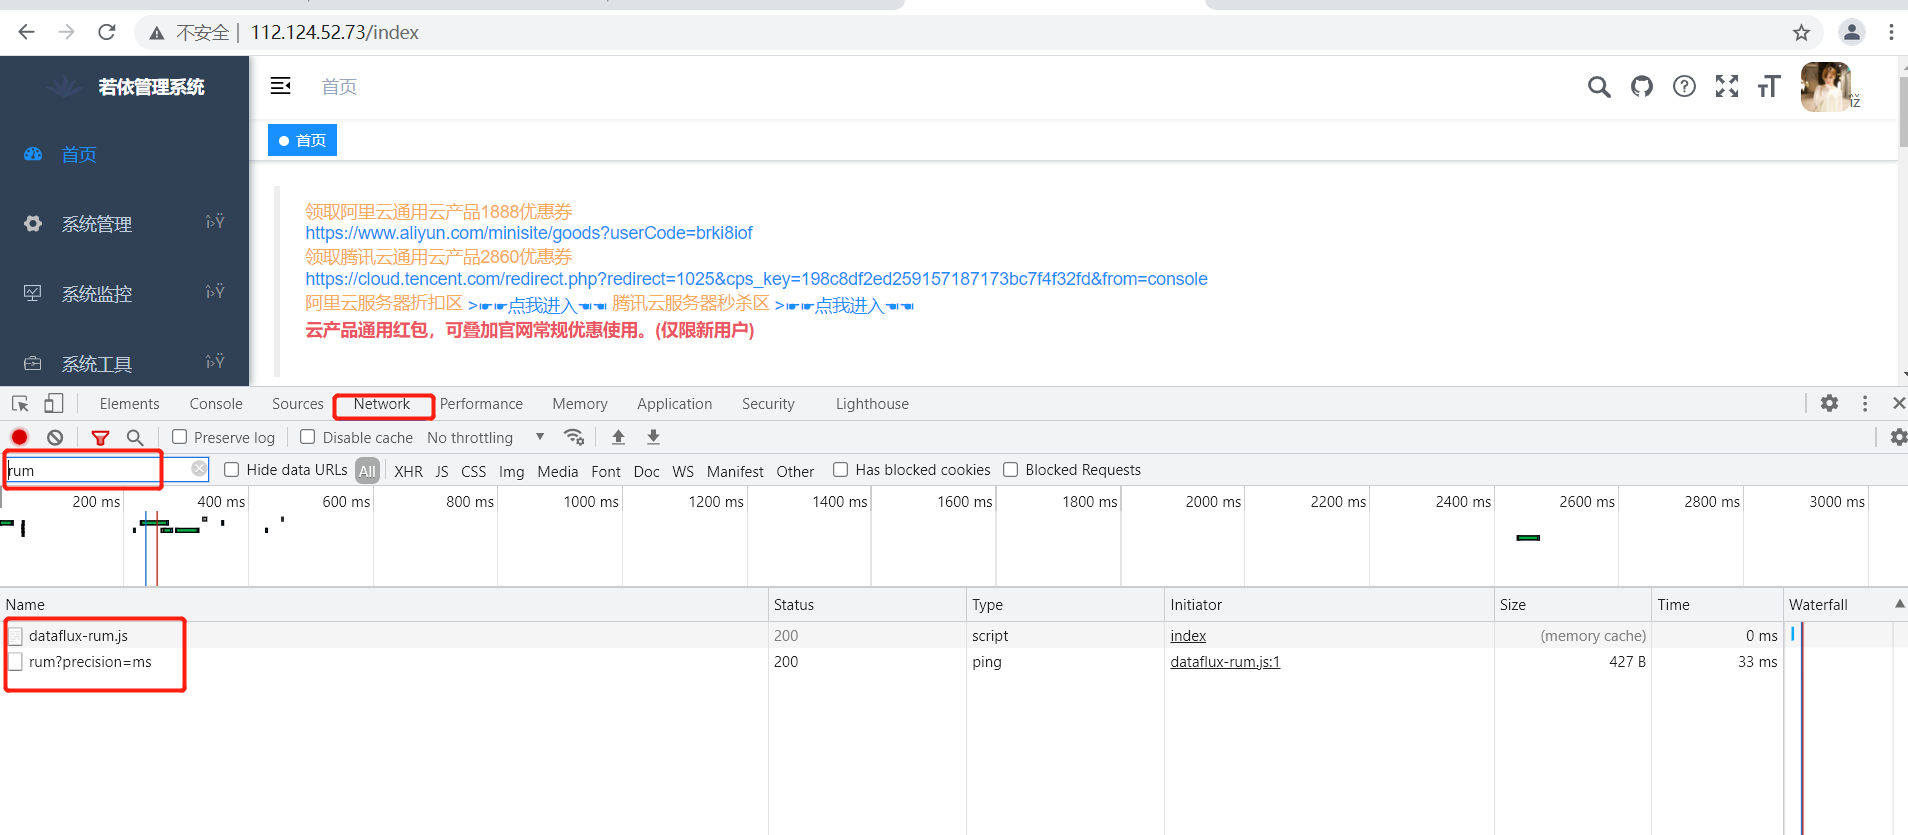
Open the target page in a browser. Use the F12 inspector to check whether there are RUM-related requests in the network requests and whether the status code is 200.
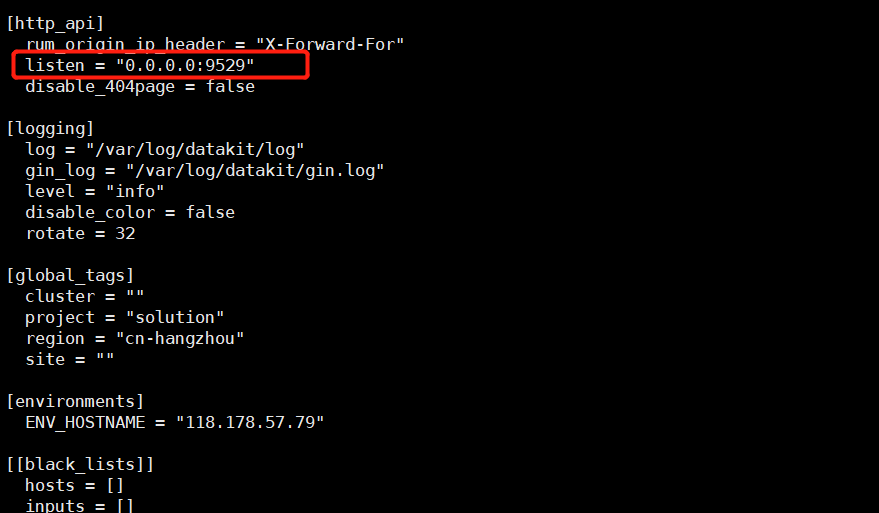
Important Notes: If you find that the status code of an RUM-related request is not 200, or it shows connection refused, you can telnet IP:9529 to verify whether the port is open. If it is not open, modify /usr/local/datakit/conf.d/datakit.conf and change http_listen from localhost to 0.0.0.0 (this configuration controls whether port 9529 on the current server can be accessed from external networks. If set to 127.0.0.1 or localhost, only local or internal network access to port 9529 is allowed. After setting it to 0.0.0.0, both internal and external networks can access port 9529. Since most RUM data comes from external networks, you need to open port 9529 from the external network to the server running DataKit). For example:
RUM and APM Data Integration (Frontend-Backend Correlation via Trace ID)
Prerequisites: The backend application server must have APM monitoring installed, i.e., ddtrace (dd-agent). See Distributed Tracing (APM) Best Practices. The frontend must have df-rum monitoring added.
Configuration method: Add the allowedTracingOrigins tag to the df-rum-js already added to the frontend HTML, and fill in the corresponding backend domain of the frontend. For example, if dataflux.cn is monitored by RUM, you need to configure https://www.dataflux.cn/ in allowedTracingOrigins. If there are multiple domains, configure them separated by commas. Third-party domains do not need to be configured.
Example of the effect after integration:


DF Web Application Monitoring (RUM) Application Analysis
Parameter Description:
| Parameter | Type | Required | Default | Description |
|---|---|---|---|---|
applicationId |
String | Yes | The application ID created from DataFlux | |
datakitOrigin |
String | Yes | The DataKit data upload Origin. Note: 协议(包括://),域名(或IP地址)[和端口号]Example: https://www.datakit.com, http://100.20.34.3:8088 |
|
env |
String | No | The current environment of the web application, e.g., prod: production environment; gray: canary environment; pre: pre-release environment; common: daily environment; local: local environment. |
|
version |
String | No | The version number of the web application | |
resourceSampleRate |
Number | No | 100 |
Percentage of resource metrics data collection: 100means full collection; 0means no collection. |
sampleRate |
Number | No | 100 |
Percentage of metrics data collection: 100means full collection; 0means no collection. |
trackSessionAcrossSubdomains |
Boolean | No | false |
Subdomains under the same domain share the cache |
allowedTracingOrigins |
Array | No | [] |
List of all requests allowed to inject the headers required by the ddtracecollector. Can be the origin of the request or a regular expression. Origin: 协议(包括://),域名(或IP地址)[和端口号]Example: ["https://api.example.com", /https:\\/\\/.*\\.my-api-domain\\.com/] |
trackInteractions |
Boolean | No | false |
Whether to enable user behavior collection |
Core Web Vitals
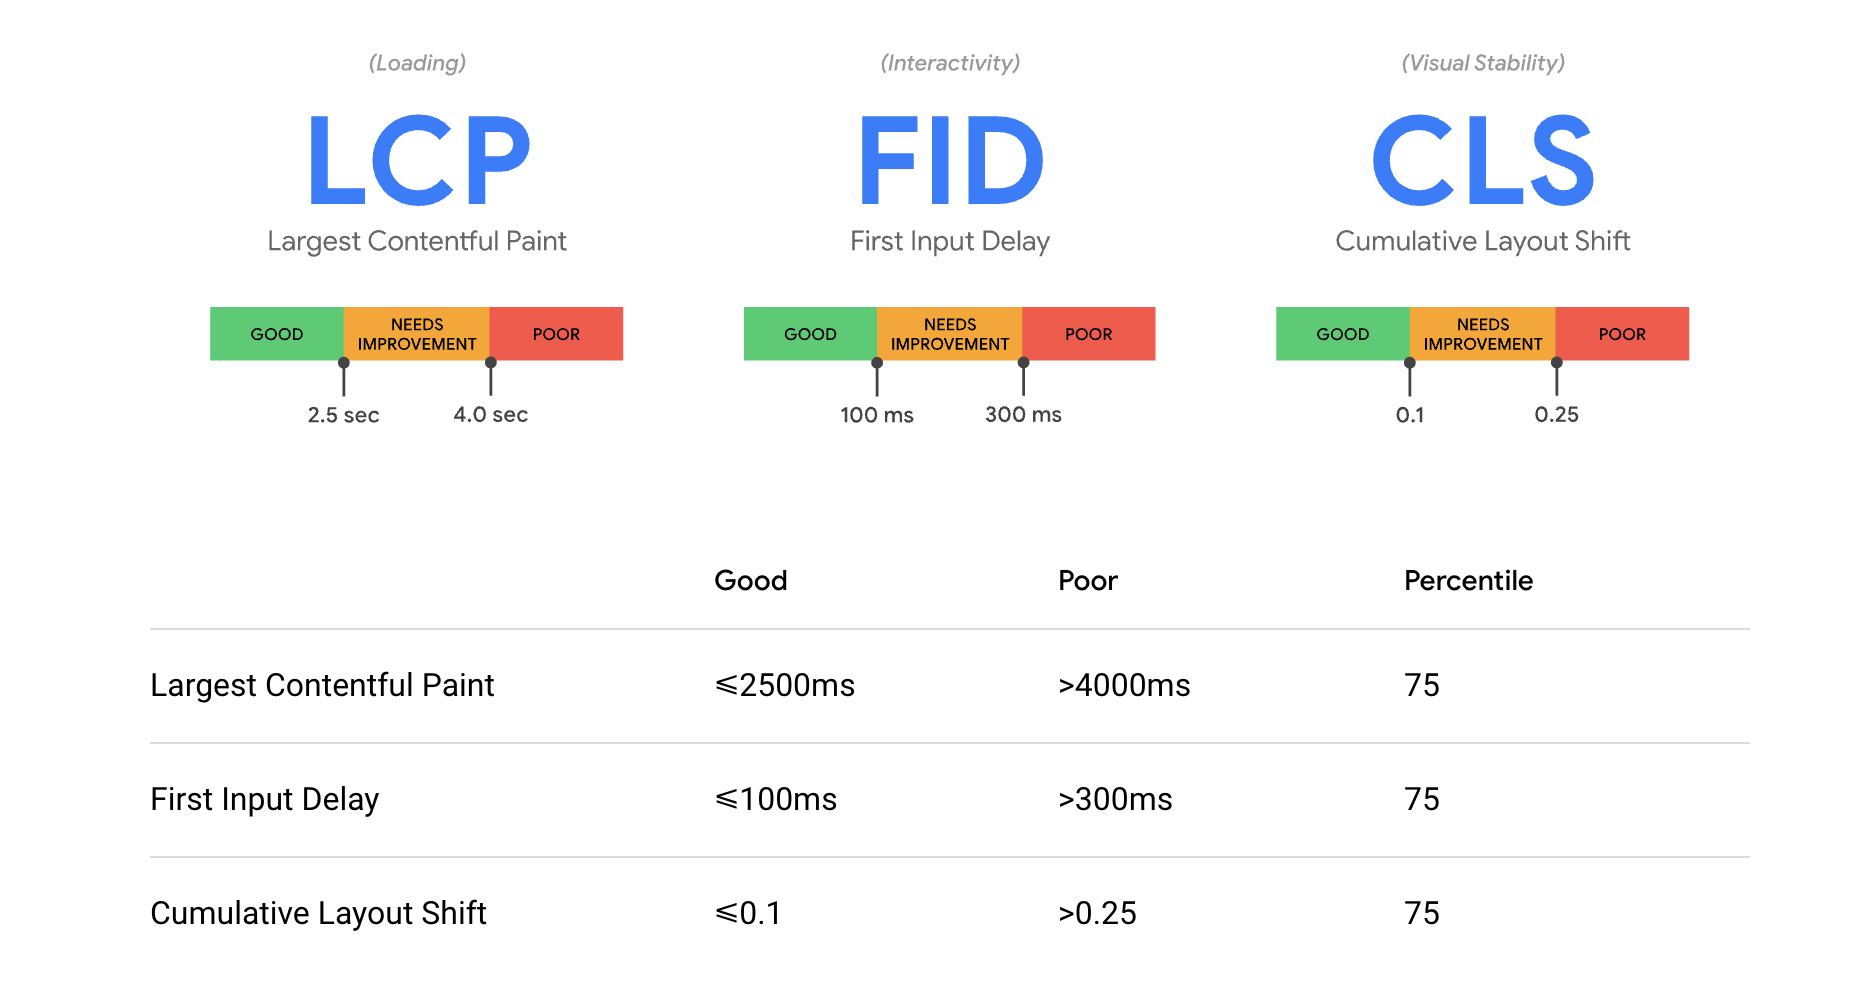
DataFlux Web Application Analysis incorporates Google Core Web Vitals (LCP, FID, CLS) to measure the loading speed, interactivity, and visual stability of web pages.
| Metric | Description | Target Value |
|---|---|---|
| LCP (Largest Contentful Paint) | The time it takes for the largest content element in the viewport to load | < 2.5s |
| FID (First Input Delay) | The delay time when a user first interacts with the page | < 100ms |
| CLS (Cumulative Layout Shift) | Measures how much the page layout shifts during loading due to dynamic content. 0 means no change. | < 0.1 |
Scenario Analysis
DataFlux provides a visual web application analysis with built-in multi-dimensional web application monitoring data scenarios, including Overview, Page Performance Analysis, Resource Loading Analysis, and JS Error Analysis.
Overview
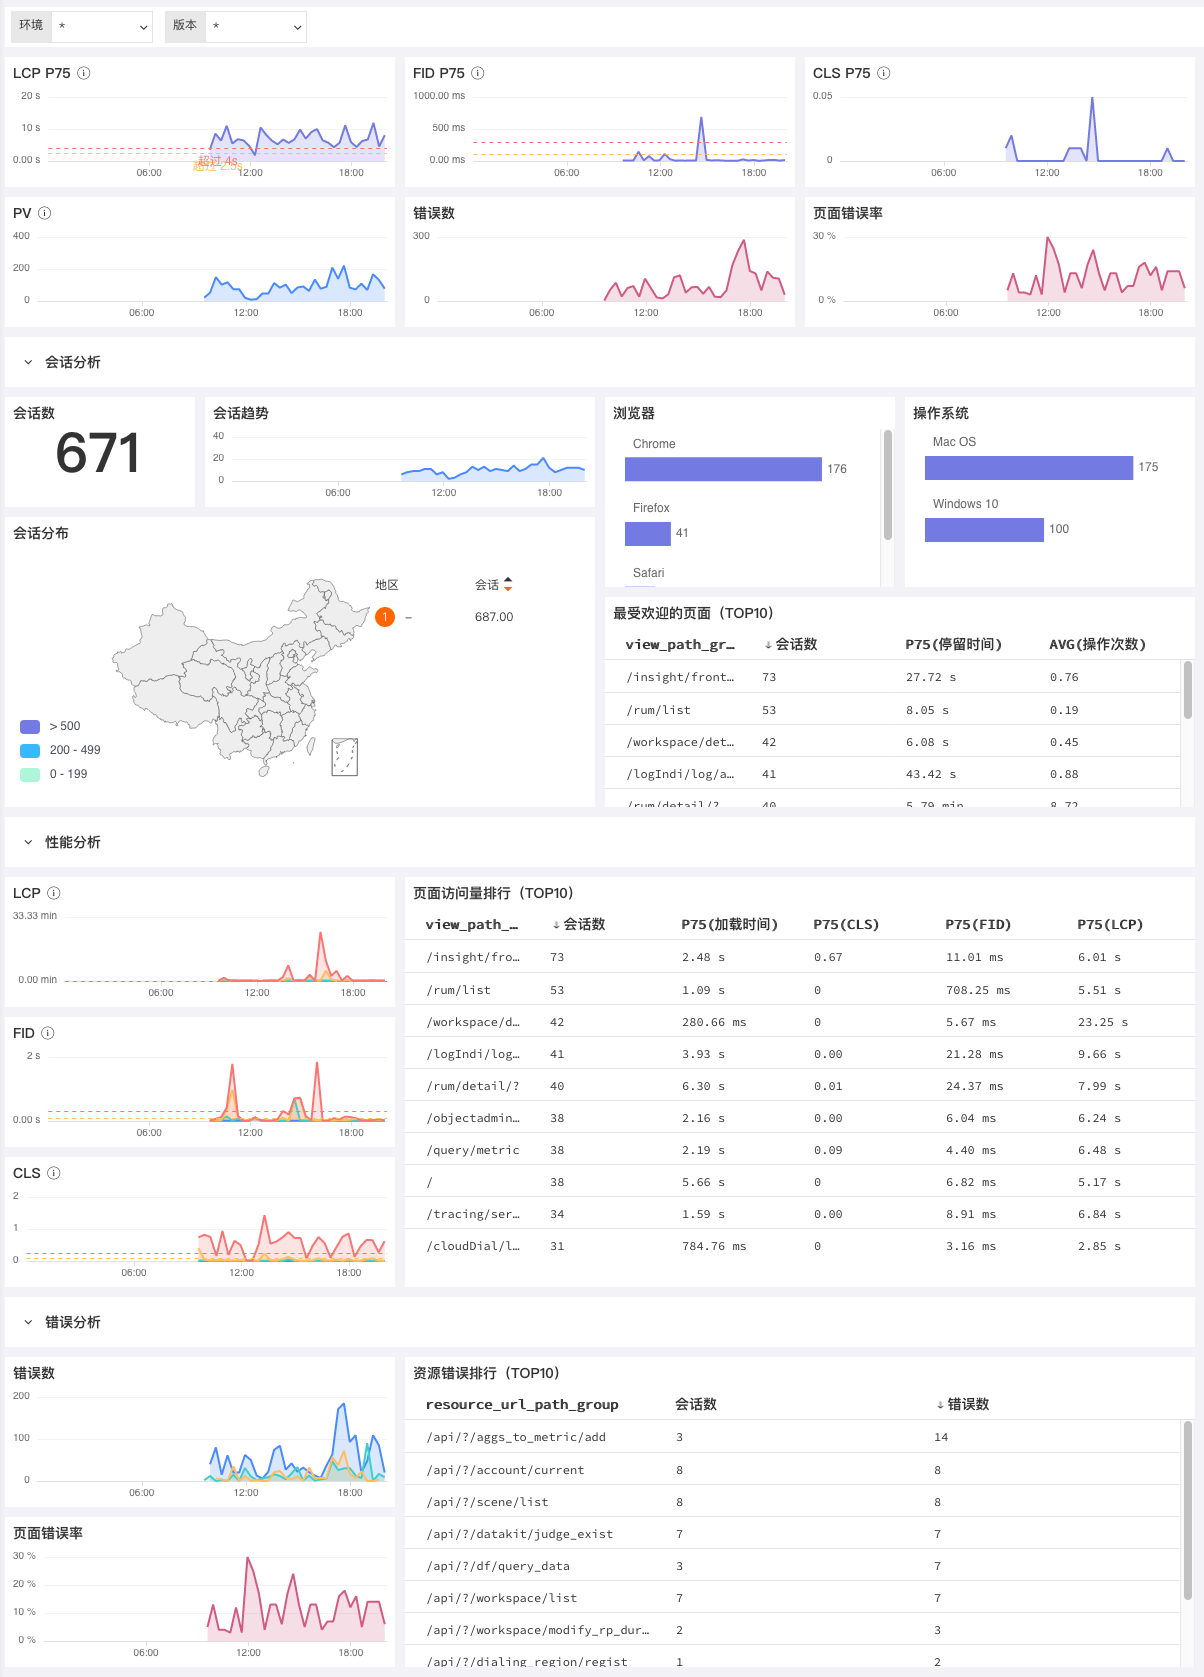
The Overview scenario of the web application counts the number of errors, error rate, number of sessions, session distribution, browser, operating system, most popular pages, resource error rankings, etc. It visually displays the data statistics of user access to the web page, quickly locating problems with user access to the web application and improving user access performance. You can filter by environment and version to view the connected web applications.
Performance Analysis
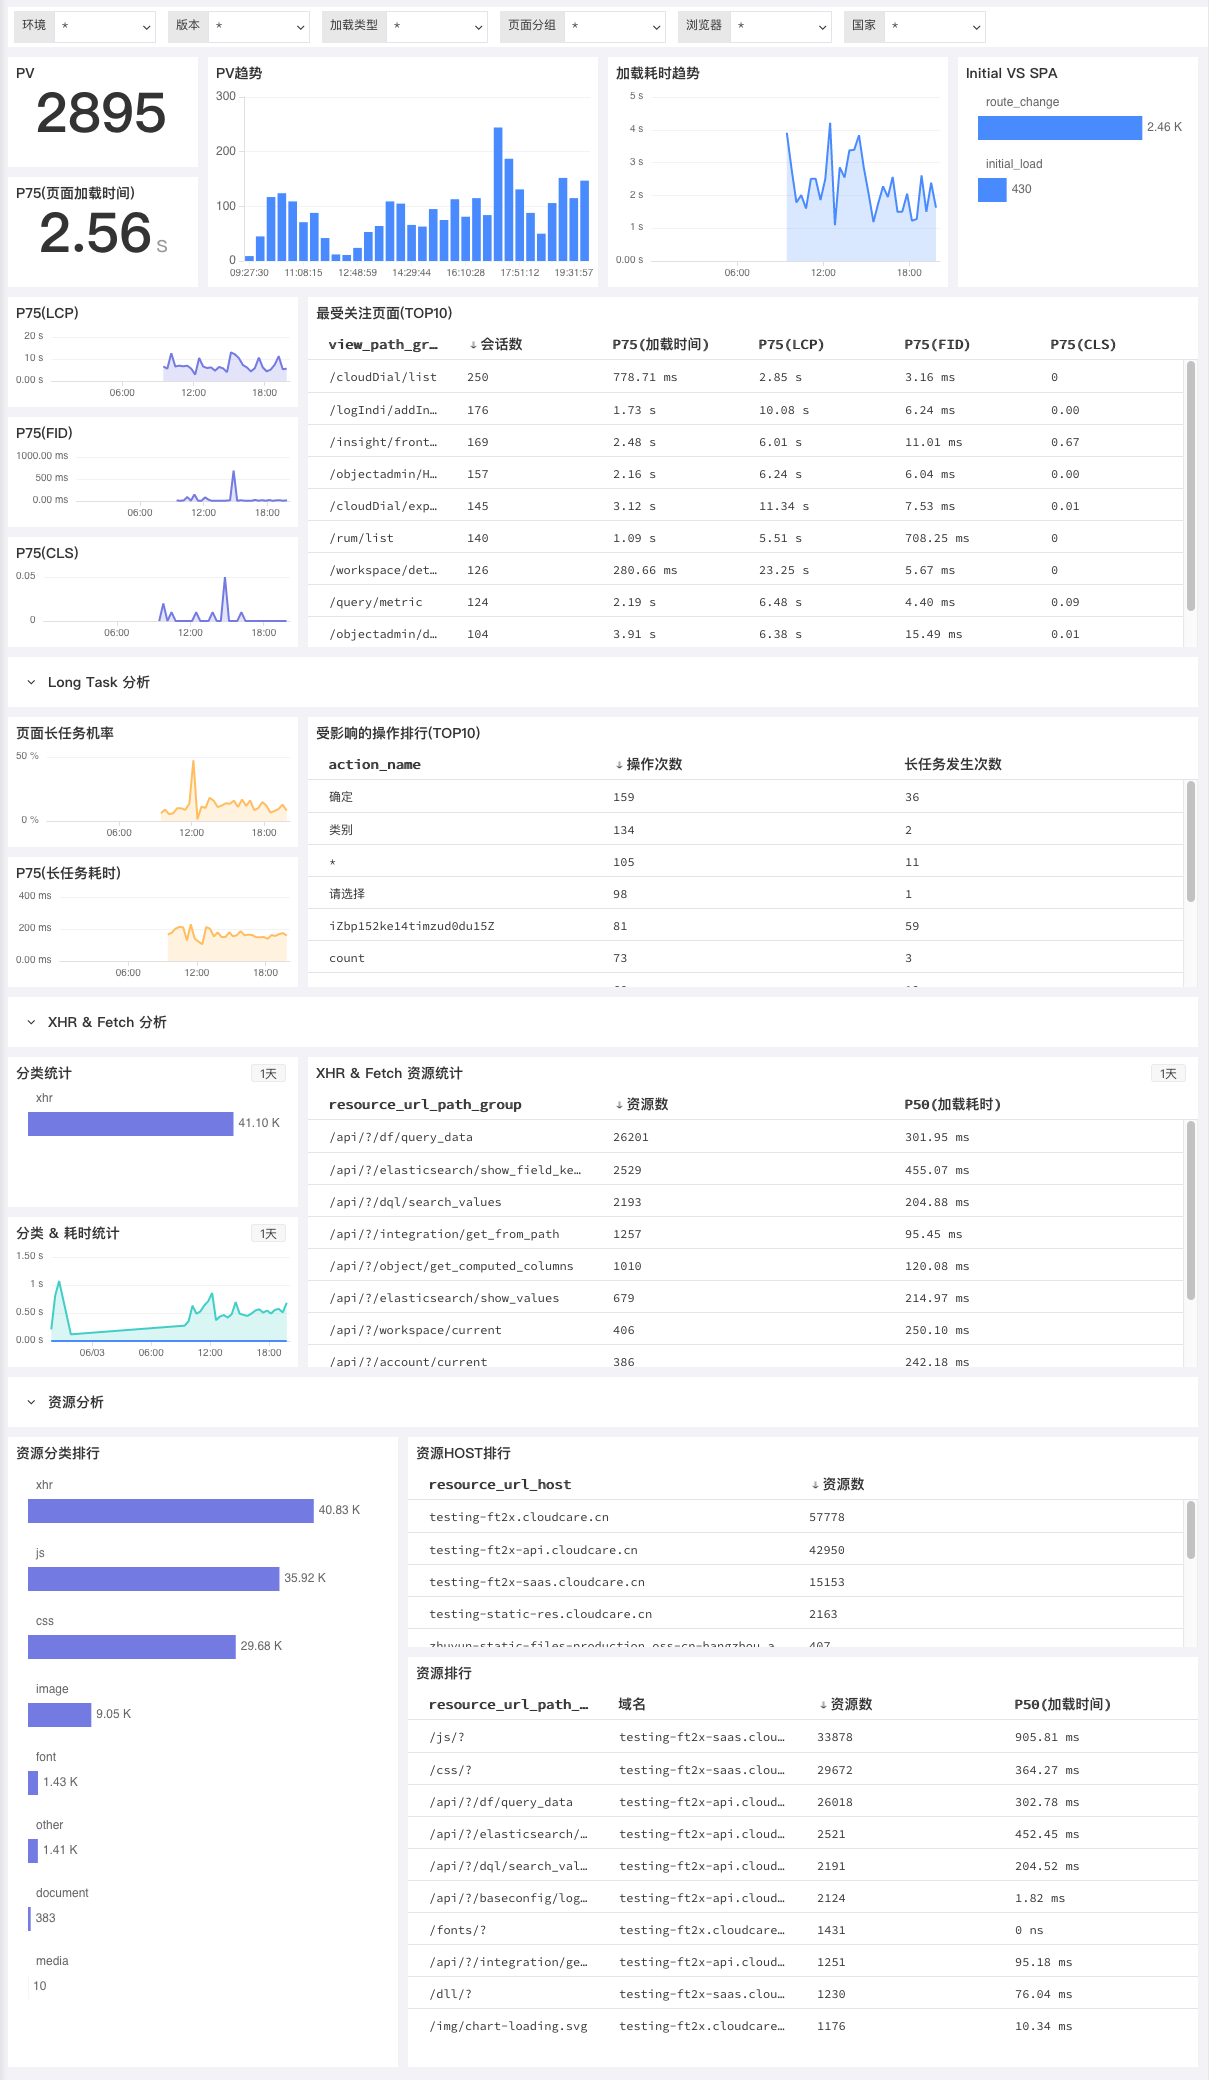
The page performance analysis of the web application uses metrics such as PV count, page loading time, core web vitals, session count of most viewed pages, long task analysis, XHR & Fetch analysis, and resource analysis to visually view the overall web application page performance in real time, more accurately identifying pages that need optimization. You can filter by environment and version to view the connected web applications.
Resource Analysis
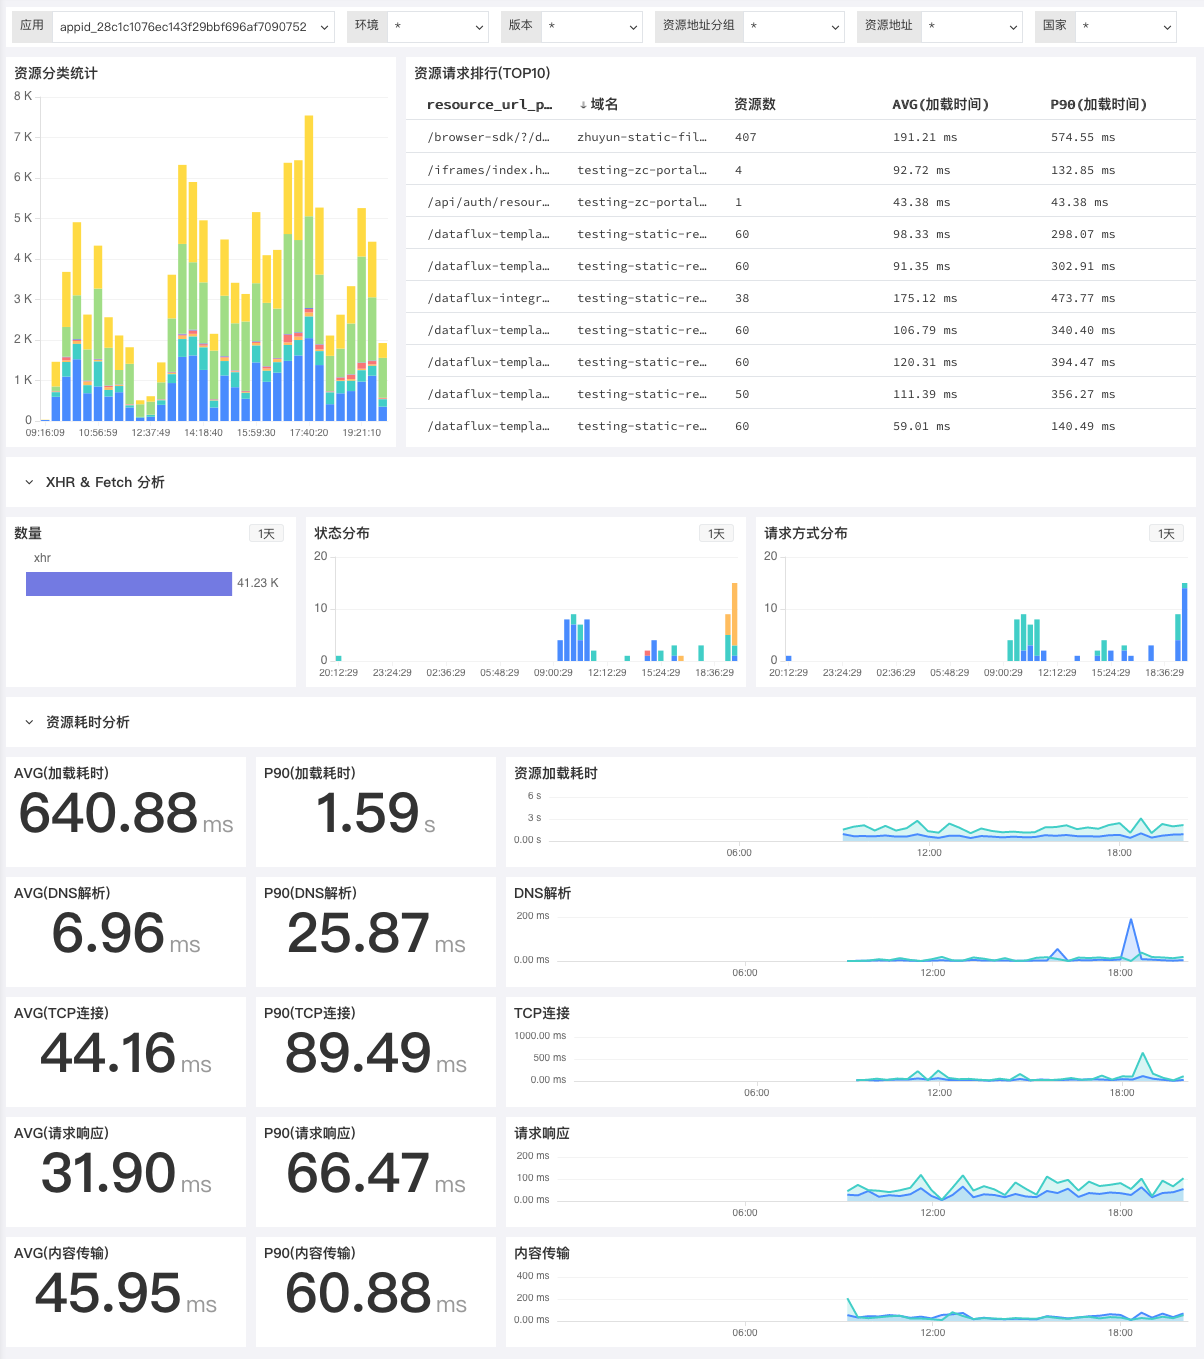
The resource analysis of the web application uses metrics such as resource classification, XHR & Fetch analysis, and resource time consumption analysis to visually view the overall web application resource situation in real time. By analyzing resource request rankings, you can more accurately identify resources that need optimization. You can filter by environment and version to view the connected web applications.
Error Analysis
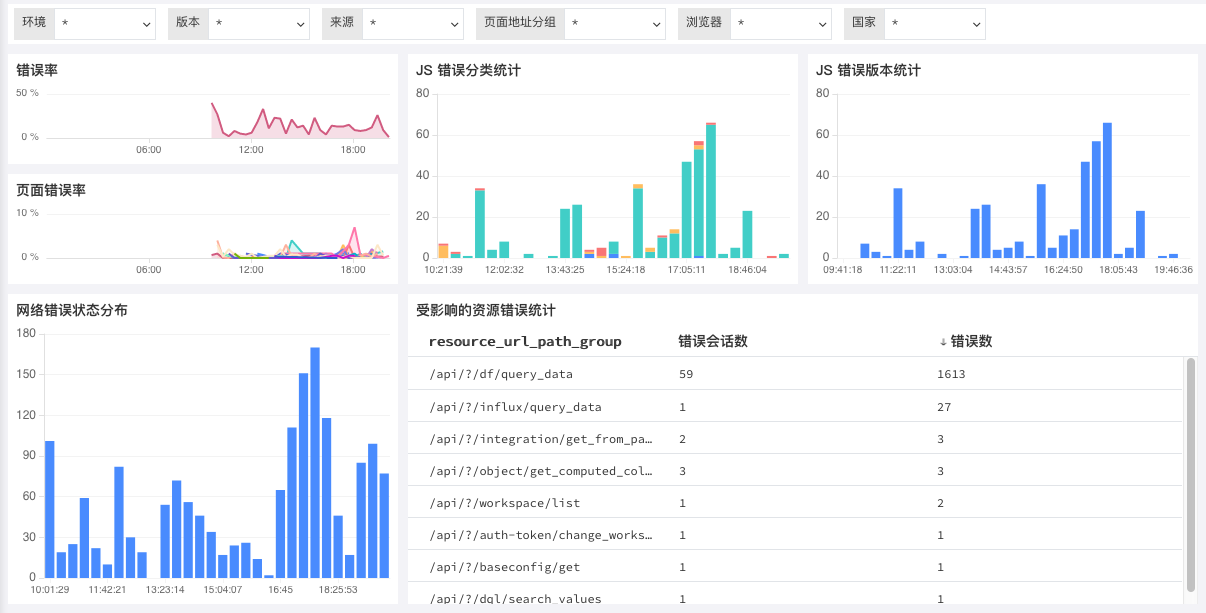
The JS error analysis of the web application uses metrics such as error rate, error classification, error version, and network error status distribution to visually view the overall web application error situation in real time. By analyzing the affected resource error statistics, you can quickly locate resource errors. You can filter by environment and version to view the connected web applications.