ddtrace Common Parameter Usage
Author: Liu Rui
Prerequisites
-
Enable the DataKit ddtrace collector
-
Startup command
java -javaagent:D:/ddtrace/dd-java-agent-guance.jar \
-Ddd.service.name=ddtrace-server \
-Ddd.agent.port=9529 \
-jar springboot-ddtrace-server.jar
Parameter Usage
Enable Query Parameters
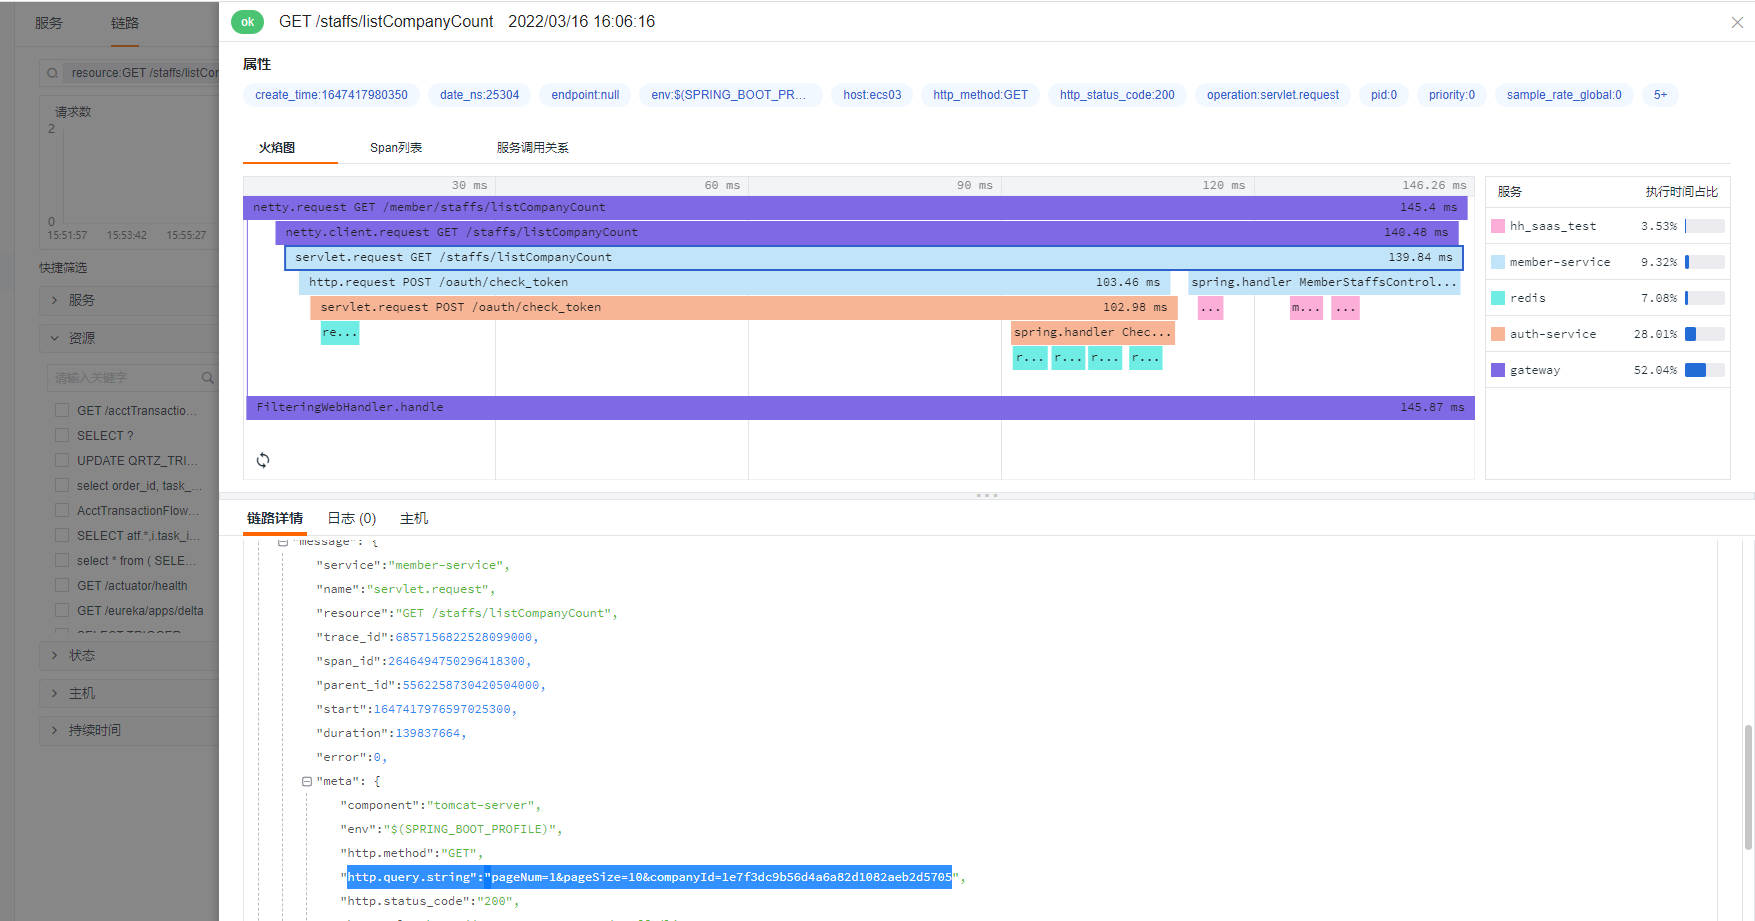
Enabling query parameters allows users to see the parameters carried by the current request more intuitively, providing a clearer picture of the actual user operation flow. The default is false, meaning it is not enabled.
However, enabling query parameters only captures parameters in the URL; parameters in the request body are not currently supported.
Configure Remote Collection Endpoint
The default value of dd.agent.host is localhost, so by default, traces are sent to the local DataKit.
To send traces to a remote DataKit, you need to configure dd.agent.host.
Two Ways to Add Tags
ddtrace provides two ways to add tags, with the same effect. However, the dd.tags method is recommended.
1. dd.trace.span.tags
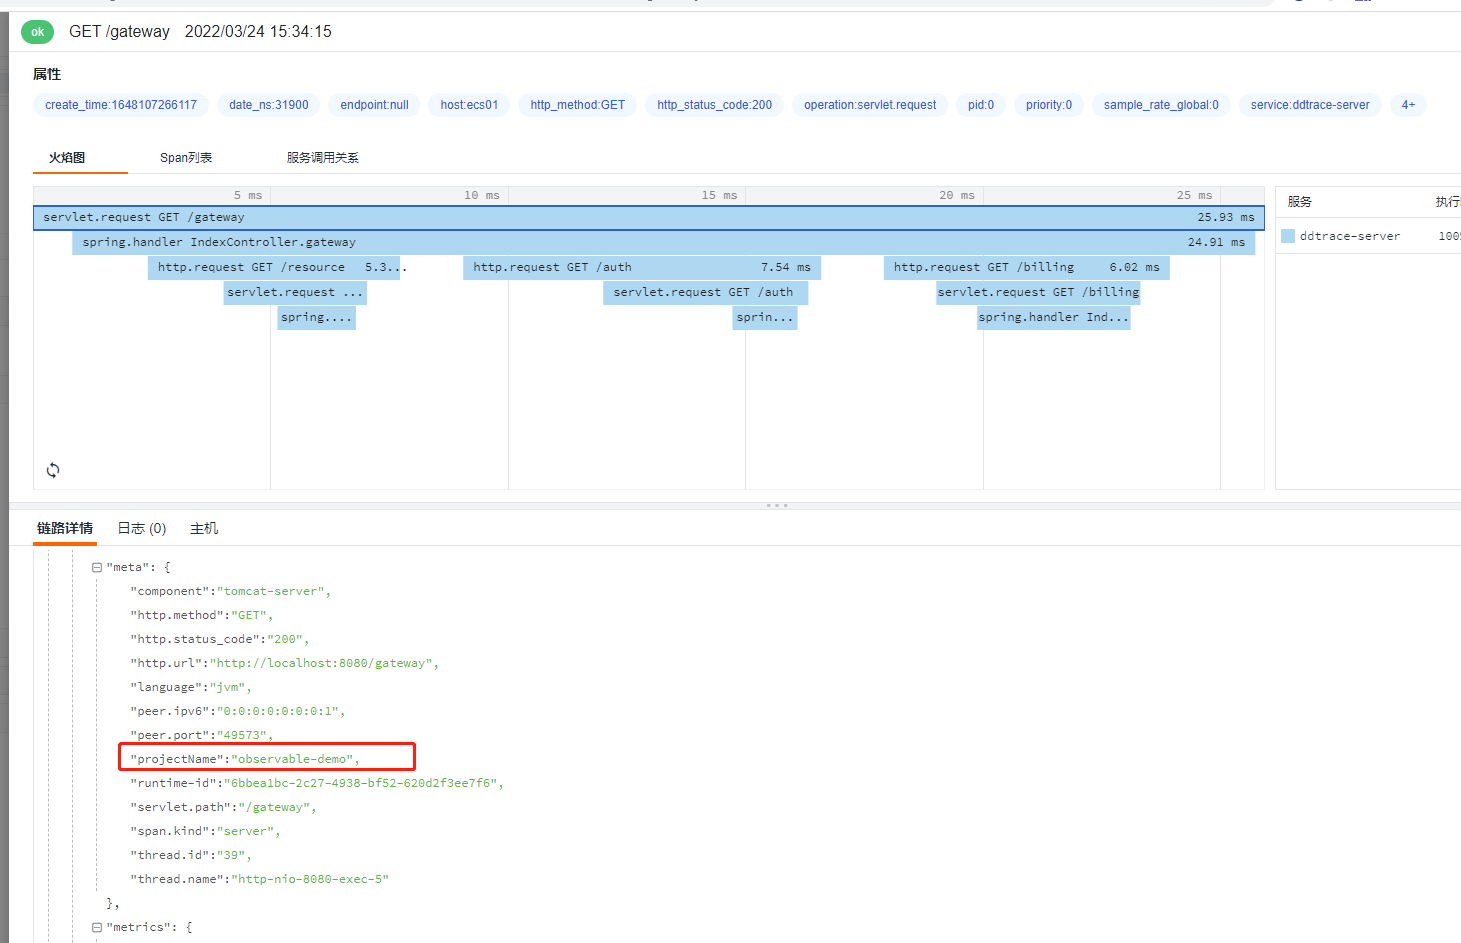
Example of adding projectName:observable-demo to each span:
2. dd.tags

Both methods can generate tags with the same effect, and the data will be displayed in meta.
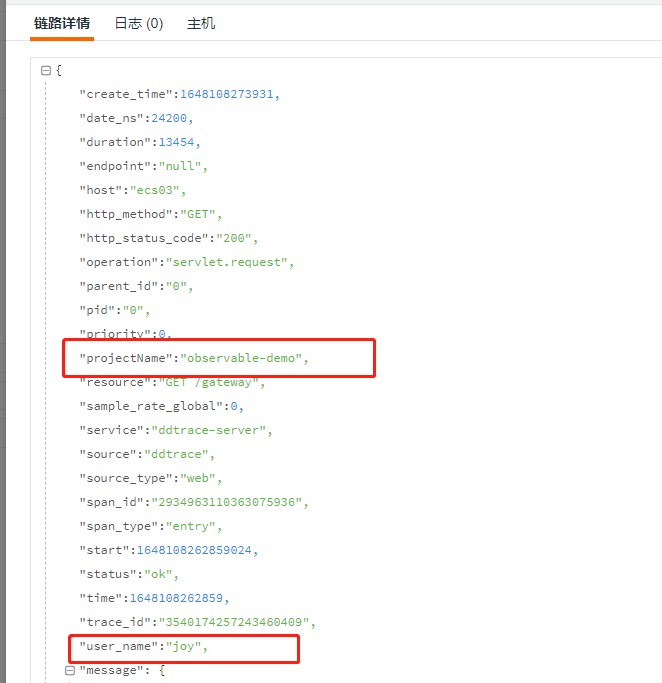
If you want to use the tags marked by dd.tags as Guance labels, you need to configure customer_tags in ddtrace.conf.
    [[inputs.ddtrace]]
      endpoints = ["/v0.3/traces", "/v0.4/traces", "/v0.5/traces"]
      customer_tags = ["projectName","user_name"]
Effect:
Display Database Instance Name
Displays the database name; by default, the database type is displayed. To display the database name, set the value to TRUE.
The above demo does not load a database, so to achieve this effect, you can choose an application that uses a database and add the parameter.
Effect:

Inject Trace into Classes or Methods
ddtrace supports injecting Trace into methods. By default, ddtrace injects Trace into all API endpoints.
If you want to mark non-API classes (methods) — some important classes and methods — you can configure the dd.trace.methods parameter.
- Environment Variable: DD_TRACE_METHODS
- Default: null
- Example: package.ClassName[method1,method2,...];AnonymousClass$1[call];package.ClassName[*]
List of class/interface and methods to trace. Similar to adding @Trace, but without changing code. - Note: The wildcard method support ([*]) does not accommodate constructors, getters, setters, synthetic, toString, equals, hashcode, or finalizer method calls
For example, to add Trace to the getDemo method of the com.zy.observable.ddtrace.service.TestService class:
Partial code example:
    @Autowired
    private TestService testService;

    @GetMapping("/gateway")
    @ResponseBody
    public String gateway(String tag) {
        String userId = "user-" + System.currentTimeMillis();
        MDC.put(ConstantsUtils.MDC_USER_ID, userId);
        logger.info("this is tag");
        sleep();
        testService.getDemo();
        httpTemplate.getForEntity(apiUrl + "/resource", String.class).getBody();
        httpTemplate.getForEntity(apiUrl + "/auth", String.class).getBody();
        if (client) {
            httpTemplate.getForEntity("http://"+extraHost+":8081/client", String.class).getBody();
        }
        return httpTemplate.getForEntity(apiUrl + "/billing?tag=" + tag, String.class).getBody();
    }
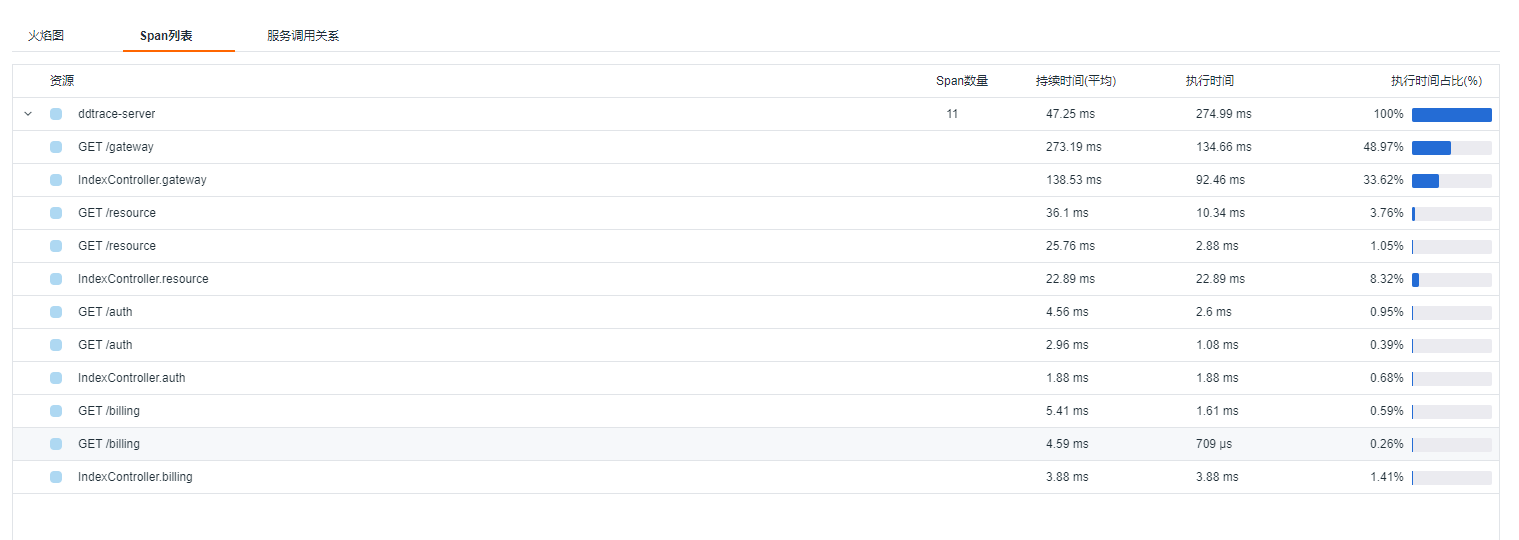
Without the dd.trace.methods parameter, 11 spans are reported, as shown below:
Custom Business Tags via Headers
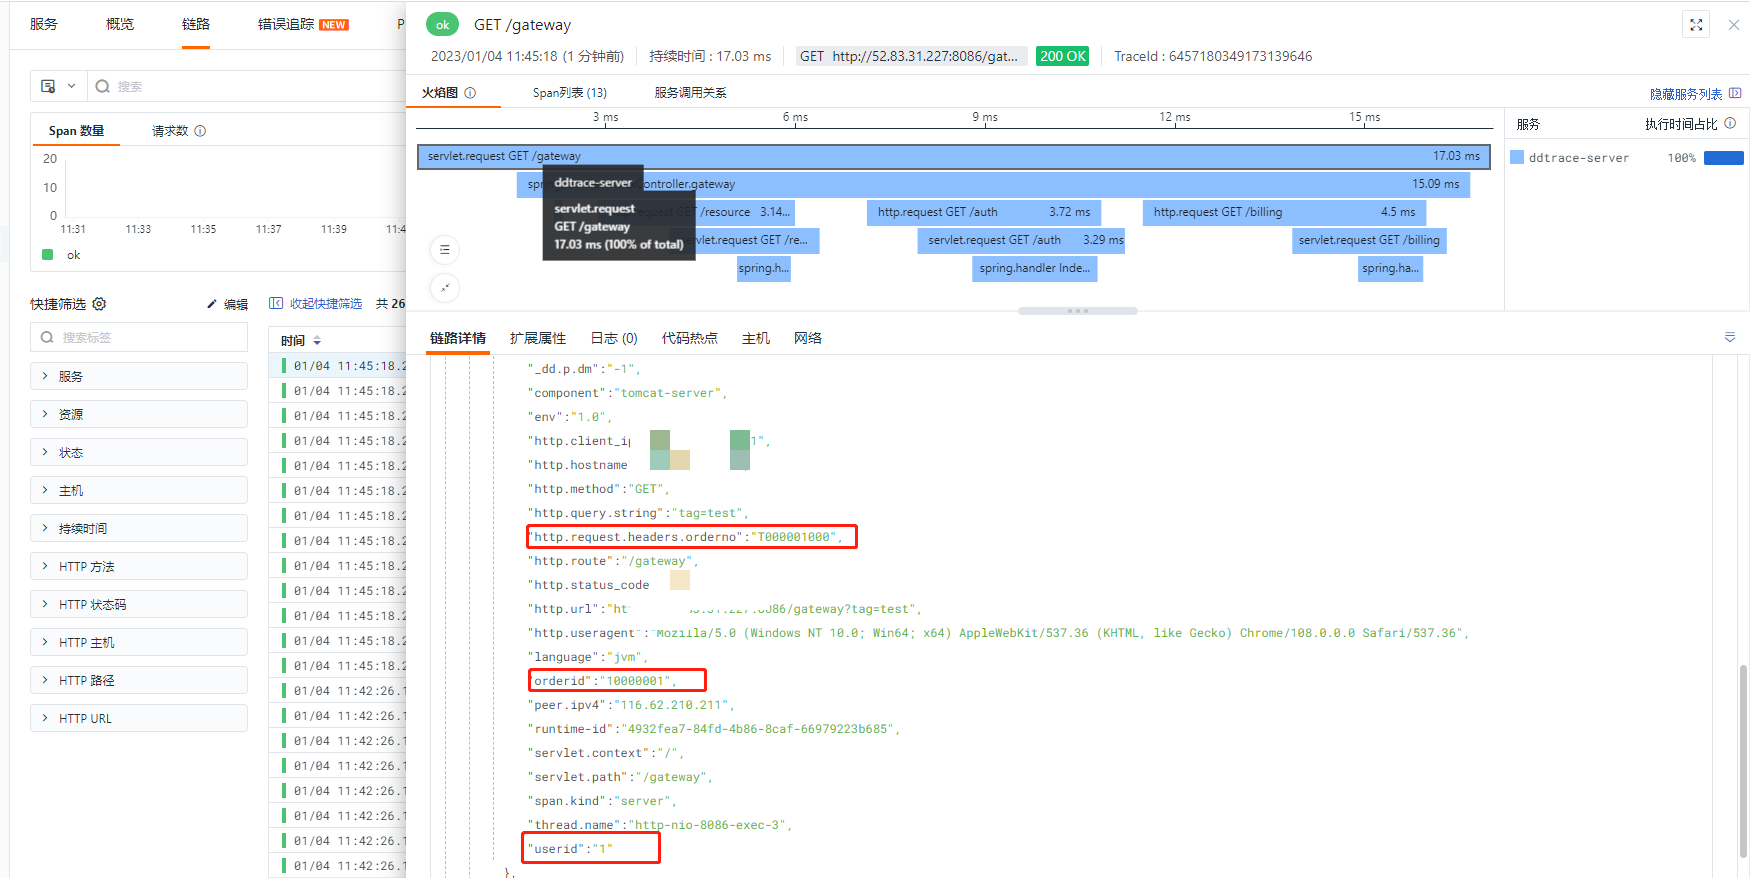
This mainly uses headers to inject business tags into traces in a non-intrusive way, allowing you to track the execution of corresponding business operations. Configure in the format Key:value, where the key is the original header paramName and the value is the rename of the key. The key can be omitted.
Request
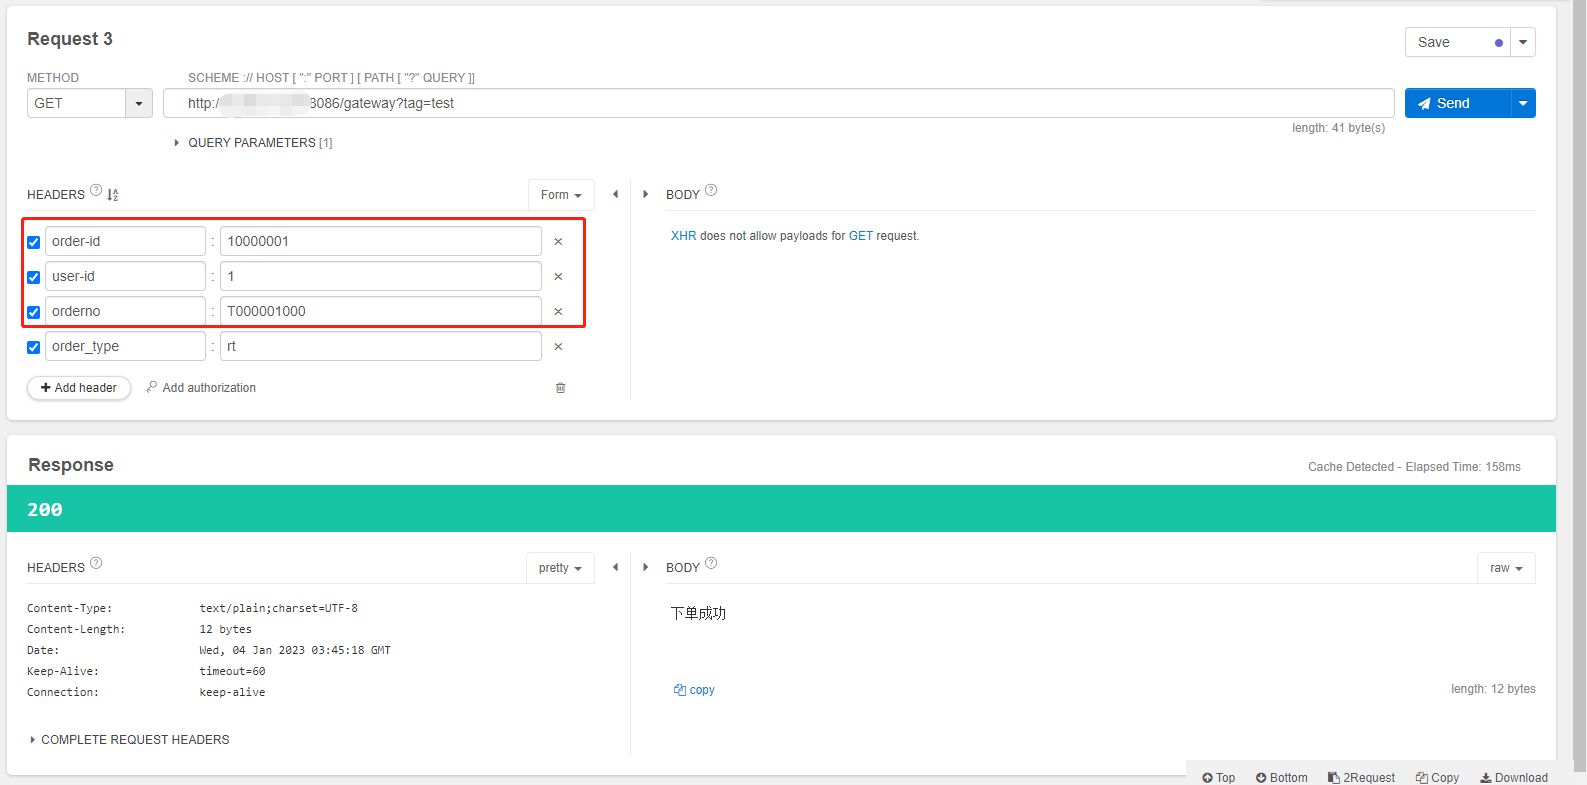
Trace effect:
Baggage: Unlimited Propagation of Tags
Environment Variable: DD_TRACE_HEADER_BAGGAGE
Default: null
Example: CASE-insensitive-Header:my-baggage-name,User-ID:userId,My-Header-And-Baggage-Name
For example:
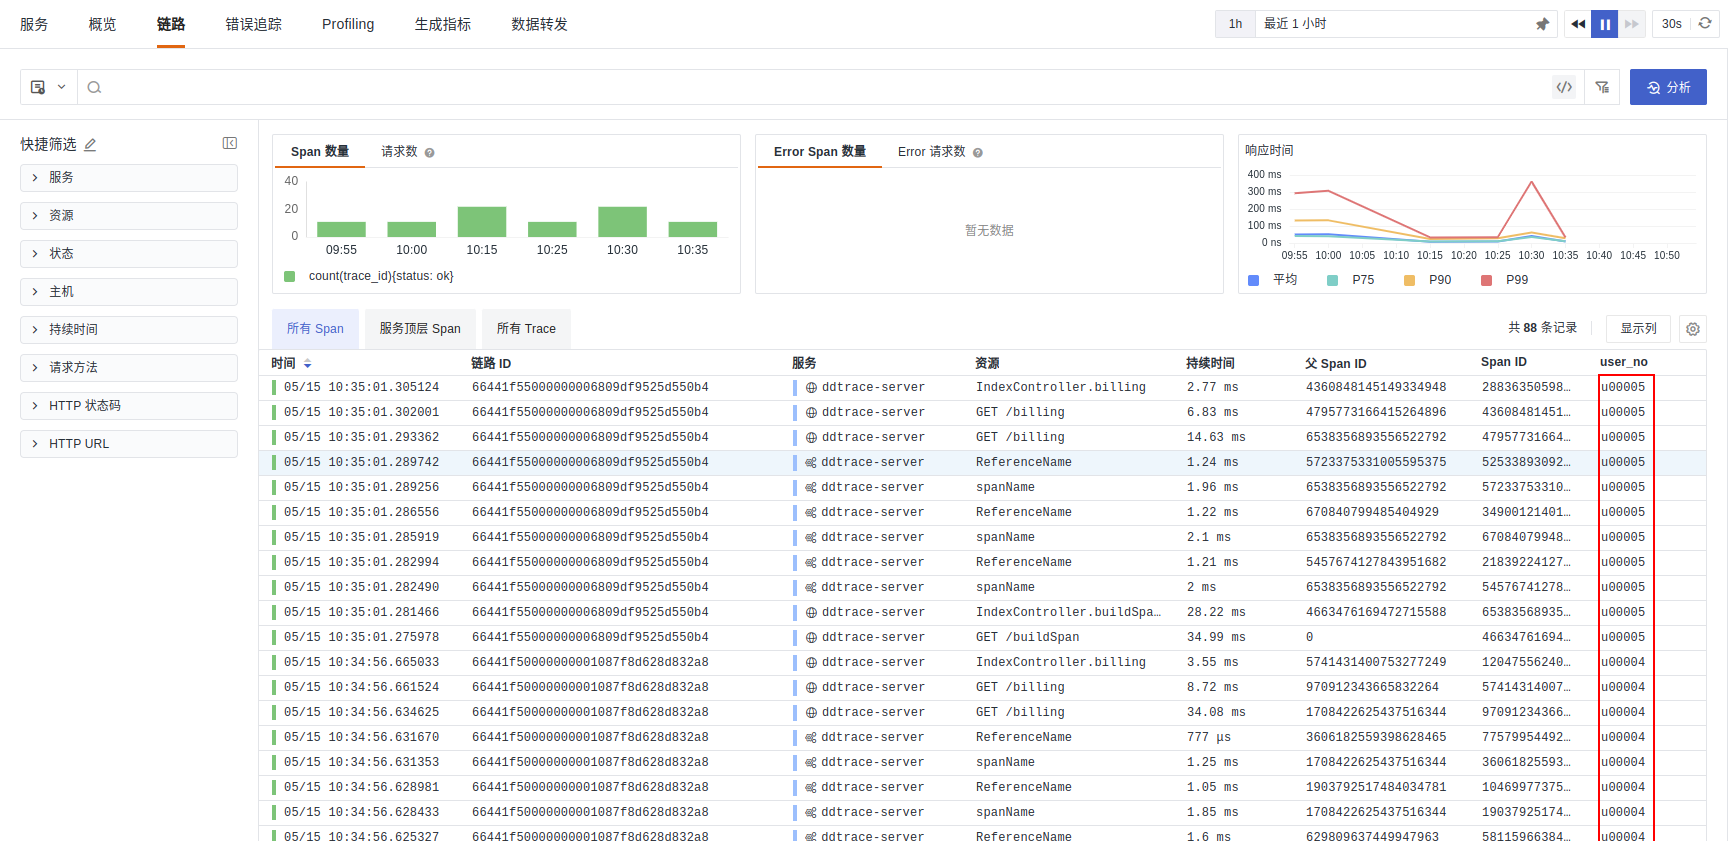
-Ddd.trace.header.tags does not achieve propagation. Baggage allows unlimited propagation of header tags.
Trace effect:
Enable Debug Mode
Enabling debug mode outputs ddtrace-related logs, which helps in troubleshooting ddtrace issues.
By default, debug logs are output to stdout. To output to a file, you need to use the following parameter:
Note
-Ddd.trace.debug=true is used to enable ddtrace debug logs, not to enable the application's debug logs.
Enable 128-bit Trace ID
The trace ID is 64 bits (long type) by default. To better support OpenTelemetry (which uses 128-bit trace IDs), you can manually enable 128-bit trace IDs.
Output Trace Information
If you need to do development-related work, understanding the trace data structure is necessary. By default, trace information is reported to the remote observability platform via DDAgentWriter. To output the information to the console, you can configure the following parameters:
You can also configure multiple:
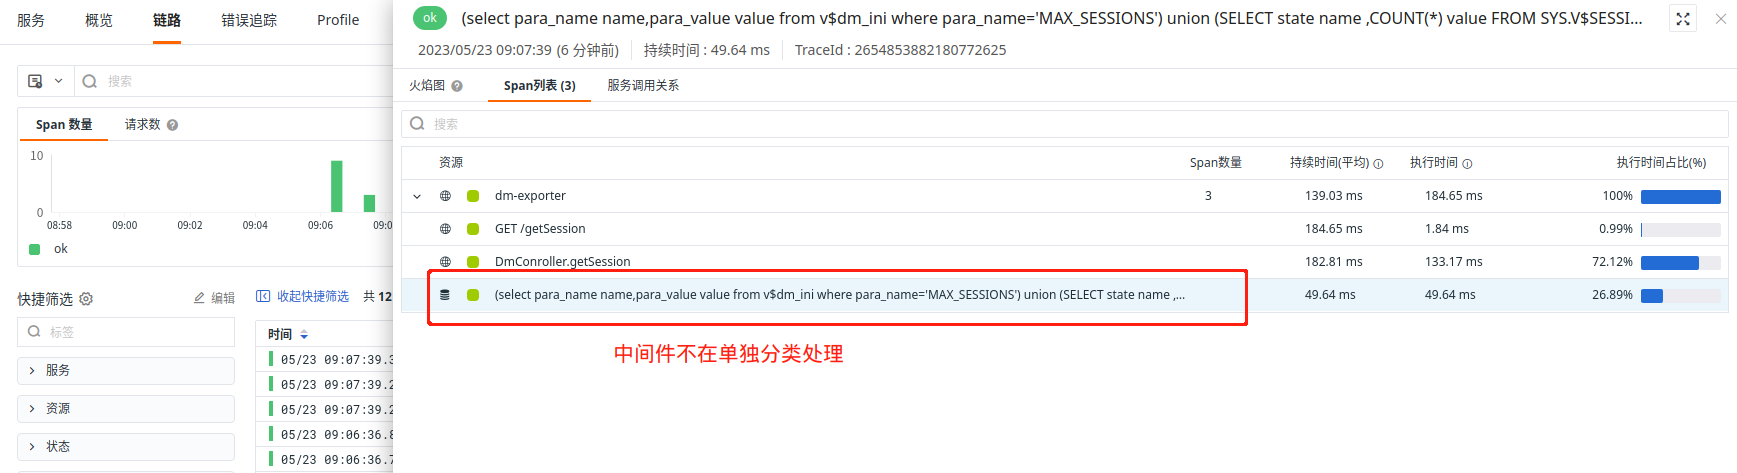
Enable Service Name to Replace Middleware Name
By default, trace information is grouped by middleware name. If the application only has middleware-generated trace information, it cannot be traced back to the application where the middleware resides. You can adjust the parameter to use the global tag service name as the middleware's service. Configure with the following parameters:
Inject via startup parameter:
Or via environment variable:
Effect: The middleware service name is no longer displayed (the application service name replaces the middleware name). Other span tags and data are unaffected.
Before replacement:
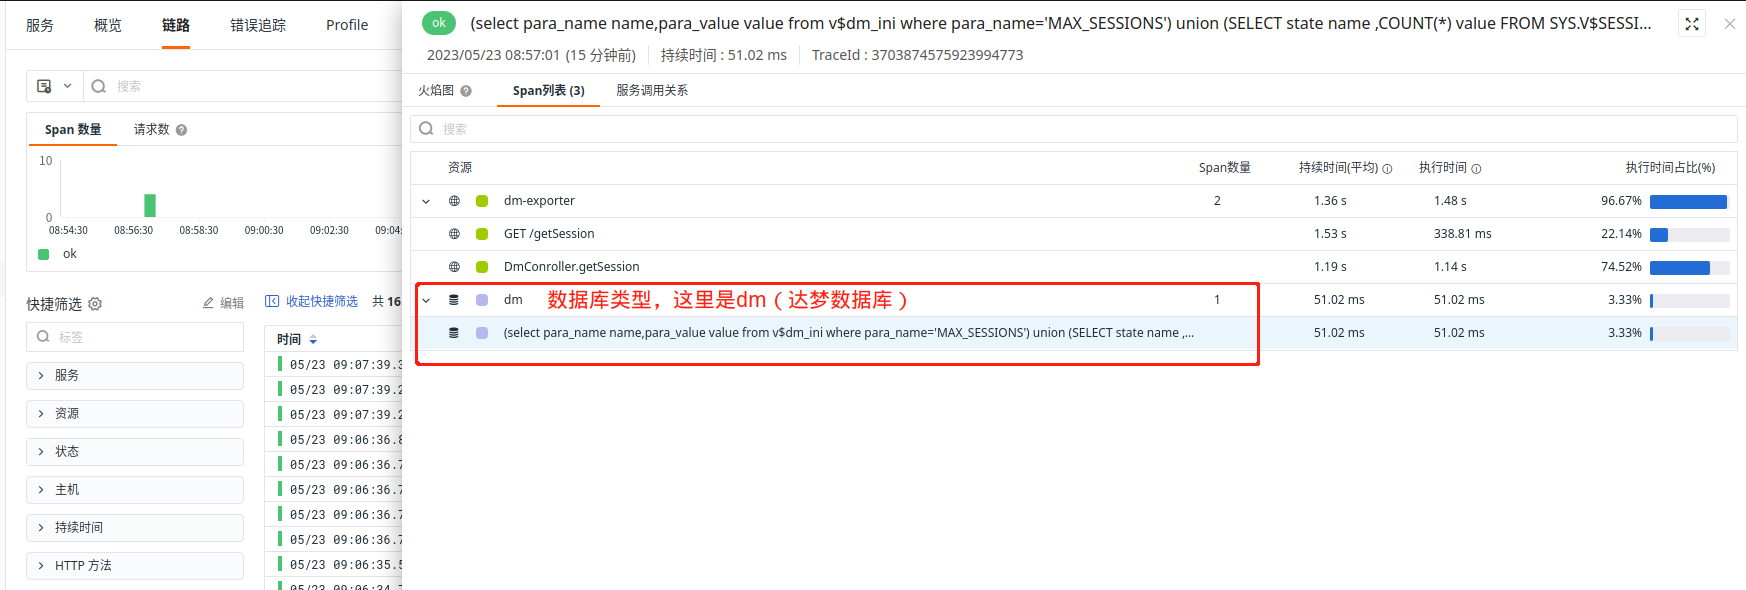
After replacement:
Propagator Configuration
ddtrace supports the following propagators. Propagator types are case-insensitive.
- Datadog: default propagator
- B3: B3 propagation is a specification for headers
b3and headers starting withx-b3-. These headers are used for trace context propagation across service boundaries. B3 has two modes:- B3SINGLE (B3_SINGLE_HEADER), with the corresponding header key
b3 - B3 (B3MULTI), with the corresponding header key
x-b3-
- B3SINGLE (B3_SINGLE_HEADER), with the corresponding header key
- haystack
- tracecontext: default propagator
- xray: AWS propagator
Or configure the environment variable:
Before ddtrace 1.9.0, use:
or
Note: Multiple propagators can be configured, separated by commas. Propagator types are case-insensitive.
For more information on propagators, refer to Link Propagation (Propagate) Mechanism and Use Cases
Response Returns Trace ID
This does not require additional configuration. After the request response is complete, a header with the key guance_trace_id is appended.
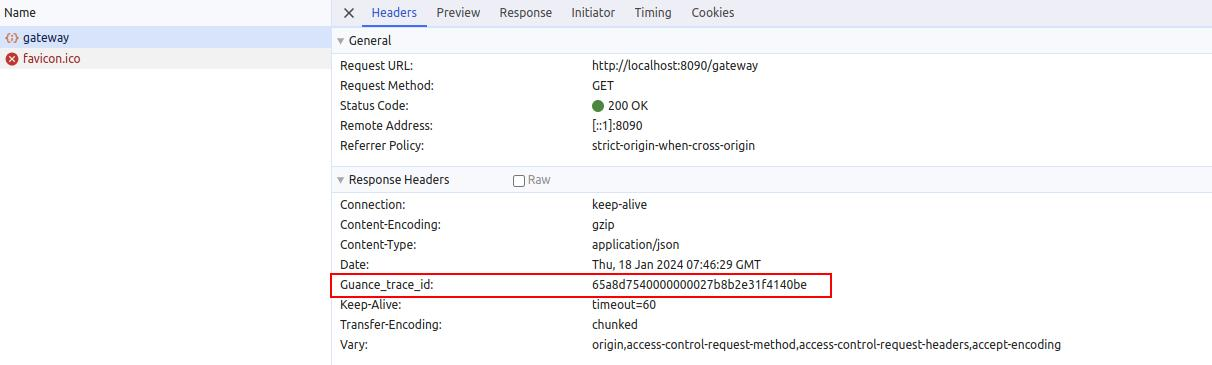
 version >= 1.25.1-guance
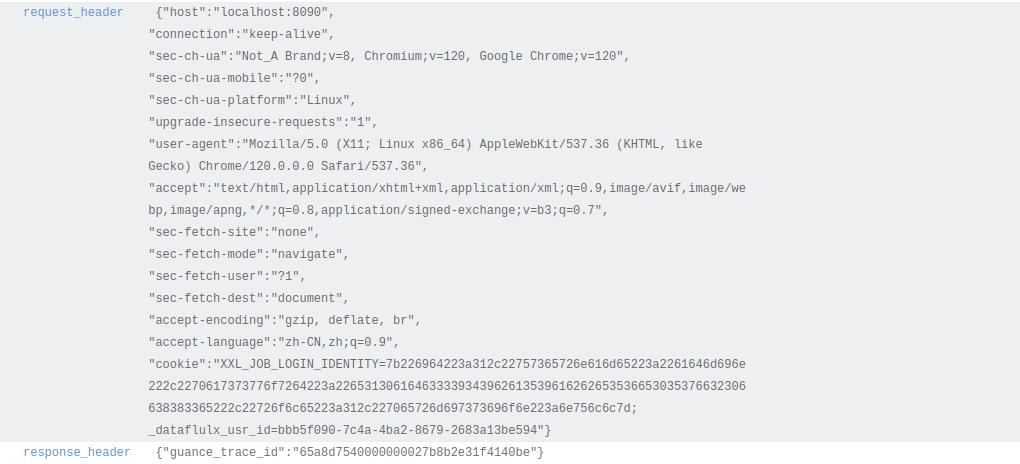
Header Tags
Adds all headers from the request and response to span tags. The tag name for request headers is request_header, and the tag name for response headers is response_header. Enable it using one of the following two methods:
- Startup command:
-Ddd.trace.headers.enabled: default value is false, meaning not enabled.
- Environment variable:
DD_TRACE_HEADERS_ENABLED
| Component | ddtrace Version |
|---|---|
| javax.servlet | >=1.25 |
| jakarta.servlet | >=1.42.9 |
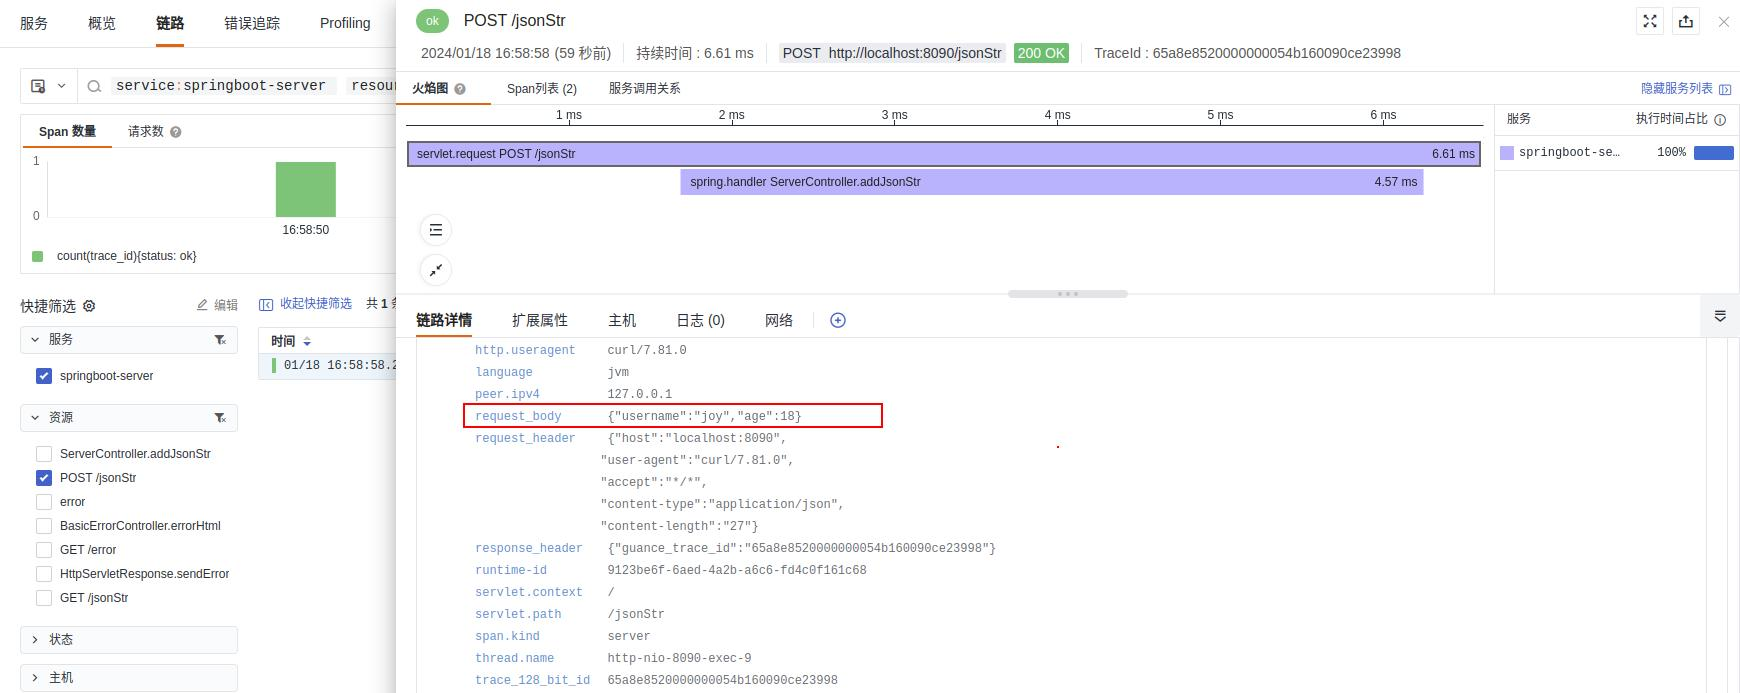
Request Body Tag
Adds the request body to span tags. Currently, only POST requests with Context-Type of application/json or application/json;charset=UTF-8 are supported.
- Startup command:
-Ddd.trace.request.body.enabled: default value is false, meaning not enabled.
- Environment variable:
DD_TRACE_REQUEST_BODY_ENABLED
For example, execute the following request:
curl -X POST -H 'Content-Type: application/json' -d '{"username":"joy","age":18}' http://localhost:8090/jsonStr
| Component | ddtrace Version |
|---|---|
| javax.servlet | >=1.25 |
| jakarta.servlet | >=1.42.9 |
Response Body Tag
Adds the response body content to span tags. Supports application/json and text/plain data types.
- Startup command:
-Ddd.trace.response.body.enabled: default value is false, meaning not enabled.
- Environment variable:
DD_TRACE_RESPONSE_BODY_ENABLED
Reading the response body consumes some Java memory. It is recommended to add a blacklist for requests with large response bodies (e.g., file download endpoints) to prevent OOM. URLs on the blacklist will not have their response body content parsed.
Blacklist configuration:
- Parameter method:
-Ddd.trace.response.body.blacklist.urls="/auth,/download/file"
- Environment variable method:
DD_TRACE_RESPONSE_BODY_BLACKLIST_URLS
| Component | ddtrace Version |
|---|---|
| javax.servlet | >=1.42 |
| jakarta.servlet | >=1.42.9 |
