How to Trace Complete Class Method Calls with APM
Typically, after APM is integrated into an application, you can trace call relationships between application components and services, such as Tomcat, Redis, and MySQL. This is because APM instruments standard components to better observe the impact of component calls on the application during actual use.
In real production environments, non-standard code—i.e., business code—often has a deeper impact on the business. Different developers have varying levels of code understanding and coding skills. For business code, tracing complete class method calls and pinpointing the root cause of problems remains critical.
Fortunately, APM developers are also well-trained engineers who understand these challenges, and they have set higher expectations for APM. DataDog and OpenTelemetry provide relevant features, so let's take a closer look.
Using Java as an example, we explore DDTrace (DataDog) and OpenTelemetry.
How to Trace Method Calls with DDTrace
Prepare a code snippet:
    @Autowired
    private TestService testService;

    @GetMapping("/user")
    @ResponseBody
    public String getUser(){
        logger.info("do getUser");
        return testService.users();
    }
Service interface:
Service implementation class:
package com.zy.observable.server.service;

import org.springframework.stereotype.Component;

import java.util.HashMap;
import java.util.Map;

@Component
public class TestServiceImpl implements TestService {
    private static final Logger logger = LoggerFactory.getLogger(TestServiceImpl.class);
    public String getUsername(){
        return "lr";
    }

    public String users(){
        Map<Integer,Student> users =new HashMap<>();
        users.put(1,new Student("tom",18));
        users.put(2,new Student("joy",20));
        users.put(3,new Student("lucy",30));
        users.forEach((k,v)->print(k,v));
        return getUsername();
    }

    public void print(Integer level,Student student){
        logger.info("level:{},username:{}",level,student.getUsername());
    }
}
When the Controller layer calls testService.users(), by default, users is not included as part of the trace. Run the application with the following command:
java -javaagent:D:/ddtrace/dd-java-agent-1.25.2-guance.jar \
-Ddd.service=springboot-server \
-Ddd.env=1.0 \
-Ddd.agent.port=9529 \
-jar springboot-server.jar
Alternatively, you can debug it in an IDE.
Request http://localhost:8090/user. The result in the Guance platform is shown below:
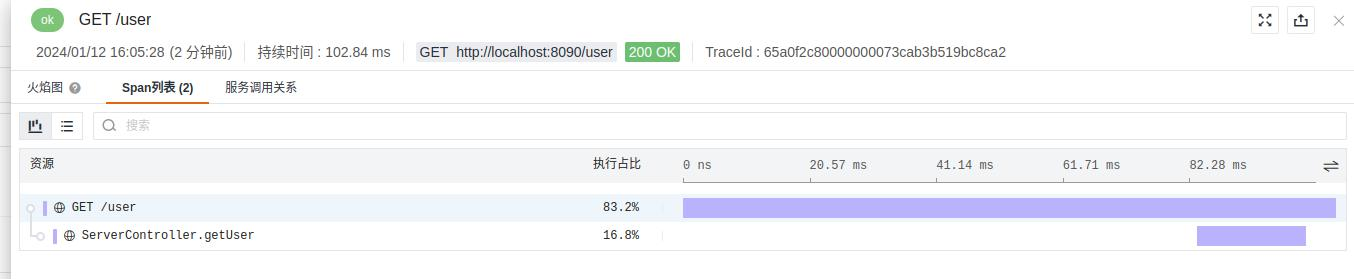
You can see two spans in the trace.
To include the users method in the trace, DDTrace provides the following parameters to discover business code information:
- Parameter:
-Ddd.trace.methods - Environment variable:
DD_TRACE_METHODS
Run the command:
java -javaagent:D:/ddtrace/dd-java-agent-1.25.2-guance.jar \
-Ddd.service=springboot-server \
-Ddd.env=1.0 \
-Ddd.agent.port=9529 \
-Ddd.trace.methods="com.zy.observable.server.service.TestService[users]" \
-jar springboot-server.jar
The result in the Guance platform is shown below:
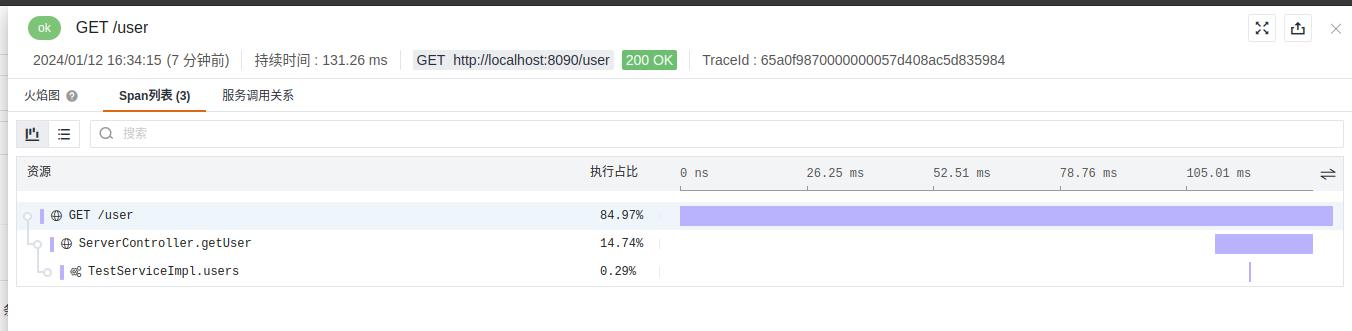
To trace all methods in a class, use * as a wildcard:
java -javaagent:D:/ddtrace/dd-java-agent-1.25.2-guance.jar \
-Ddd.service=springboot-server \
-Ddd.env=1.0 \
-Ddd.agent.port=9529 \
-Ddd.trace.methods="com.zy.observable.server.service.TestService[*]" \
-jar springboot-server.jar
The result in the Guance platform is shown below:

Although TestService has only one interface method, using the wildcard * still generates multiple span entries.
You may have noticed a problem: TestServiceImpl provides three methods: getUsername, users, and print. Among them, users calls both getUsername and print. Why does the trace show print but not getUsername?
- Why is
printin the trace?
Because TestServiceImpl implements the TestService interface, and * represents all methods. DDTrace actually enhances the implementation class TestServiceImpl of TestService. This is equivalent to -Ddd.trace.methods="com.zy.observable.server.service.TestServiceImpl[*]".
- Why is
getUsernamenot in the trace?
Mainly because DDTrace excludes certain critical methods. It does not instrument the following types of methods:
- constructors
- getters
- setters
- synthetic methods
- toString
- equals
- hashcode
- finalizer method calls
Note that in the trace above, the print method appears as three spans. This is because stus is a Map collection that loops three times, calling print three times. This can be problematic in some scenarios. Imagine if the stus collection had 1000 entries; print would generate that many spans. This is costly both for viewing traces (too many spans can cause high browser memory usage, leading to UI lag) and for storage and query costs.
How to Trace Method Calls with OpenTelemetry
Using the same code as above, run the application without adding any parameters:
-javaagent:/home/liurui/agent/opentelemetry-javaagent-1.26.1-guance.jar
-Dotel.traces.exporter=otlp
-Dotel.exporter.otlp.endpoint=http://localhost:4317
-Dotel.resource.attributes=service.name=springboot-server
The result in the Guance platform is shown below:
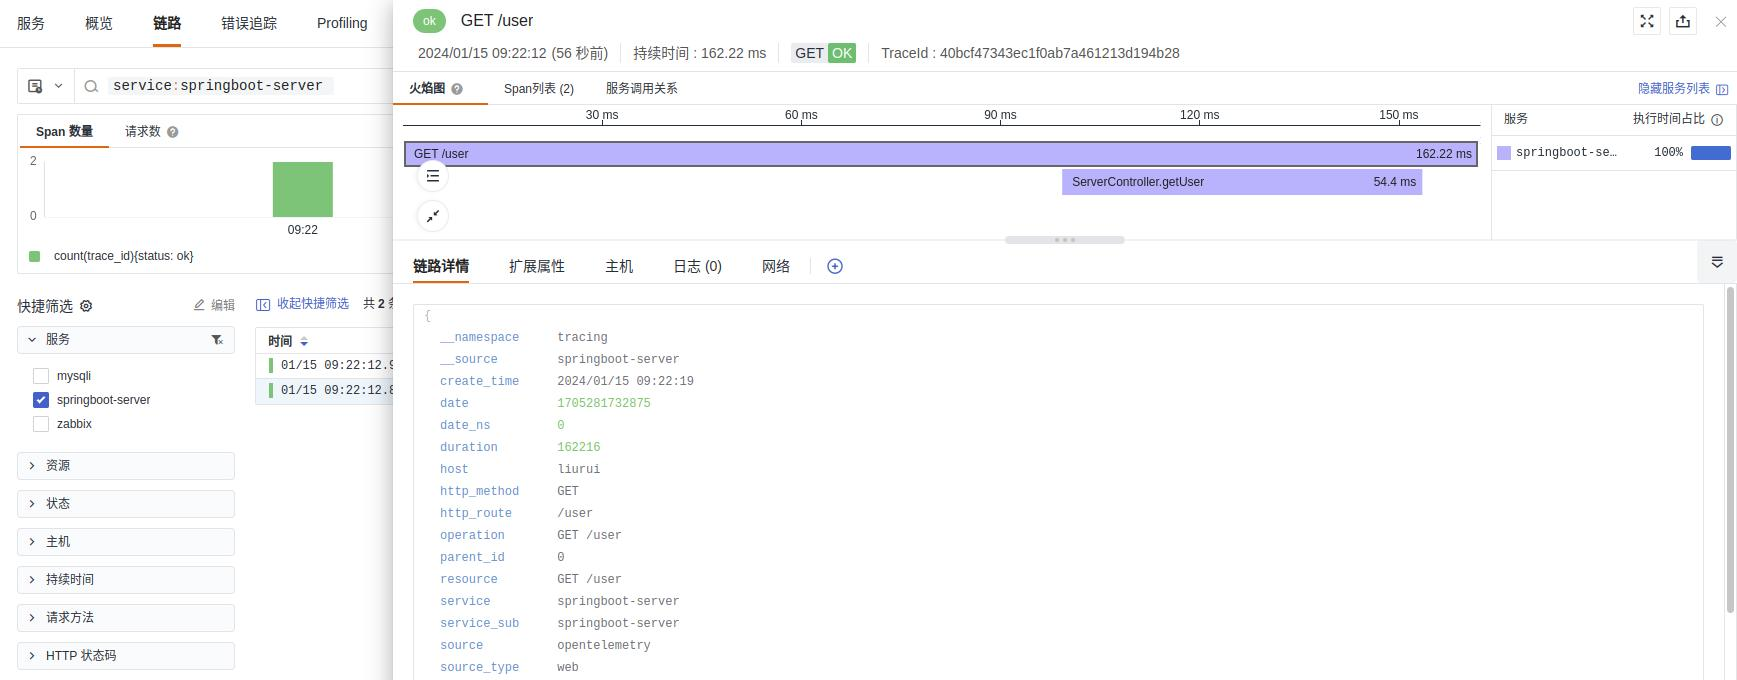
You can see that the OpenTelemetry trace spans are basically the same as those from DDTrace.
Without modifying the code, OpenTelemetry also provides the following configuration to capture spans for specific methods via the Java agent:
- Parameter:
-Dotel.instrumentation.methods.include - Environment variable:
OTEL_INSTRUMENTATION_METHODS_INCLUDE
Note that otel does not support wildcard syntax for this configuration.
Run the following command:
-javaagent:/home/liurui/agent/opentelemetry-javaagent-1.26.1-guance.jar
-Dotel.traces.exporter=otlp
-Dotel.exporter.otlp.endpoint=http://localhost:4317
-Dotel.resource.attributes=service.name=springboot-server
-Dotel.instrumentation.methods.include="com.zy.observable.server.service.TestService[users]"
The result in the Guance platform is shown below:

Similarly, the users method is now added as a span.
SDK Approach
The above sections introduced how DDTrace and OpenTelemetry can trace specific business methods in a non-intrusive way. They also provide SDK approaches, which are more flexible but introduce some code intrusiveness.
- DDTrace uses the
@Traceannotation to configure business spans. For specific usage and related dependencies, refer to the link. - OpenTelemetry uses the
@WithSpanannotation to configure business spans. Refer to the link.
We will not analyze the SDK approach in detail here.