Best Practices for Chia Harvesters
Introduction
Chia users need real-time monitoring of Harvesters across multiple hosts, with thorough analysis of the availability, status, and earnings of different Harvesters to continuously improve control over their Harvesters. DataFlux adopts active and passive monitoring, combined with a comprehensive anomaly detection module, to address the real needs of Chia users. It builds a unified Chia business management platform that enables users to intuitively grasp the overall operational status of Harvesters, improve production efficiency, and facilitate troubleshooting of Harvester failures or insufficient expected earnings. Meanwhile, we provide Chia expert-level performance services and on-site support to help Chia users achieve higher earnings. The key areas to monitor are:
- Harvesters
- CPU
- Memory
- Disk
- Network
Scenario View

Built-in Views
Disk

Prerequisites
DataKit installed (DataKit Installation Documentation)
Configuration
Log Collection
This document uses Windows as an example (the same applies to Linux).
Create a Chia Farm Log Collection Script
Git installed (Git Installation Reference)
Navigate to the chia-blockchain directory (C:\Users\{your user}\AppData\Local\chia-blockchain\app-{your chia version}\resources\app.asar.unpacked\daemon) and create a log collection script farmer.sh to save the Chia client farm information to farmer.log.
First create the
data_collectfolder inC:\Users\{your user}\AppData\Local\chia-blockchain\app-{your chia version}\.
#!/bin/bash

while true; do
    sleep 2
    ./chia.exe farm summary  | awk '{line=line "," $0} NR%10==0{print substr(line,1); line=""}' >> ../../../data_collect/farmer.log
done
DataKit Pipeline Configuration
Navigate to the pipeline directory under the DataKit installation directory and create farm_log.p and chai_debug_log.p respectively to parse the collected logs. Example:
chia_debug_log.p
#chia_debug_log
# Name        Description
# strptime($timestamp, "2006-01-02T15:04:05")
# total_plots  Number of plots
# eligible_plots  Number of plots passing initial filter
# proofs_found  Number of proofs found (block wins)
# check_duration  Query duration

# Log example:
#2021-04-24T11:01:53.390 harvester chia.harvester.harvester: INFO     1 plots were eligible for farming 940b588c2a... Found 0 proofs. Time: 0.98087 s. Total 19 plots

grok(_, "%{TIMESTAMP_ISO8601:strptime} harvester chia.harvester.harvester: INFO \\s+ %{NUMBER:eligible_plots} plots were eligible for farming \\w+\\.\\.\\. Found %{NUMBER:proofs_found} proofs\\. Time: %{NUMBER:check_duration} s\\. Total %{NUMBER:total_plots} plots.*")

# Numerical type conversion
cast(eligible_plots, "float")
cast(proofs_found, "float")
cast(check_duration, "float")
cast(total_plots, "float")

# Discard original content
drop_origin_data()
farm_log.p
#farm_log
# Name        Description
# farming_status  Farmer status
# xch_count  XCH earned
# last_farm_height  Farm height
# total_plot  Number of plots
# total_plots_size_GiB  Plot size in GiB
# total_plots_size_TiB  Plot size in TiB
# total_plots_size_PiB  Plot size in PiB
# network_space  Total network space (PiB)

# Log example:
#,Farming status: Farming,Total chia farmed: 0.0,User transaction fees: 0.0,Block rewards: 0.0,Last height farmed: 0,Plot count: 137,Total size of plots: 13.561 TiB,Estimated network space: 12457.266 PiB,Expected time to win: 5 months and 4 weeks,Note: log into your key using 'chia wallet show' to see rewards for each key

grok(_, ",Farming status: %{WORD:farming_status},Total chia farmed: %{NUMBER:xch_count},User transaction fees: %{NUMBER},Block rewards: %{NUMBER},Last height farmed: %{NUMBER:last_farm_height},Plot count: %{NUMBER:total_plot},Total size of plots: %{NUMBER:total_plots_size_GiB} GiB,Estimated network space: %{NUMBER:network_space_PiB} PiB.*")
grok(_, ",Farming status: %{WORD:farming_status},Total chia farmed: %{NUMBER:xch_count},User transaction fees: %{NUMBER},Block rewards: %{NUMBER},Last height farmed: %{NUMBER:last_farm_height},Plot count: %{NUMBER:total_plot},Total size of plots: %{NUMBER:total_plots_size_TiB} TiB,Estimated network space: %{NUMBER:network_space_PiB} PiB.*")
grok(_, ",Farming status: %{WORD:farming_status},Total chia farmed: %{NUMBER:xch_count},User transaction fees: %{NUMBER},Block rewards: %{NUMBER},Last height farmed: %{NUMBER:last_farm_height},Plot count: %{NUMBER:total_plot},Total size of plots: %{NUMBER:total_plots_size_PiB} PiB,Estimated network space: %{NUMBER:network_space_PiB} PiB.*")

# Numerical type conversion
cast(farming_status, "str")
cast(xch_count, "float")
cast(last_farm_height, "float")
cast(total_plot, "float")
cast(total_plots_size_GiB, "float")
cast(total_plots_size_TiB, "float")
cast(total_plots_size_PiB, "float")
cast(network_space_PiB, "float")

# Discard original content
drop_origin_data()
DataKit Log Collection Configuration
Navigate to the conf.d/log directory under the DataKit installation directory, copy logging.conf.sample and rename it to logging.conf. Example:
Note: Change the directories of the two
logfilesto the directories where your Chia log files are located.
[[inputs.logging]]
    # required, glob logfiles
    logfiles = ['''C:\Users\Administrator\.chia\mainnet\log\debug.*''']

    # glob filter
    ignore = [""]

    # your logging source, if it's empty, use 'default'
    source = "chia_harvester"

    # add service tag, if it's empty, use $source.
    service = ""

    # grok pipeline script path
    pipeline = "chia_debug_log.p"

    # optional status:
    #   "emerg","alert","critical","error","warning","info","debug","OK"
    ignore_status = []

    # optional encodings:
    #    "utf-8", "utf-16le", "utf-16le", "gbk", "gb18030" or ""
    character_encoding = ""

    # The pattern should be a regexp. Note the use of '''this regexp'''
    # regexp link: https://golang.org/pkg/regexp/syntax/#hdr-Syntax
    match = '''^\S'''

    [inputs.logging.tags]
    # tags1 = "value1"

[[inputs.logging]]
    # required, glob logfiles
    logfiles = ['''C:\Users\Administrator\AppData\Local\chia-blockchain\app-1.1.6\data_collect\farmer.log''']

    # glob filter
    ignore = [""]

    # your logging source, if it's empty, use 'default'
    source = "chia_farmer"

    # add service tag, if it's empty, use $source.
    service = ""

    # grok pipeline script path
    pipeline = "farm_log.p"

    # optional status:
    #   "emerg","alert","critical","error","warning","info","debug","OK"
    ignore_status = []

    # optional encodings:
    #    "utf-8", "utf-16le", "utf-16le", "gbk", "gb18030" or ""
    character_encoding = ""

    # The pattern should be a regexp. Note the use of '''this regexp'''
    # regexp link: https://golang.org/pkg/regexp/syntax/#hdr-Syntax
    match = '''^\S'''

    [inputs.logging.tags]
    # tags1 = "value1"
Restart DataKit for the changes to take effect
Monitoring Metrics
1. Harvesters
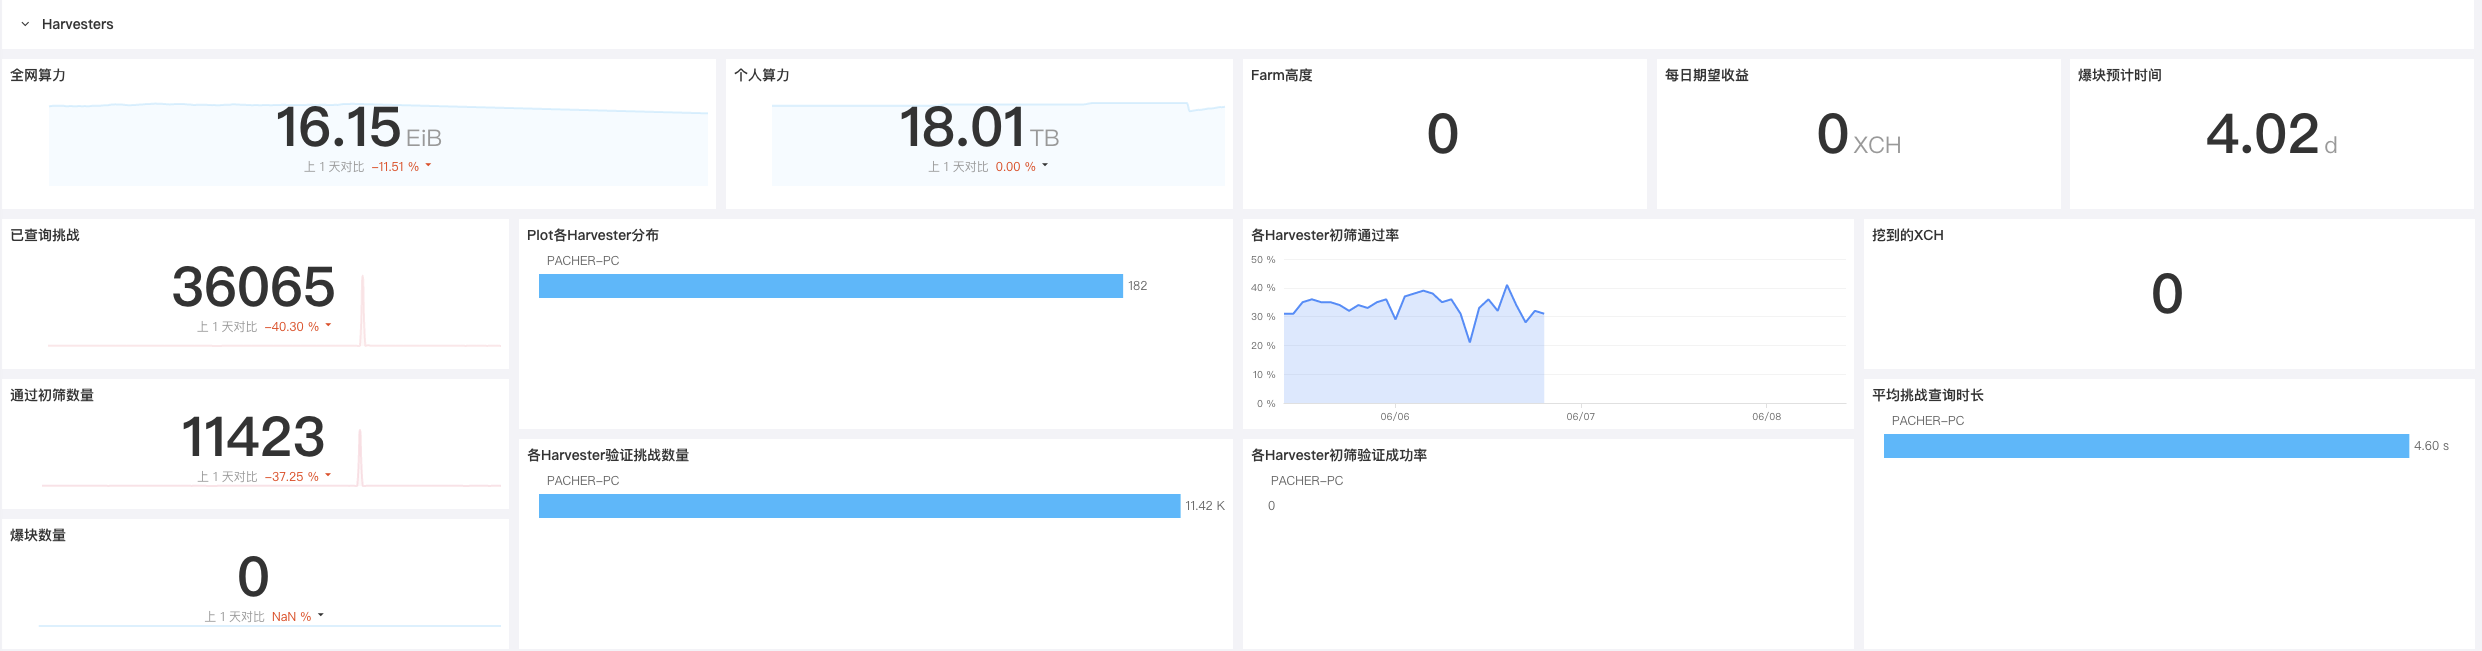
Real-time monitoring of Harvesters on multiple hosts, thoroughly analyzing the availability, status, and earnings of different Harvesters to continuously improve Chia users' control over their Harvesters.
| Metric | Name | Standard |
|---|---|---|
| Total Network Space | chia_farmer.network_space |
None |
| Total Plot Size | chia_farmer.total_plots_size |
None |
| Farm Height | chia_farmer.last_farm_height |
None |
| Expected Daily Earnings | chia_harvester.expected_xch |
None |
| Challenges Queried | chia_harvester.count_eligible |
None |
| Plots Passing Initial Filter | chia_harvester.eligible_plots |
None |
| Proofs Found (Blocks) | chia_harvester.proofs_found |
Performance metric |
| Average Challenge Query Duration | chia_harvester.check_duration |
Performance metric |
| XCH Earnings | chia_farmer.xch_count |
None |
Expected Daily Earnings
If your plot count grows steadily each day, your share of the network space will remain stable, which ensures that your expected daily earnings do not fluctuate sharply. If you notice a rapid change in expected daily earnings, pay attention to whether a Harvester node has gone offline or whether the network space has grown so fast that your share has dropped. It is recommended to monitor expected daily earnings closely and set alerts to stabilize your earnings.
Harvester Initial Filter Pass Rate
To ensure stable earnings, monitor the number of plots passing the initial filter on each Harvester. Under normal network and disk health conditions, the pass rate should remain within a stable range without drastic fluctuations. If you observe a sharp change in the pass rate, promptly check disk and network status to protect your earnings.
Average Challenge Query Duration
Monitor the average challenge query duration for each Harvester and set alerts to ensure that the query time does not exceed 5 seconds. If it exceeds 5 seconds, promptly investigate network and disk conditions to safeguard your earnings.
2. CPU Monitoring
CPU monitoring helps analyze CPU load peaks and identify excessive CPU usage. By monitoring CPU metrics, you can improve CPU capacity or reduce load, find potential issues, and avoid excessive costs from unnecessary upgrades. CPU metrics also help identify unnecessary background processes and the resource utilization of processes or applications and their impact on the entire network.

| Metric | Name | Standard |
|---|---|---|
| CPU Load | system.load1system.load5system.load15 |
Resource utilization |
| CPU Usage | cpu.usage_idlecpu.usage_usercpu.usage_system |
Resource utilization |
CPU Usage
CPU usage can be divided into: User Time (percentage of time executing user processes); System Time (percentage of time executing kernel processes and interrupts); Idle Time (percentage of time CPU is idle). For CPU performance, the run queue per CPU should not exceed 3. If the CPU is fully loaded, User Time should be around 65%–70%, System Time around 30%–35%, and Idle Time around 0%–5%.
3. Memory Monitoring
Memory is a key factor affecting Linux performance. Whether memory resources are sufficient directly impacts the performance of application systems.

| Metric | Name | Standard |
|---|---|---|
| Memory Usage | mem.used_percent |
Resource utilization |
| Memory Usage | mem.freemem.used |
Resource utilization |
| Memory Buffered | mem.buffered |
Resource utilization |
| Memory Cached | mem.cached |
Resource utilization |
Memory Usage
It is important to closely monitor available memory, because contention for RAM will inevitably lead to paging and performance degradation. To keep machines running normally, ensure sufficient RAM for your workload. Consistently low memory availability can cause segmentation faults and other serious issues. Remedial measures include increasing the physical memory capacity in the system and, if possible, enabling memory page merging.
4. Disk Monitoring

| Metric | Name | Standard |
|---|---|---|
| Disk Health Status | disk.healthdisk.pre_fail |
Availability |
| Disk Space | disk.freedisk.used |
Resource utilization |
| Disk Inodes | disk.inodes_freedisk.inodes_used |
Resource utilization |
| Disk Read/Write | diskio.read_bytesdiskio.write_bytes |
Resource utilization |
| Disk Temperature | disk.temperature |
Availability |
| Disk Model | disk.device_model |
Basic |
| Disk Read/Write Time | diskio.read_timediskio.write_time |
Resource utilization |
Disk Space
Maintaining sufficient free disk space is necessary for any operating system. Besides regular processes, core system processes store logs and other data on disk. Configure alerts to notify when available disk space drops below 15% to ensure business continuity.
Disk Read/Write Time
This metric tracks the average time for disk read/write operations. A value above 50 ms indicates relatively high latency (best practice is under 10 ms). It is often recommended to reduce latency by moving workloads to faster disks. You can set different alert thresholds based on the server role, as acceptable thresholds vary.
Disk Read/Write
If your server hosts demanding applications, monitor disk I/O rates. Disk read/write metrics are aggregates of read (diskio.read_bytes) and write (diskio.write_bytes) activities. Sustained high disk activity can lead to service degradation and system instability, especially when combined with high RAM and page file usage. When high disk activity occurs, consider increasing the number of disks in use (especially if you see many queued operations), using faster disks, increasing RAM reserved for file system cache, or distributing workloads across more machines.
Disk Temperature
If your business requires high disk availability, set alerts to monitor disk operating temperature. Temperatures above 65°C (70°C for SSDs) are noteworthy. If your hard drive has thermal protection or temperature control mechanisms, be cautious: a further temperature increase could damage the drive and lead to data loss.
5. Network Monitoring
Your applications and infrastructure components are interdependent in increasingly complex architectures, whether you run monolithic applications or microservices, deploy to cloud infrastructure, private data centers, or both. Virtualized infrastructure enables developers to respond to any scale and creates dynamic network patterns that traditional network monitoring tools struggle to match. To provide visibility into every component in your environment and all connections between them, DataFlux introduces network performance monitoring for the cloud era.

| Metric | Name | Standard |
|---|---|---|
| Network Traffic | net.bytes_recvnet.bytes_sent |
Resource utilization |
| Network Packets | net.packets_recvnet.packets_sent |
Resource utilization |
| Retransmissions | net.tcp_retranssegs |
Availability |
Network Traffic
These two metrics together measure the total network throughput on a given network interface. For most consumer hardware, NIC transmission speeds are 1 Gbps or higher, making the network unlikely to be a bottleneck except in the most extreme cases. Configure alerts when bandwidth utilization exceeds 80% of the interface capacity (for a 1 Gbps link, that is about 100 MB/s) to prevent network saturation.
Retransmissions
TCP retransmissions are common but not errors, although their presence can indicate a problem. Retransmissions are often the result of network congestion and are usually associated with high bandwidth consumption. Monitor this metric because excessive retransmissions can cause significant application latency. If the sender does not receive an acknowledgment for a sent packet, it will delay sending more packets (typically for about 1 second), increasing latency related to congestion.
If not caused by network congestion, the source of retransmissions may be faulty network hardware. A low number of dropped packets combined with a high retransmission rate may indicate excessive buffering. Regardless of the cause, track this metric to understand seemingly random fluctuations in network application response times.
Conclusion
In this article, we have mentioned some of the most useful metrics that you can monitor to keep track of your mining operations. If you are running a mining farm, monitoring the metrics in the list below will give you a good understanding of the health and availability of your farm:
- Disk Read/Write Latency
- Disk Temperature
- Network Traffic
- Expected Daily Earnings
- Harvester Initial Filter Pass Rate
- Processes
Ultimately, you will recognize other metrics that are particularly relevant to your own use cases. Of course, you can also learn more through Guance.