Nginx Observability Best Practices
Background
Nginx is an open-source, free, high-performance HTTP and reverse proxy server, which can also be used as an IMAP/POP3 proxy server. Nginx adopts an asynchronous, non-blocking worker model, providing high concurrency and low resource consumption. Its highly modular design also gives Nginx excellent extensibility. Nginx shows great advantages in serving static files, handling reverse proxy requests, and is easy to deploy and maintain. Therefore, most enterprises use Nginx internally. Currently, the most common use cases for Nginx are as follows:
-
WEB server (static resource server)
-
Load balancer (traffic distribution and load)
- Reverse proxy
- Others
Although Nginx is simple, it is still relatively important within an enterprise due to its wide range of application scenarios. How to ensure the health and stability of Nginx is a major concern for enterprise operations staff. Nginx's built-in performance metrics module with-http_stub_status_module can directly obtain Nginx-related data, such as the number of active connections and processed connections. At the same time, Nginx logs (access.log, error.log) can be used for specific request-level analysis, such as PV count, UV count, and request error statistics. Combining these two types of data provides a quick understanding of Nginx's state.
-
Nginx (with-http_stub_status_module)
-
Nginx logs:
Example:

Although Nginx itself provides enough data sources to reflect its own state, text-based data formats or log-based formats are inconvenient to view and not visually appealing. Moreover, these data formats cannot reflect the trend of Nginx-related request counts or server request status in real time. So, what useful visualization tools can quickly display such data or metrics? Currently, enterprises often use log processing tools (ELK, Splunk) to process and visualize Nginx logs, and Nginx performance data is often displayed using tools that support visualization. These two approaches may have data fragmentation or high solution costs. To solve this problem, DataKit handles data from the source—for example, using the same configuration item to collect both Nginx performance metrics and logs simultaneously, and displaying the data on the same platform and interface, thereby improving user efficiency.
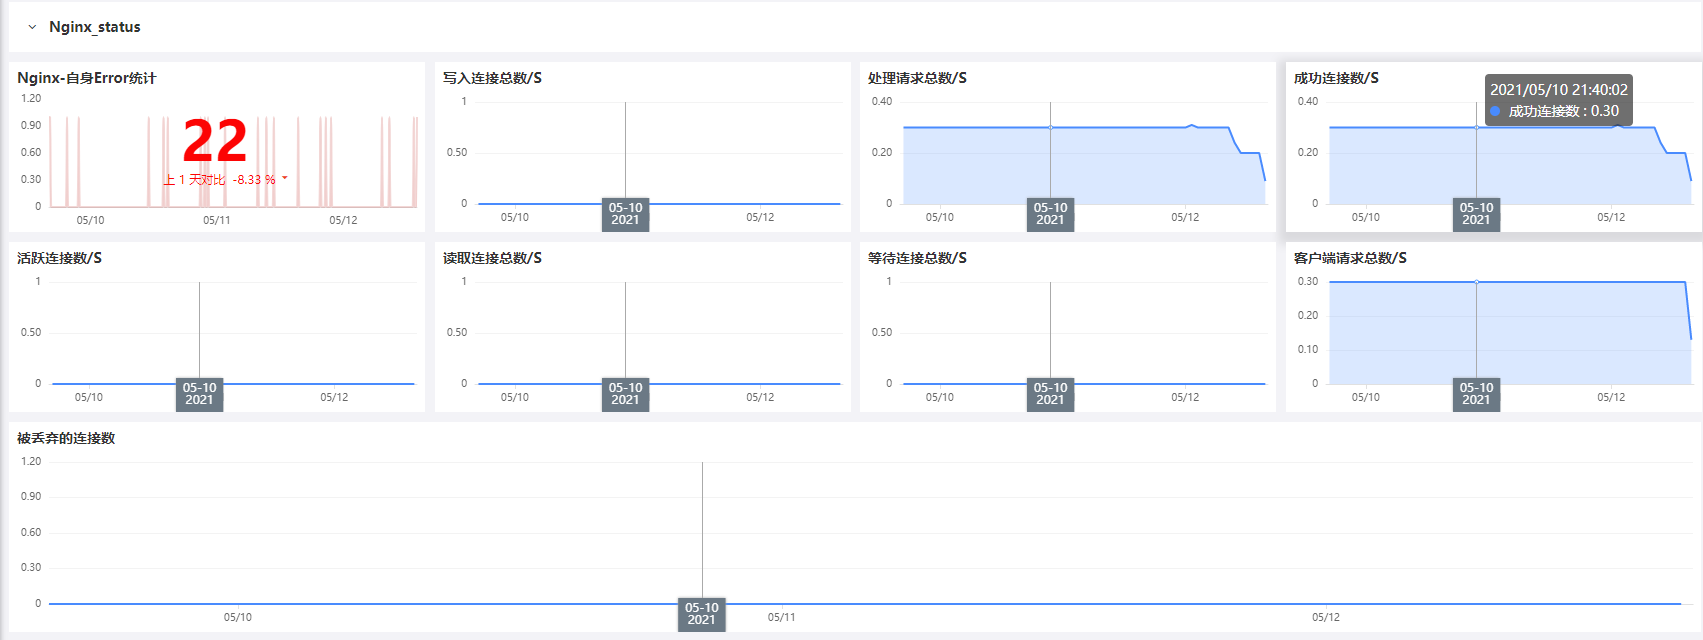
DataKit configuration interface and final monitoring effect display:

Prerequisites for Nginx Monitoring Integration with Guance
Account Registration
Go to Guance to register an account, then log in with your registered account/password.
Install DataKit
Obtain the Command
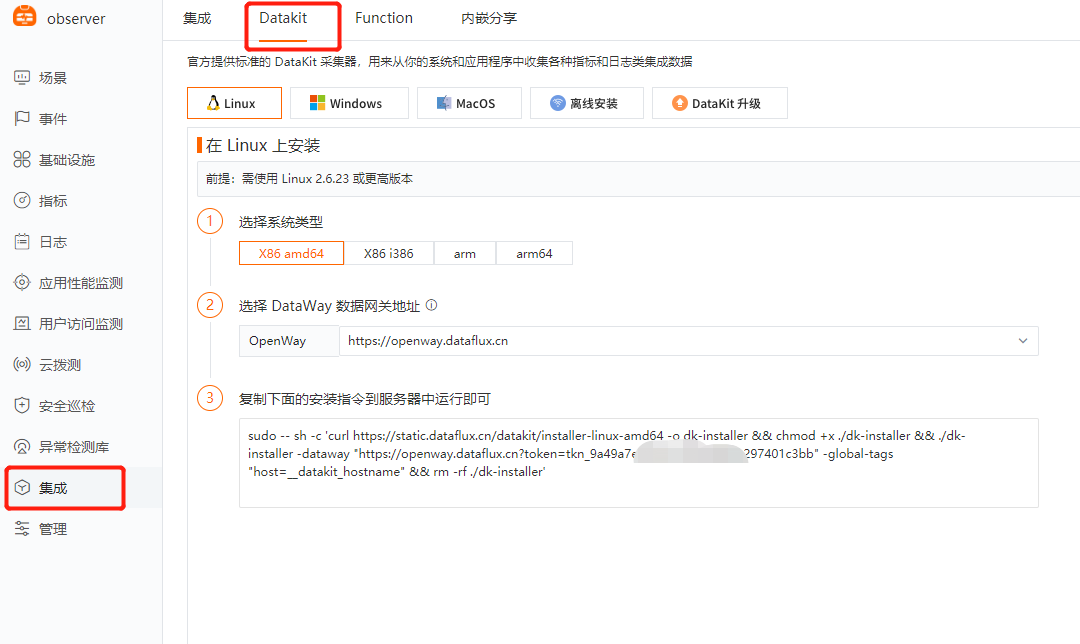
Click the [Integrations] module, then click the [Quickly Get DataKit Installation Command] in the upper right corner. Select the appropriate installation command based on your operating system and system type.
Execute the Installation
Copy the DataKit installation command and run it directly on the server to be monitored.
-
Installation directory: /usr/local/datakit/
-
Log directory: /var/log/datakit/
- Main configuration file: /usr/local/datakit/conf.d/datakit.conf
- Plugin configuration directory: /usr/local/datakit/conf.d/
After DataKit is installed, common Linux host plugins are enabled by default. You can view them in Infrastructure → Built-in Views.
| Collector Name | Description |
|---|---|
| cpu | Collects host CPU usage |
| disk | Collects disk usage |
| diskio | Collects host disk I/O |
| mem | Collects host memory usage |
| swap | Collects swap memory usage |
| system | Collects host operating system load |
| net | Collects host network traffic |
| host_process | Collects the list of persistent processes (alive for more than 10 minutes) on the host |
| hostobject | Collects basic host information (e.g., OS info, hardware info) |
| docker | Collects possible container objects and container logs on the host |
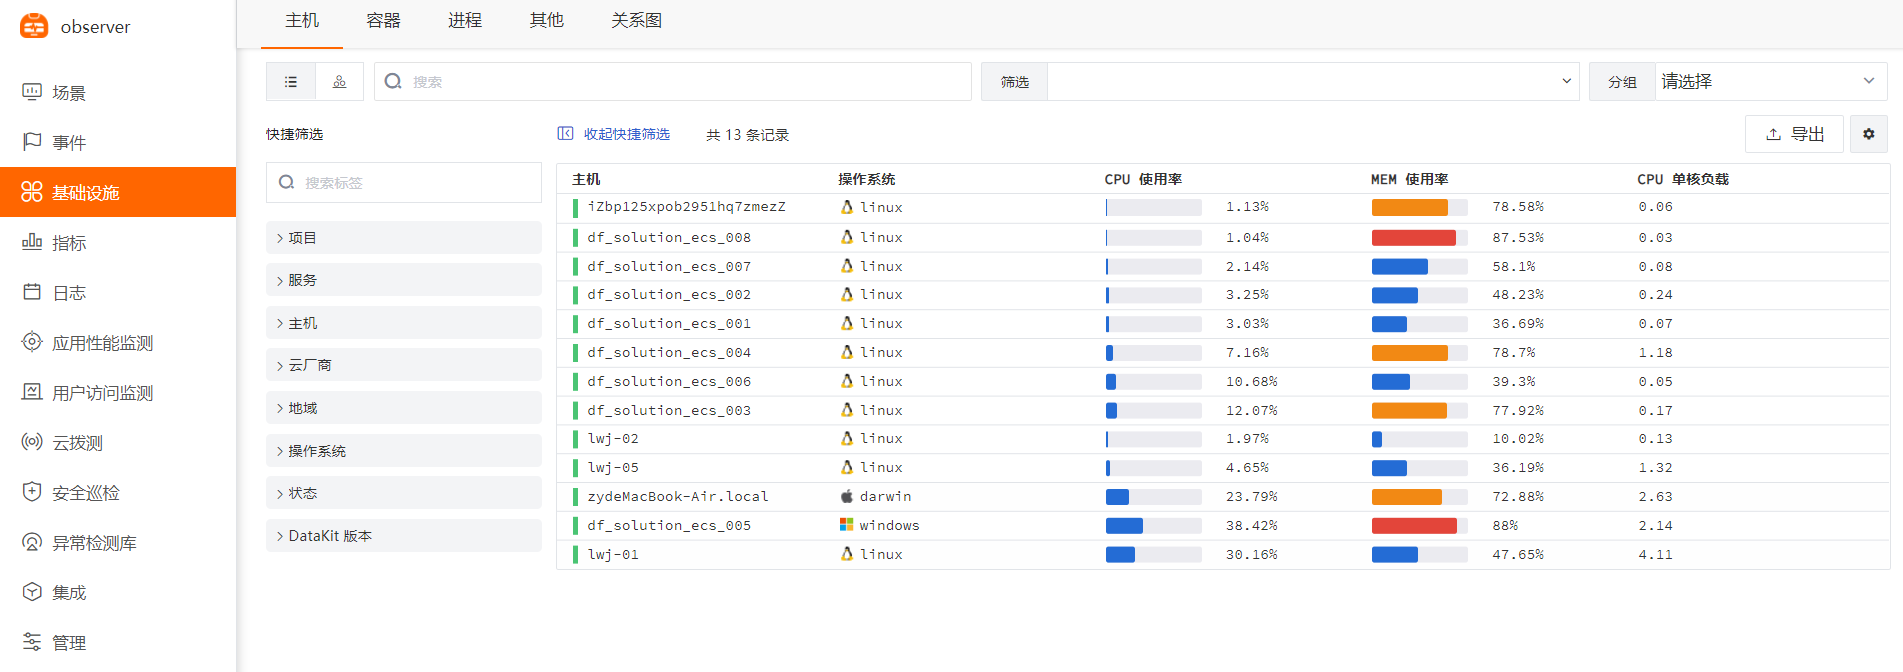
Click the [Infrastructure] module to view the list of all hosts with DataKit installed and their basic information, such as hostname, CPU, memory, etc.
Create a Monitoring Scenario
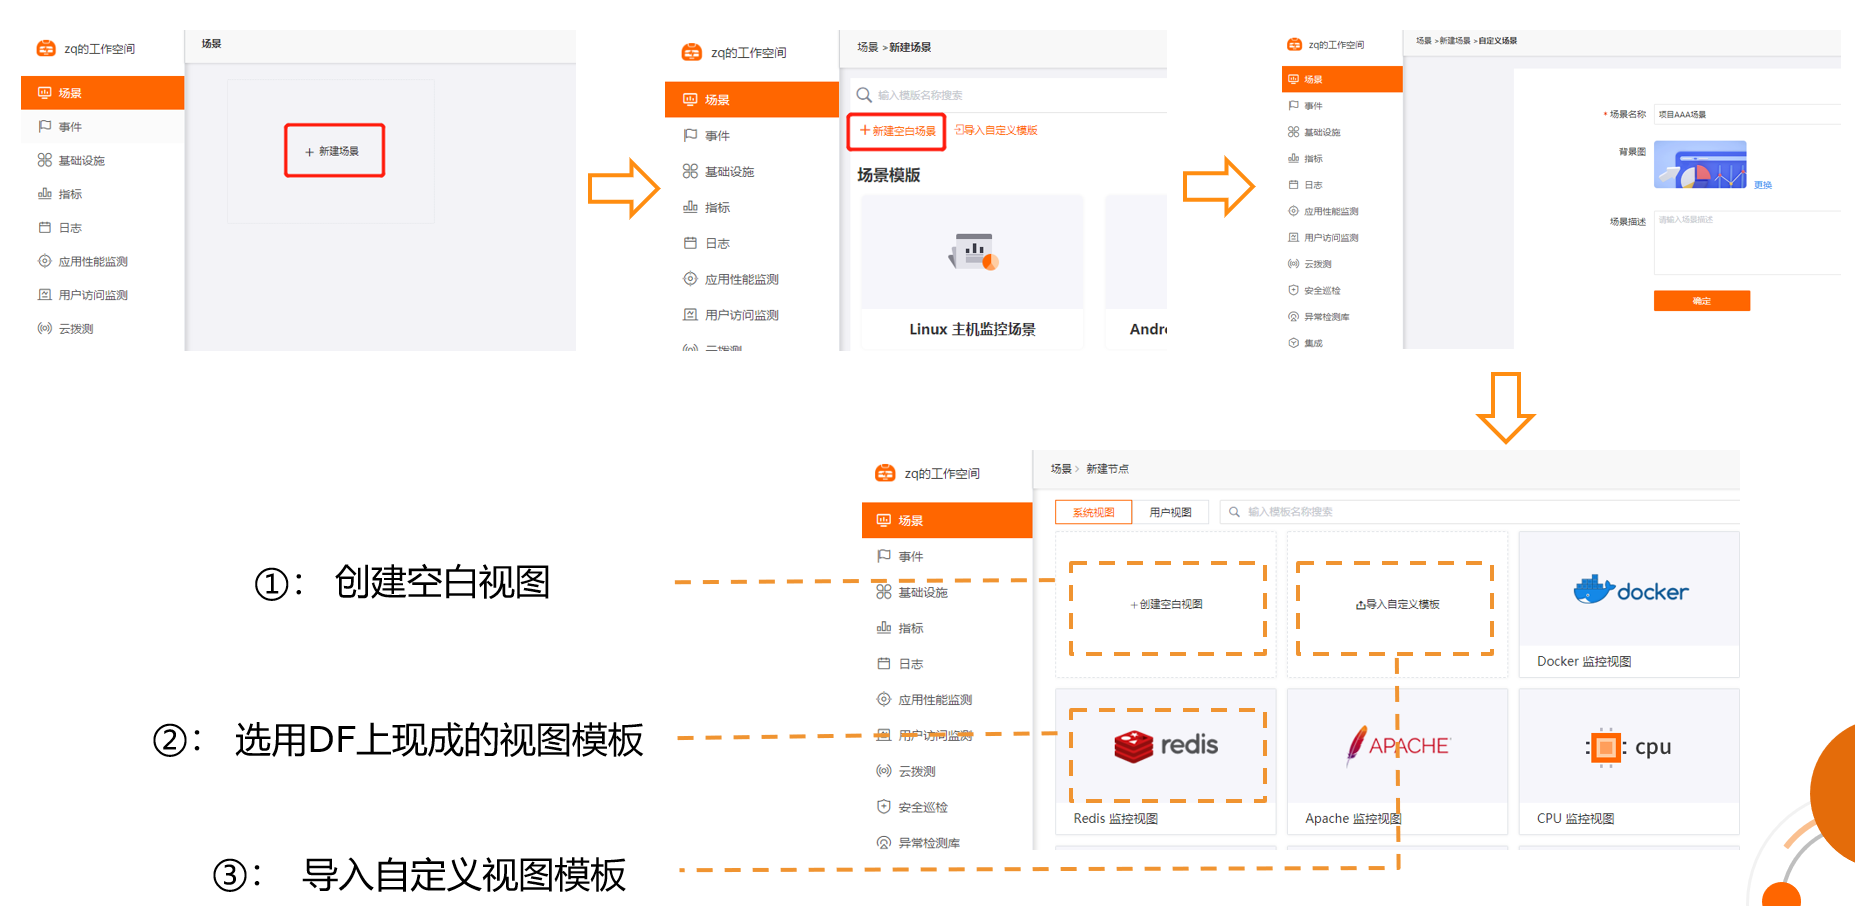
Log in to DataFlux and enter a specific workspace. Click Create Scenario → Create Blank Scenario → View Template (it is recommended to select the Nginx view template from the DF system views directly):
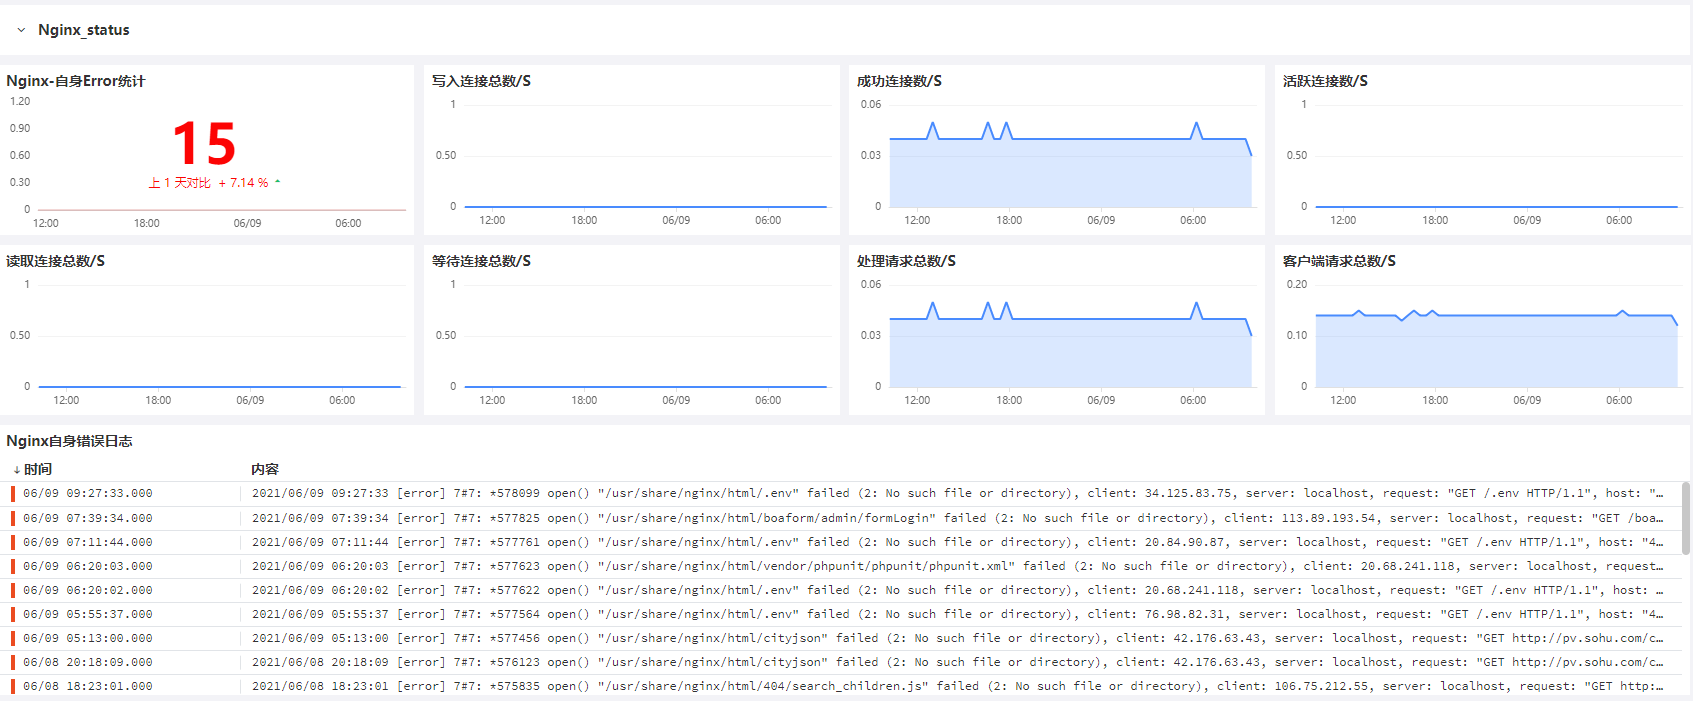
Monitoring view as follows:
Steps to Enable Nginx Collection Configuration
Prerequisites for Enabling nginx.conf in datakit.inputs
Verify whether the Nginx with-http_stub_status_module module is enabled. If the module is not installed, you need to install it.
Linux Environment:
For Nginx installed via yum, you can check if the with-http_stub_status_module module is enabled by running nginx -V in the console. If the module is already present, skip directly to the Datakit Enable Nginx.inputs section.

For custom-installed Nginx, you can check by running /usr/local/nginx/sbin/nginx -V in the console. If the module is already present, skip directly to the Datakit Enable Nginx.inputs section.

Windows Environment:
In PowerShell, run .\nginx.exe -V to check. If the module is already present, skip directly to the Datakit Enable Nginx.inputs section.
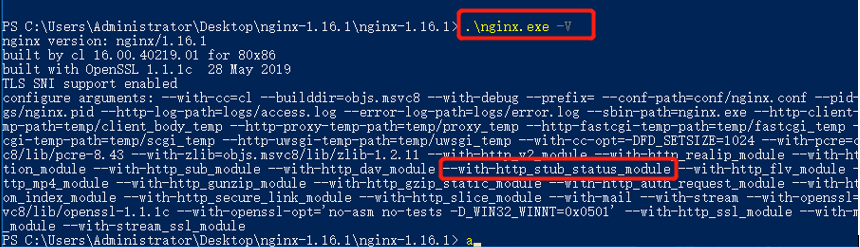
Install the with-http_stub_status_module Module (Linux):
If this module is already installed, skip this step directly.
Enabling this module requires recompiling Nginx. The specific command is:
./configure --with-http_stub_status_module
To find the configure file location: find /| grep configure |grep nginx
$ find /| grep configure |grep nginx
$ cd /usr/local/src/nginx-1.20.0/
$ ./configure --with-http_stub_status_module

Add the nginx_status location in nginx.conf (example)
$ cd /etc/nginx
   // nginx path depends on the actual situation
$ vim nginx.conf

$  server{
     listen 80;
     server_name localhost;
     // port can be customized

      location /nginx_status {
          stub_status  on;
          allow 127.0.0.1;
          deny all;
                             }

          }

Next, run nginx -s reload to reload Nginx
Check if the module is enabled correctly:
Linux: curl http://127.0.0.1/nginx_status
Windows: Access http://127.0.0.1/nginx_status in a browser
The following data will appear:
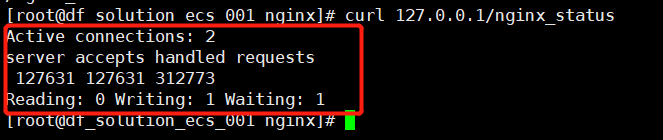
Enable Nginx.inputs in DataKit
Linux Environment:
Modify the following content:
[[inputs.nginx]]
    url = http://localhost/nginx_status
[inputs.nginx.log]
    files = ["/var/log/nginx/access.log","/var/log/nginx/error.log"]

pipeline = "nginx.p"
# The pipeline file is responsible for parsing nginx logs, splitting the complete text file into key-value pairs for easy visualization on the DF platform.
# The pipeline configuration nginx.p is placed in /usr/local/datakit/pipeline/ by default, and built-in cutting statements for access and error log formats are already included.
Save the nginx.conf file and restart DataKit
# For customized pipeline modifications, refer to Text Processing (Pipeline)
Windows Environment:
$ Enter C:\Program Files\datakit\conf.d\nginx
$ Copy nginx.conf.sample and rename it to nginx.conf
$ Edit the nginx.conf file
Modify the following content:
[[inputs.nginx]]
    url = http://localhost/nginx_status
[inputs.nginx.log]
    files = ["/logs/access.log","/ logs/error.log"]
Nginx and Related Metrics Introduction
What is Nginx?
Nginx (pronounced "engine X") is a commonly used HTTP server and reverse proxy server. As an HTTP server, Nginx can serve static content very efficiently and reliably with low memory consumption. As a reverse proxy, it can serve as a single controlled access point for multiple backend servers or other applications such as caching and load balancing. Nginx can be used via the open-source version or through the more feature-rich commercial distribution Nginx Plus. Nginx can also be used as a mail proxy and generic TCP proxy, but this article will not directly discuss monitoring for these scenarios.
Key Nginx Metrics
By monitoring Nginx, you can discover two types of problems: 1) Nginx resource issues, and 2) development issues elsewhere in the web infrastructure. Some metrics that most Nginx users will benefit from monitoring include requests per second, which provides a high-level view of end-user activity mix; server error rate, which refers to the ratio of failed or invalid server request processing to total requests; and request processing time, which describes the time your server spends processing client requests (this may indicate slow requests or other issues in the environment).
Generally, at least three key categories of metrics should be monitored:
-
Basic activity metrics
-
Error metrics
- Performance metrics
Below we break down the most important Nginx metrics in each category, along with a fairly common use case that deserves special mention: using Nginx Plus for reverse proxy. We will also cover how to monitor all these metrics using your chosen graphing or monitoring tool.
Basic Activity Metrics
Regardless of which Nginx use case you are employing, you will undoubtedly want to monitor how many client requests the server is receiving and how it is handling them.
Nginx Plus can report basic activity metrics just like open-source Nginx, but it also provides an additional module that reports slightly different metrics. We first discuss open-source Nginx, then the additional reporting capabilities provided by Nginx Plus.
Nginx
The diagram below shows the lifecycle of a client connection and how the open-source version of Nginx collects metrics during the connection.
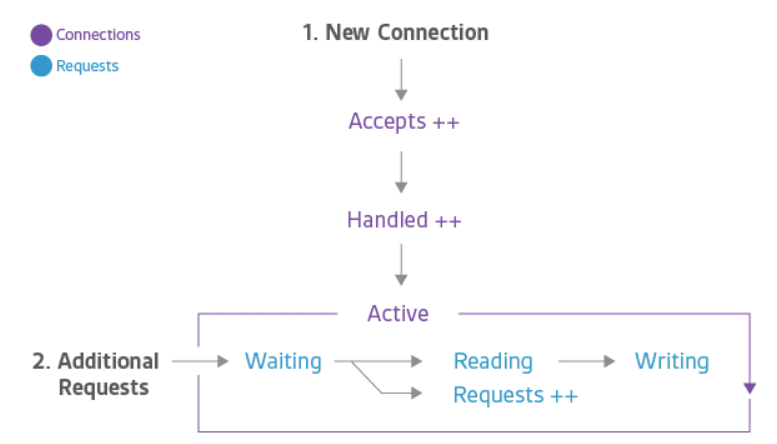
Accepts, Handled, and Requests increase as counters. Active, Waiting, Reading, and Writing vary with the number of requests.
| Name | Description | Metric Type |
|---|---|---|
| Accepts | Count of client connection attempts by Nginx | Resource: Utilization |
| Handled | Number of successful client connections | Resource: Utilization |
| Active | Current active client connections | Resource: Utilization |
| Requests | Number of client requests | Work: Throughput |
When Nginx receives a connection request from the operating system, the counter increments. If a worker cannot obtain a connection for the request (by establishing a new connection or reusing an open one), the connection is dropped. Typically, connections are dropped due to resource limits (e.g., Nginx's worker_connections limit).
-
Waiting: If there are no active requests, active connections may also be in the "waiting" state. New connections can bypass this state and move directly to Reading. This is most common when using "accept filters" or "delayed accept", where Nginx does not proceed until there is enough data to start responding. If a connection is set to keep-alive, the connection will also be in the "waiting" state after sending a response.
-
Reading: When a request is received, the connection exits the waiting state, and the request itself is considered to be in the reading state. In this state, Nginx is reading the client request headers. Request headers are generally lightweight, so this is usually a fast operation.
- Writing: After reading the request, the request is considered to be in the writing state and remains in this state until the response is returned to the client. This means that when Nginx is waiting for results from upstream systems (systems behind Nginx) and Nginx is operating on the response, the request is in the writing state. Requests typically spend most of their time in the writing state.
Typically, a connection supports only one request at a time. In this case, active connections = waiting connections + reading requests + writing requests. However, HTTP/2 allows multiplexing multiple concurrent requests/responses over a connection, so Active may be less than the sum of Waiting, Reading, and Writing.
Nginx Plus
As mentioned above, Nginx Plus provides all the metrics available in open-source Nginx, but it also exposes additional metrics. This section introduces metrics only available from Nginx Plus.
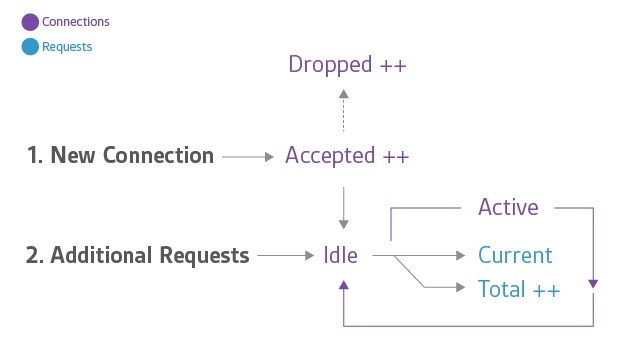
The counters for Accepted, Dropped, and Total increase continuously. Active, Idle, and Current track the current number of connections or total requests in each state, so they increase or decrease as request volume changes.
| Name | Description | Metric Type |
|---|---|---|
| Accepted | Number of client connection attempts to Nginx | Resource: Utilization |
| Dropped | Number of dropped connections | Work: Error Count |
| Active | Current active client connections | Resource: Utilization |
| Idle | Client connections with zero current requests | Resource: Utilization |
| Total | Number of client requests | Work: Throughput |
| *Strictly speaking, dropped connections are a measure of resource saturation, but because saturation causes Nginx to stop serving some work (rather than queuing it for later), it is best to treat "dropped" as an important metric. |
When an Nginx Plus worker Accepted a connection request from the OS, the counter increments. If a worker cannot obtain a connection for the request (by establishing a new connection or reusing an open one), the connection is Dropped, and the dropped counter increments. Typically, connections are dropped due to resource limits (e.g., Nginx Plus's worker_connections limit).
Active and Idle are similar to the "active" and "waiting" states in open-source Nginx, with one key exception: in open-source Nginx, "waiting" is included in the "active" count, whereas in Nginx Plus, "idle" connections are excluded from the "active" count. Current is equivalent to the combined "Reading+Writing" state in open-source Nginx.
Total is the cumulative count of client requests. Note that a single client connection may involve multiple requests, so the total may be much larger than the cumulative number of connections. In fact, (total / accepted) represents the average number of requests per connection.
| Nginx (Open Source) | Nginx Plus |
|---|---|
| accepts | accepted |
| dropped (needs calculation) | dropped (reported directly as a metric) |
| reading + writing | current |
| waiting | idle |
| active (includes "waiting" states) | active (excludes "idle" states) |
| requests | total |
Alert Metric: Dropped Connections
The number of dropped connections equals the difference between accepted and handled, or it can be directly obtained from the metric provided by Nginx Plus. Under normal circumstances, dropped connections should be zero. If the rate of dropped connections per unit time starts to rise, look for possible factors causing resource saturation.
Alert Metric: Requests per Second
Sampling request data at fixed intervals (Requests in open-source Nginx, or Total in Nginx Plus) gives you the number of requests received per unit time—usually per minute or second. Monitoring this metric can alert you to peaks in incoming network traffic, whether legitimate or malicious, or sudden drops, which often indicate problems. A drastic change in requests per second can alert you to issues occurring somewhere in your environment, though it may not tell you exactly where. Note that all requests are counted, regardless of their URL.
Collecting Activity Metrics
Open-source Nginx exposes these basic server metrics on a simple status page. Because the status information is displayed in a standardized format, almost any graphing or monitoring tool can be configured to parse the relevant data for analysis, visualization, or alerting. Nginx Plus provides a JSON feed with richer data. Read the companion article on Nginx Metrics Collection for instructions on enabling metric collection.
Error Metrics
| Name | Description | Metric Type | Availability |
|---|---|---|---|
| 4xx codes | Count of client errors, e.g., "403 Forbidden" or "404 Not Found" | Work: Error Count | Nginx logs Nginx Plus |
| 5xx codes | Count of server errors, e.g., "500 Internal Server Error" or "502 Bad Gateway" | Work: Error Count | Nginx logs Nginx Plus |
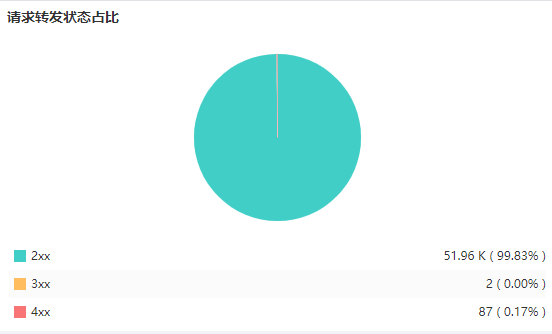
Nginx error metrics tell you that the server returned an error instead of processing a valid request. Client errors are represented by 4xx status codes, and server errors by 5xx status codes.
Alert Metric: Server Error Rate
Your server error rate equals the number of 5xx errors (e.g., "502 Bad Gateway") per unit time (usually 1 to 5 minutes) divided by the total number of requests (including 1xx, 2xx, 3xx, 4xx, 5xx). If your error rate starts to climb over time, you may need to investigate. If it increases suddenly, urgent action may be required, as clients may be reporting errors to end users.
Note about client errors: 4xx errors indicate client-side problems, and the information obtained from 4xx is limited because it mainly represents client anomalies and does not provide specific insight into particular URLs. In other words, changes in 4xx may be noise, e.g., from web scanners blindly looking for vulnerabilities.
Collecting Error Metrics
Although open-source Nginx does not directly provide an observable error rate, there are at least two ways to capture this information:
-
Use the extended status module included with commercially supported Nginx Plus
-
Configure Nginx's log module to write response codes in the access log
Read the companion article on Nginx Metrics Collection for detailed instructions on both methods.
Performance Metrics
| Name | Description | Metric Type | Availability |
|---|---|---|---|
| Request time | Time to process each request, in seconds | Work: Performance | Nginx logs |
Alert Metric: Request Processing Time
The request time metric recorded by Nginx captures the processing time of each request, from reading the first client byte to completing the request. Longer response times may indicate upstream (server-side) issues.
Collecting Processing Time Metrics
Nginx and Nginx Plus users can capture processing time data by adding the $request_time variable to the access log format. For more details on configuring logs for monitoring, see our companion article on Nginx Logs.
Reverse Proxy Metrics
| Name | Description | Metric Type | Availability |
|---|---|---|---|
| Active connections to upstream servers | Current active client connections | Resource: Utilization | Nginx Plus |
| 5xx status codes from upstream servers | Server-side errors | Work: Error Count | Nginx Plus |
| Server group availability per upstream | Servers passing health checks | Resource: Availability | Nginx Plus |
The most common use of Nginx is as a reverse proxy. The commercial version Nginx Plus exposes a wealth of metrics about backend (or "upstream") servers that are relevant to reverse proxy setups. This section focuses on some key upstream metrics that Nginx Plus users should monitor.
Nginx Plus first breaks down upstream metrics by group, then by individual server. For example, if your reverse proxy distributes requests to five upstream web servers, you can see at a glance whether any of those individual servers are overloaded, and whether there are enough healthy servers in the upstream server group to ensure good response times.
Activity Metrics
The number of active connections per upstream server helps you verify that the reverse proxy is distributing work correctly across the server group. If you are using Nginx as a load balancer, a significant deviation in the number of connections handled by any one server may indicate that the server is struggling to process requests in a timely manner, or that the load balancing method you configured (e.g., round-robin or IP hash) could be optimized for your traffic patterns.
Error Metrics
As discussed in the error metrics section above, 5xx (server error) codes such as "502 Bad Gateway" or "503 Service Temporarily Unavailable" are important metrics to monitor, especially as a proportion of total response codes. Nginx Plus makes it easy to obtain the count of 5xx status codes for each upstream server, along with the total number of responses, to determine the error rate for specific servers.
Availability Metrics
For another perspective on web server health, Nginx also allows you to easily monitor the health of upstream groups by looking at the number of servers currently available in each group. In large reverse proxy setups, as long as your pool of available servers can handle the load, you may not care much about the status of a single server. However, monitoring the total number of servers that are up in each upstream group provides a comprehensive view of the overall health of your web servers.
Collecting Upstream Metrics
Nginx Plus upstream metrics are exposed on the Nginx Plus monitoring dashboard and can also be made available via a JSON interface to virtually any external monitoring platform.
Conclusion
In this article, we have touched on some of the most valuable metrics that you can monitor on your Nginx server. If you are just getting started with Nginx, monitoring most or all of the metrics in the list below will give you good visibility into the health and activity level of your web infrastructure:
-
Dropped connections
-
Requests per second
- Server error rate
- Request processing time
Eventually, you will recognize other, more specialized metrics that are particularly relevant to your own infrastructure and use cases. Of course, what you monitor will depend on the tools you have and the metrics available.