Best Practices for Collecting JVM Observability with SkyWalking
Overview
JVM is a specification for computing devices. It is a virtual computer, short for Java Virtual Machine. Java is a highly abstract programming language that provides features such as automatic memory management, which is why the JVM abstraction layer exists. The JVM runs on top of the operating system to execute Java bytecode, enabling Java to be cross-platform.
Below is a brief introduction to the JVM memory structure and threads. Then, we will collect JVM metrics using SkyWalking and observe them through Guance.
JVM Memory Structure
The Java compiler targets only the JVM, generating bytecode files that the JVM can understand. The class loader in the JVM loads the bytecode, and the loaded bytecode is handed over to the JVM execution engine for execution. During the entire class loading process, the JVM uses a space to store data and related information, which is what we commonly refer to as JVM memory.
According to the JVM specification, JVM memory is divided into:
-
Program Counter Register
Records the execution address of the next JVM instruction. -
Java Virtual Machine Stacks
Each stack consists of multiple frames, corresponding to the memory occupied by each method invocation, used to store the local variable table, operand stack, constant pool reference, and other information. From method invocation to completion, it corresponds to the process of pushing and popping a frame in the Java virtual machine stack. The memory size of the Java virtual machine stack can be set via-Xss. -
Native Method Stacks
Their functions and characteristics are similar to those of Java virtual machine stacks, but native method stacks serve native methods. -
Method Area
The method area is a JVM specification; both the permanent generation and the metaspace are implementations of it. After JDK 8, the original permanent generation data was split into the heap and the metaspace. The metaspace stores class metadata, while static variables and the string constant pool are placed in the heap. -
Heap
The heap region is shared by all threads, primarily used to store object instances and arrays. It can be physically non-contiguous but must be logically contiguous.
Heap memory is divided into the Young Generation and the Old Generation. The Young Generation is further divided into Eden and Survivor regions. The Survivor region consists of FromSpace and ToSpace. The Eden region occupies a large capacity, while the two Survivor regions occupy a small capacity, with a default ratio of 8:1:1.
If there is not enough memory in the Java heap to complete an instance allocation and the heap cannot be extended further, the Java Virtual Machine will throw anOutOfMemoryError. -
Runtime Constant Pool
The runtime constant pool is part of the method area. It is a table from which the virtual machine instructions find the class name, method name, parameter types, and other information to be executed. -
Direct Memory
Direct memory is not part of the virtual machine runtime data area, nor is it a memory region defined in the Java Virtual Machine specification. It is not limited by the Java heap size but is subject to the total native memory limit. Direct memory can also be specified using-XX:MaxDirectMemorySize. Allocating direct memory space incurs higher performance overhead, but direct memory I/O read/write performance is superior to ordinary heap memory. When memory is exhausted, it throws anOutOfMemoryError.
Thread
Java has two types of threads: User Threads and Daemon Threads.
- User threads can be understood as the system's working threads, which complete the business operations required by the application.
- Daemon threads are special threads that silently perform some systemic services in the background, such as garbage collection threads.
Threads in the JVM have the following states:
- NEW: A thread state that has not yet started execution.
- RUNNABLE: A thread state that is executing.
- BLOCKED: A thread state that is waiting for a monitor lock.
- WAITING: A thread state that is waiting indefinitely for another thread to perform a particular action.
- TIMED_WAITING: A thread state that is waiting for another thread to perform a particular action for a specified period.
- TERMINATED: A thread state that has terminated.
Performance Metrics
| Metric | Description | Data Type | Unit |
|---|---|---|---|
class_loaded_count |
Loaded class count. | int | count |
class_total_loaded_count |
Total loaded class count. | int | count |
class_total_unloaded_class_count |
Total unloaded class count. | int | count |
cpu_usage_percent |
CPU usage percentile. | float | percent |
gc_phrase_old/new_count |
GC old or new count. | int | count |
heap/stack_committed |
Heap or stack committed amount of memory. | int | count |
heap/stack_init |
Heap or stack initialized amount of memory. | int | count |
heap/stack_max |
Heap or stack max amount of memory. | int | count |
heap/stack_used |
Heap or stack used amount of memory. | int | count |
pool_*_committed |
Committed amount of memory in various pools (code_cache_usage, newgen_usage, oldgen_usage, survivor_usage, permgen_usage, metaspace_usage). |
int | count |
pool_*_init |
Initialized amount of memory in various pools (code_cache_usage, newgen_usage, oldgen_usage, survivor_usage, permgen_usage, metaspace_usage). |
int | count |
pool_*_max |
Max amount of memory in various pools (code_cache_usage, newgen_usage, oldgen_usage, survivor_usage, permgen_usage, metaspace_usage). |
int | count |
pool_*_used |
Used amount of memory in various pools (code_cache_usage, newgen_usage, oldgen_usage, survivor_usage, permgen_usage, metaspace_usage). |
int | count |
thread_blocked_state_count |
Blocked state thread count. | int | count |
thread_daemon_count |
Daemon thread count. | int | count |
thread_live_count |
Live thread count. | int | count |
thread_peak_count |
Peak thread count. | int | count |
thread_runnable_state_count |
Runnable state thread count. | int | count |
thread_time_waiting_state_count |
Timed waiting state thread count. | int | count |
thread_waiting_state_count |
Waiting state thread count. | int | count |
Prerequisites
- DataKit 1.4.17+ installed
Steps
1 Enable the Collector
Log in to the host where DataKit is installed, and copy the sample file.
If the deployed DataKit is not on the same host as the JAR file to be collected, modify localhost in the skywalking.conf line address = "localhost:11800" to the IP address of the host where the JAR is located.
In this example, the JAR and DataKit are on the same host, so metrics can be reported to the JVM via localhost without modifying the sample file.
2 Deploy the Application
Download the skywalking-demo project, open it with IntelliJ IDEA, click Package, and the skywalking-user-service.jar file will be generated.
Download Skywalking, extract it, and copy the agent directory to the same directory as skywalking-user-service.jar on the host.
Run the following command to start the application.
java  -javaagent:agent/skywalking-agent.jar \
-Dskywalking.agent.service_name=skywalking-user  \
-Dskywalking.collector.backend_service=localhost:11800 \
-jar skywalking-user-service.jar
3 JVM Observability
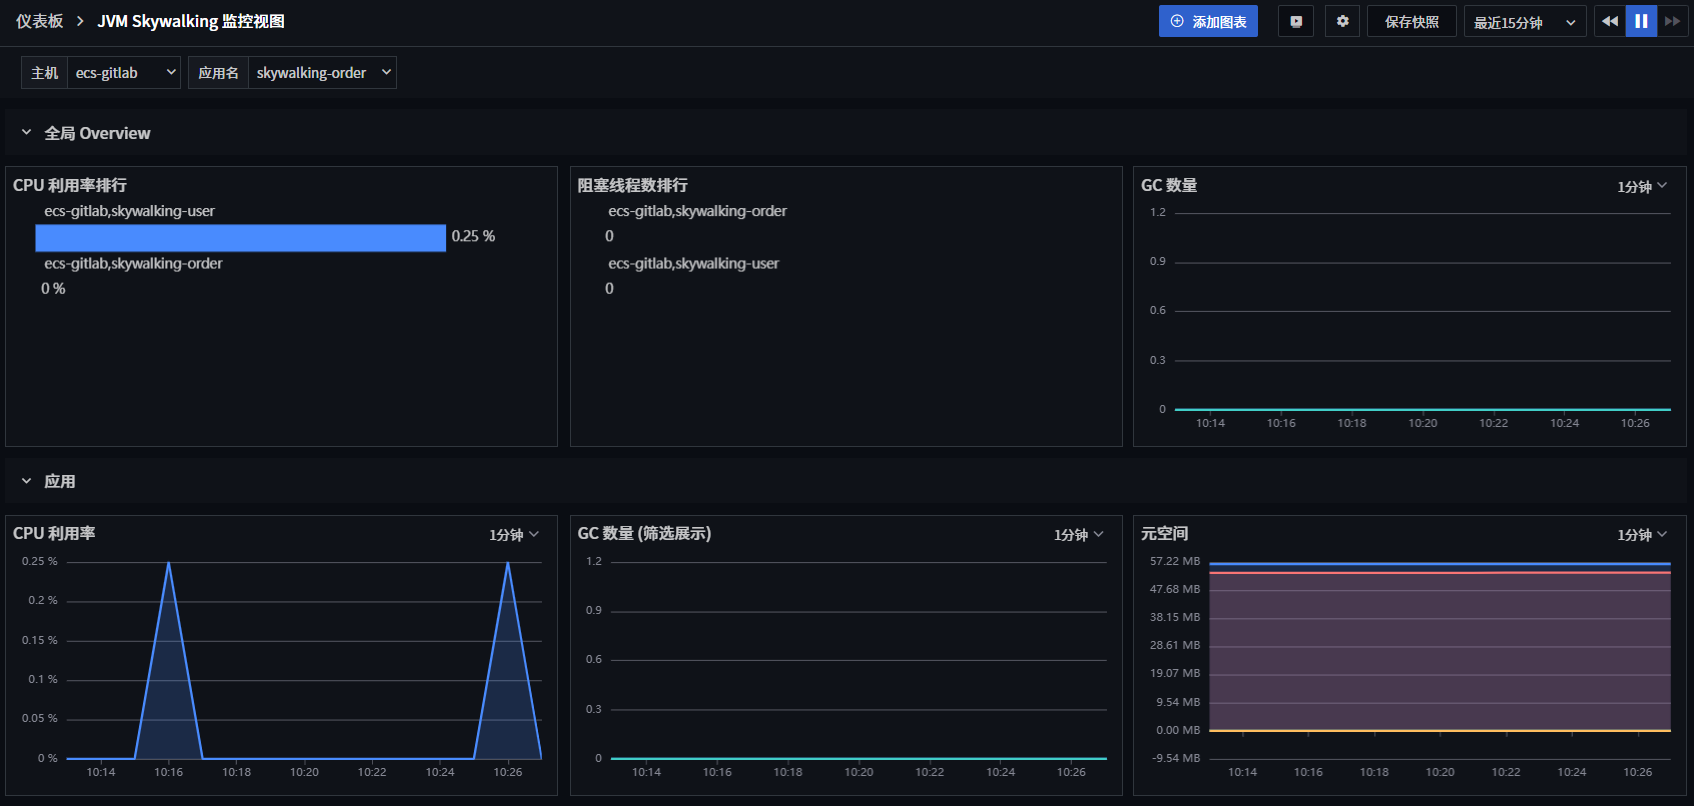
Log in to Guance, go to Scenarios, enter "JVM", select JVM Skywalking Monitoring View, and click OK.
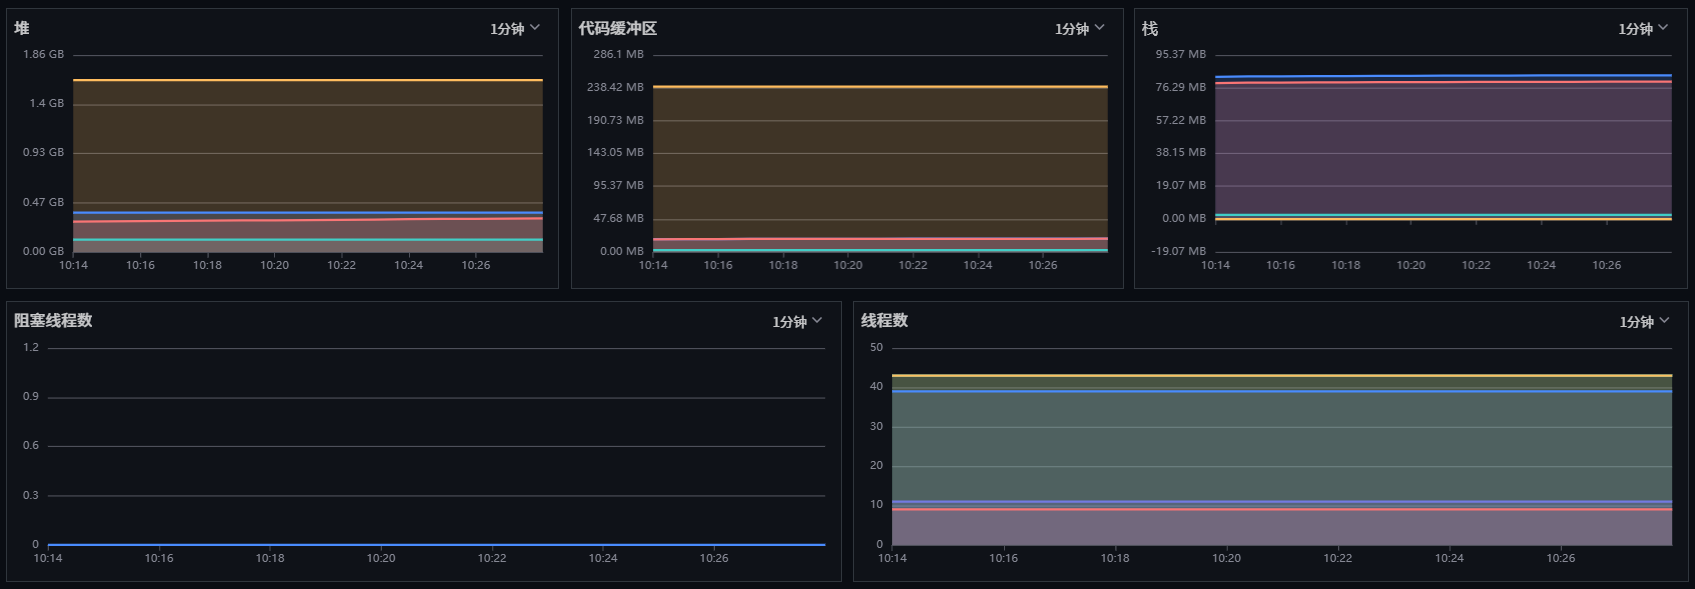
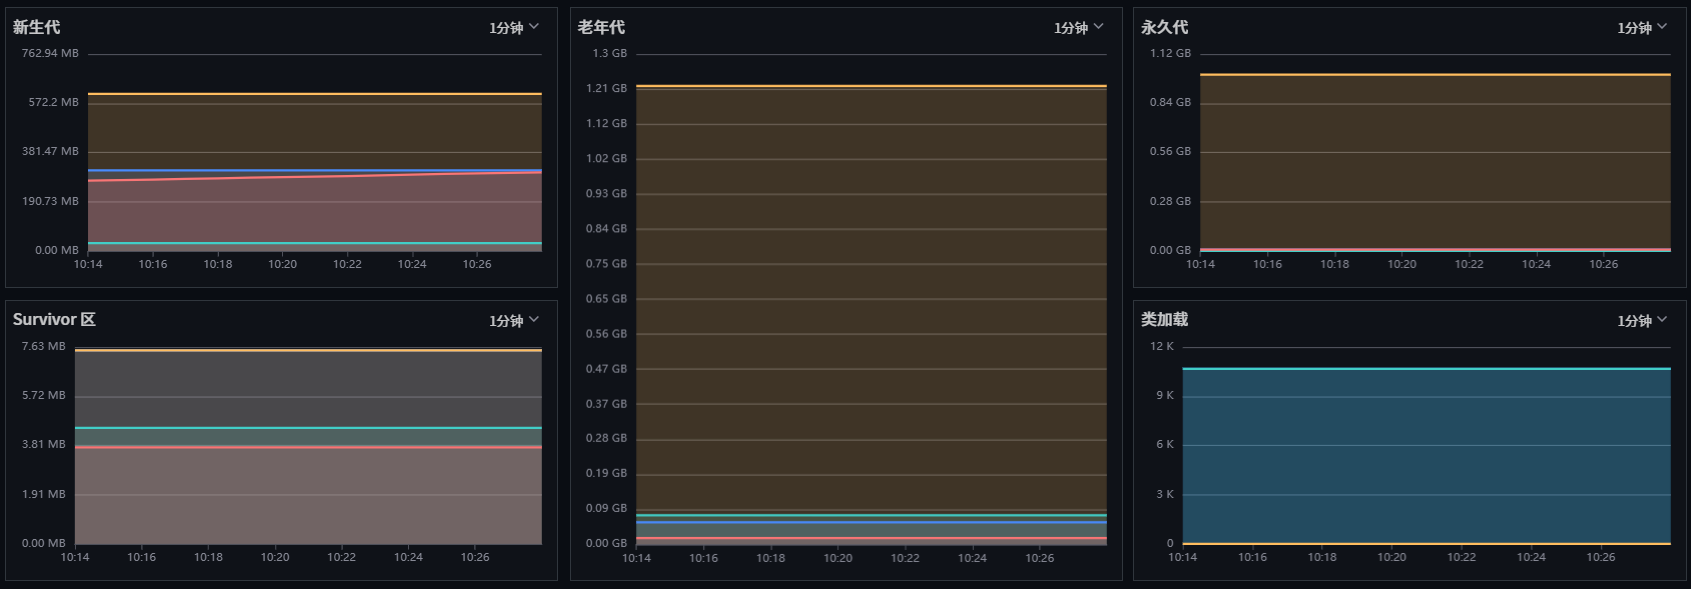
Then, click the newly created JVM Skywalking Monitoring View to start observing.