Correlated Analysis of RUM, APM, and Log for Kubernetes Applications
Use Case Overview
The most important source of revenue for an enterprise is its business, and today, most enterprises rely on their IT systems to support this business. Ensuring business stability ultimately boils down to ensuring the stability of the enterprise's internal IT systems. When business systems experience anomalies or failures, it often requires coordination across business, application development, and operations teams to troubleshoot the issue. This leads to cross-platform, cross-department, and cross-domain challenges, making troubleshooting time-consuming and labor-intensive.
To address this, the industry has developed a mature approach: using RUM + APM + LOG to provide unified monitoring of the frontend, backend, and logs of the entire business system, while connecting the three data sources through key fields for correlated analysis. This improves the efficiency of relevant personnel and ensures stable system operation.
- APM: Application Performance Monitoring
- RUM: Real User Monitoring
- LOG: Logs
This article explains how to integrate these three types of monitoring and how to perform correlated analysis using Guance. The demo application used is the RuoYi permission management system. For details, see <Building Observability for Spring Cloud Services from 0 to 1 with Guance>.
For logs, this article uses the DataKit Logfwd collector to collect logs from business Pods. DataKit enables the Logfwd collector, and the Pod adds a Logfwd Sidecar to collect logs from the business container and forward them to DataKit. Since the business can see the Sidecar, log files do not need to be written to the host. For detailed usage, see the Deploy System section below. After receiving logs, DataKit uses the configured Pipeline for log file parsing.
Prerequisites
Account Registration
Go to Guance to register an account and log in with your registered account/password.

Deploy DataKit via DaemonSet
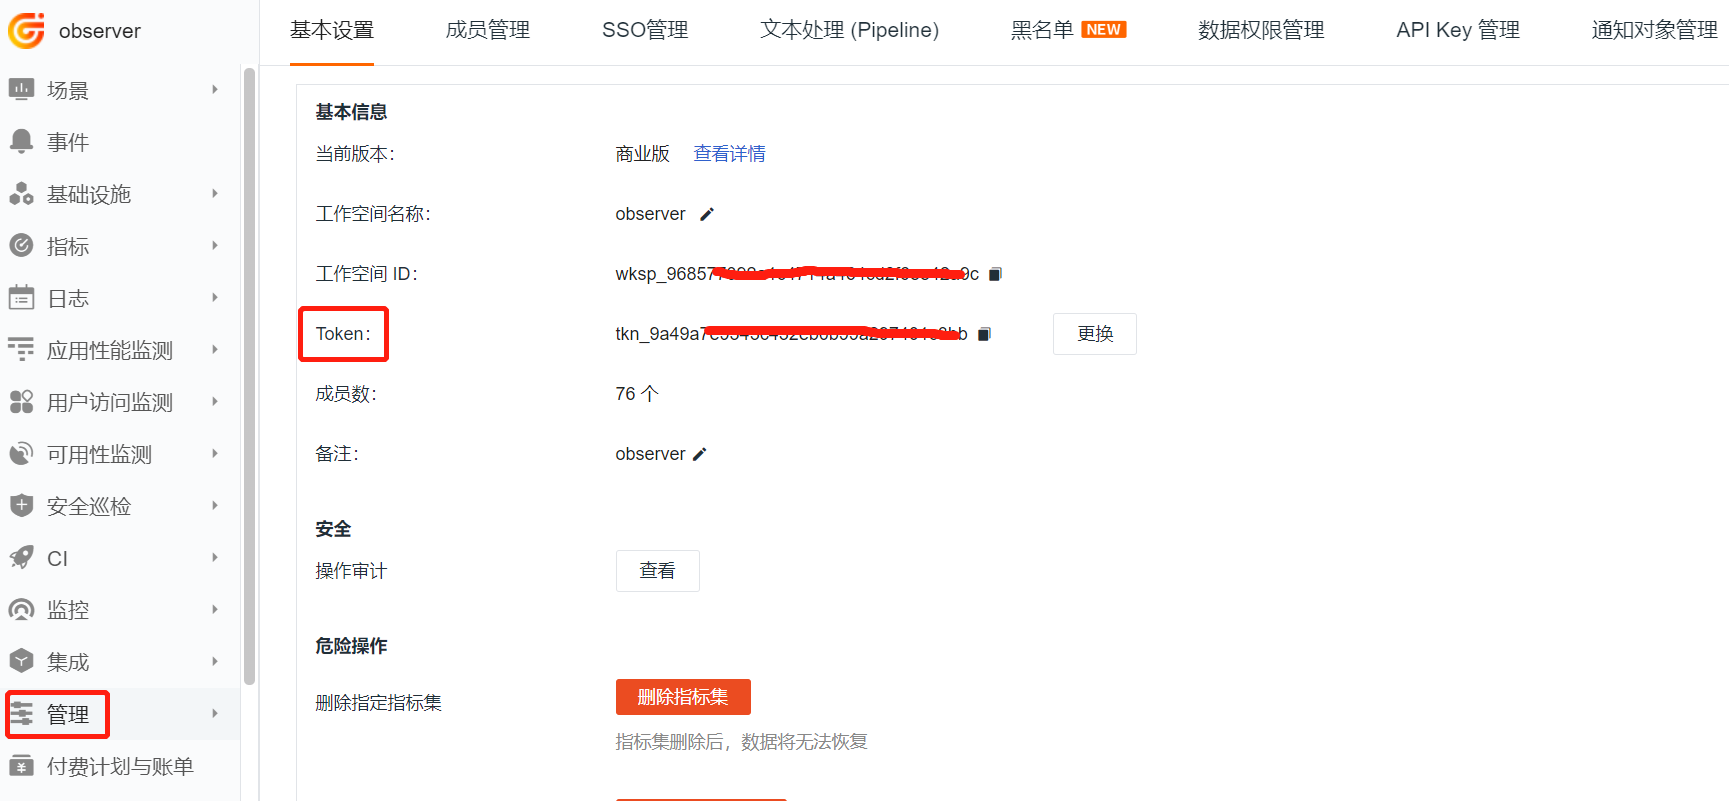
Get the Token from the OpenWay Address
Click Management → Basic Settings, and copy the token shown in the figure below.
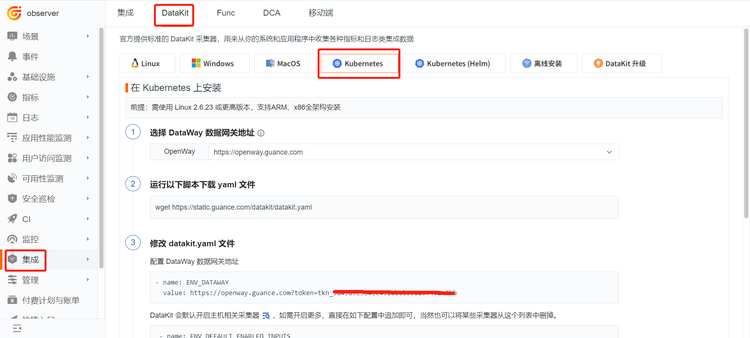
Click Integration → DataKit → Kubernetes, and obtain the latest datakit.yaml file.
Perform Installation
- Use the
datakit.yamlfile from the previous step and replaceyour-tokenin the file with the token obtained above. - Enable the container collector, logfwd collector, and ddtrace collector by mounting the
container.conf,logfwdserver.conf, andddtrace.conffiles in the DataKit container.
Note: Configuration may vary depending on the DataKit version. Always refer to the latest version. This yaml is the complete configuration for this deployment and already includes the subsequent steps for DataKit operations.
Complete yaml Content
apiVersion: v1
kind: Namespace
metadata:
  name: datakit
---
apiVersion: rbac.authorization.k8s.io/v1
kind: ClusterRole
metadata:
  name: datakit
rules:
  - apiGroups:
      - rbac.authorization.k8s.io
    resources:
      - clusterroles
    verbs:
      - get
      - list
      - watch
  - apiGroups:
      - ""
    resources:
      - nodes
      - nodes/proxy
      - namespaces
      - pods
      - pods/log
      - events
      - services
      - endpoints
    verbs:
      - get
      - list
      - watch
  - apiGroups:
      - apps
    resources:
      - deployments
      - daemonsets
      - statefulsets
      - replicasets
    verbs:
      - get
      - list
      - watch
  - apiGroups:
      - batch
    resources:
      - jobs
      - cronjobs
    verbs:
      - get
      - list
      - watch
  - apiGroups:
      - guance.com
    resources:
      - datakits
    verbs:
      - get
      - list
  - apiGroups:
      - metrics.k8s.io
    resources:
      - pods
      - nodes
    verbs:
      - get
      - list
  - nonResourceURLs: ["/metrics"]
    verbs: ["get"]

---
apiVersion: v1
kind: ServiceAccount
metadata:
  name: datakit
  namespace: datakit

---
apiVersion: v1
kind: Service
metadata:
  name: datakit-service
  namespace: datakit
spec:
  selector:
    app: daemonset-datakit
  ports:
    - protocol: TCP
      port: 9529
      targetPort: 9529

---
apiVersion: rbac.authorization.k8s.io/v1
kind: ClusterRoleBinding
metadata:
  name: datakit
roleRef:
  apiGroup: rbac.authorization.k8s.io
  kind: ClusterRole
  name: datakit
subjects:
  - kind: ServiceAccount
    name: datakit
    namespace: datakit

---
apiVersion: apps/v1
kind: DaemonSet
metadata:
  labels:
    app: daemonset-datakit
  name: datakit
  namespace: datakit
spec:
  revisionHistoryLimit: 10
  selector:
    matchLabels:
      app: daemonset-datakit
  template:
    metadata:
      labels:
        app: daemonset-datakit
    spec:
      hostNetwork: true
      dnsPolicy: ClusterFirstWithHostNet
      containers:
      - env:
        - name: HOST_IP
          valueFrom:
            fieldRef:
              apiVersion: v1
              fieldPath: status.hostIP
        - name: ENV_K8S_NODE_NAME
          valueFrom:
            fieldRef:
              apiVersion: v1
              fieldPath: spec.nodeName
        - name: ENV_DATAWAY
          value: https://openway.guance.com?token=XXXXXX
        - name: ENV_GLOBAL_HOST_TAGS # Non-election tags
          value: host=__datakit_hostname,host_ip=__datakit_ip,cluster_name_k8s=k8s-prod
        - name: ENV_DEFAULT_ENABLED_INPUTS
          value: cpu,disk,diskio,mem,swap,system,hostobject,net,host_processes,container,statsd,ebpf,rum
        - name: ENV_ENABLE_ELECTION
          value: enable
        - name: ENV_GLOBAL_ENV_TAGS # Only applies to election tags
          value: cluster_name_k8s=k8s-prod
        - name: ENV_HTTP_LISTEN
          value: 0.0.0.0:9529
        - name: ENV_NAMESPACE # For election
          value: guance-k8s-demo
        #- name: ENV_LOG_LEVEL
        #  value: debug
        #- name: ENV_K8S_CLUSTER_NAME
        #  value: k8s-prod
        image: pubrepo.guance.com/datakit/datakit:1.4.10
        imagePullPolicy: Always
        name: datakit
        ports:
        - containerPort: 9529
          hostPort: 9529
          name: port
          protocol: TCP
        securityContext:
          privileged: true
        volumeMounts:
        - mountPath: /var/run
          name: run
        - mountPath: /var/lib
          name: lib
        - mountPath: /var/log
          name: log
        #- mountPath: /var/run/containerd/containerd.sock
        #  name: containerd-socket
        #  readOnly: true
        - mountPath: /usr/local/datakit/conf.d/container/container.conf
          name: datakit-conf
          subPath: container.conf
        - mountPath: /usr/local/datakit/conf.d/log/logfwdserver.conf
          name: datakit-conf
          subPath: logfwdserver.conf
        - mountPath: /usr/local/datakit/conf.d/ddtrace/ddtrace.conf
          name: datakit-conf
          subPath: ddtrace.conf
        - mountPath: /host/proc
          name: proc
          readOnly: true
        - mountPath: /host/dev
          name: dev
          readOnly: true
        - mountPath: /host/sys
          name: sys
          readOnly: true
        - mountPath: /rootfs
          name: rootfs
        - mountPath: /sys/kernel/debug
          name: debugfs

        workingDir: /usr/local/datakit
      hostIPC: true
      hostPID: true
      restartPolicy: Always
      serviceAccount: datakit
      serviceAccountName: datakit
      tolerations:
        - operator: Exists
      volumes:
        - configMap:
            name: datakit-conf
          name: datakit-conf
        - hostPath:
            path: /var/run
          name: run
        - hostPath:
            path: /var/lib
          name: lib
        - hostPath:
            path: /var/log
          name: log

        - hostPath:
            path: /proc
            type: ""
          name: proc
        - hostPath:
            path: /dev
            type: ""
          name: dev
        - hostPath:
            path: /sys
            type: ""
          name: sys
        - hostPath:
            path: /
            type: ""
          name: rootfs
        - hostPath:
            path: /sys/kernel/debug
            type: ""
          name: debugfs
  updateStrategy:
    rollingUpdate:
      maxUnavailable: 1
    type: RollingUpdate
---
apiVersion: v1
kind: ConfigMap
metadata:
  name: datakit-conf
  namespace: datakit
data:
  #### container
  container.conf: |-
    [inputs.container]
      docker_endpoint = "unix:///var/run/docker.sock"
      containerd_address = "/var/run/containerd/containerd.sock"

      enable_container_metric = true
      enable_k8s_metric = true
      enable_pod_metric = true

      ## Containers logs to include and exclude, default collect all containers. Globs accepted.
      container_include_log = []
      container_exclude_log = ["image:*"]
      #container_exclude_log = ["image:pubrepo.guance.com/datakit/logfwd*", "image:pubrepo.guance.com/datakit/datakit*"]

      exclude_pause_container = true

      ## Removes ANSI escape codes from text strings
      logging_remove_ansi_escape_codes = false

      kubernetes_url = "https://kubernetes.default:443"

      ## Authorization level:
      ##   bearer_token -> bearer_token_string -> TLS
      ## Use bearer token for authorization. ('bearer_token' takes priority)
      ## linux at:   /run/secrets/kubernetes.io/serviceaccount/token
      ## windows at: C:\var\run\secrets\kubernetes.io\serviceaccount\token
      bearer_token = "/run/secrets/kubernetes.io/serviceaccount/token"
      # bearer_token_string = "<your-token-string>"

      [inputs.container.tags]
        # some_tag = "some_value"
        # more_tag = "some_other_value"

  #### ddtrace
  ddtrace.conf: |-
    [[inputs.ddtrace]]
      endpoints = ["/v0.3/traces", "/v0.4/traces", "/v0.5/traces"]
      # ignore_resources = []
      customer_tags = ["node_ip"]
      [inputs.ddtrace.close_resource]
        "*" = ["PUT /nacos/*","GET /nacos/*","POST /nacos/*"]
      ## tags is ddtrace configed key value pairs
      # [inputs.ddtrace.tags]
        # some_tag = "some_value"
        # more_tag = "some_other_value"

  #### logfwdserver
  logfwdserver.conf: |-
    [inputs.logfwdserver]
      ## logfwd receiver listening address and port
      address = "0.0.0.0:9531"

      [inputs.logfwdserver.tags]
      # some_tag = "some_value"
      # more_tag = "some_other_value"
To distinguish election among DataKits deployed via DaemonSet in different Kubernetes clusters, add the ENV_NAMESPACE environment variable. The value must be unique under the same token.
To distinguish different Kubernetes clusters under the same token, add a global tag with the value cluster_name_k8s=k8s-prod.
For details, see <Best Practices for Multi-Cluster Kubernetes Metrics Collection>
Execute the command:

After DataKit is installed, the common Linux host plugins are enabled by default. You can view them in the Guance → Scenarios → Infrastructure Linux Host Monitoring View.
| Collector Name | Description |
|---|---|
| cpu | Collects CPU usage of the host |
| disk | Collects disk usage |
| diskio | Collects disk I/O of the host |
| mem | Collects memory usage of the host |
| swap | Collects swap memory usage |
| system | Collects host operating system load |
| net | Collects network traffic of the host |
| host_process | Collects the list of long-running processes (alive >10 min) on the host |
| hostobject | Collects basic host information (e.g., OS, hardware) |
| kubernetes | Collects Kubernetes cluster metrics |
| container | Collects container objects and container logs on the host |
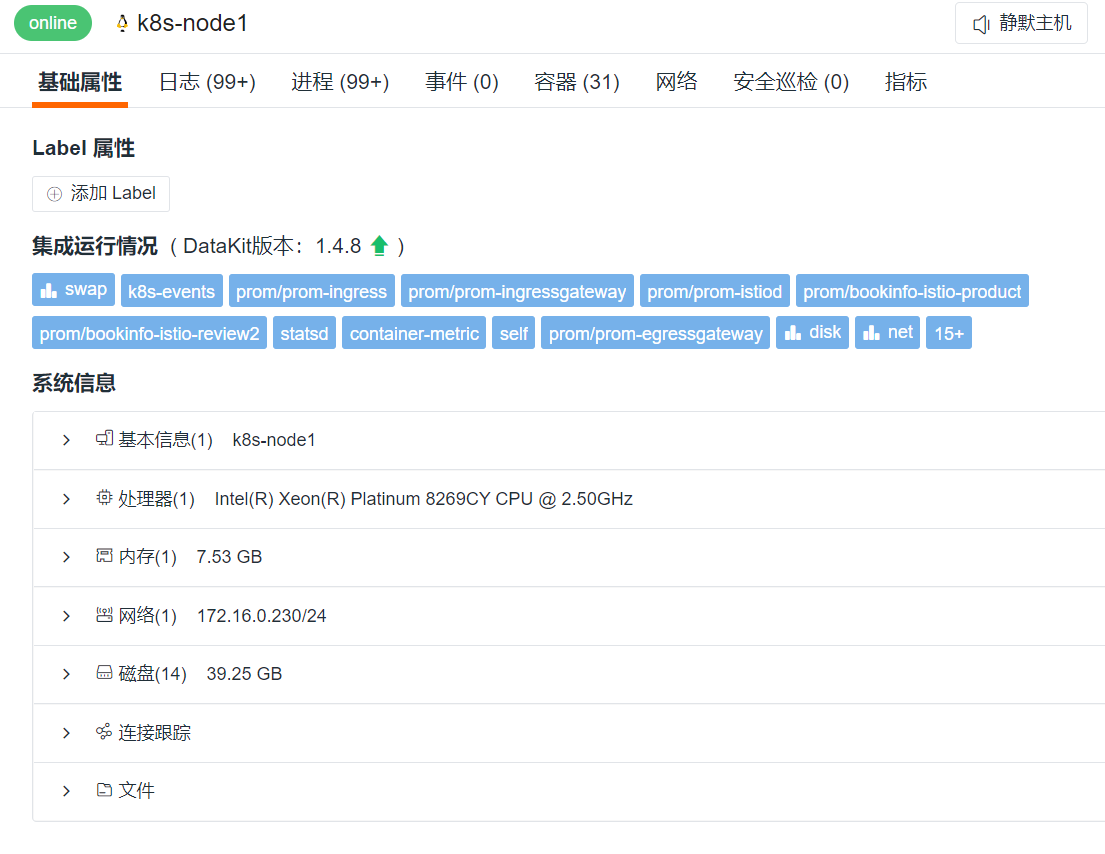
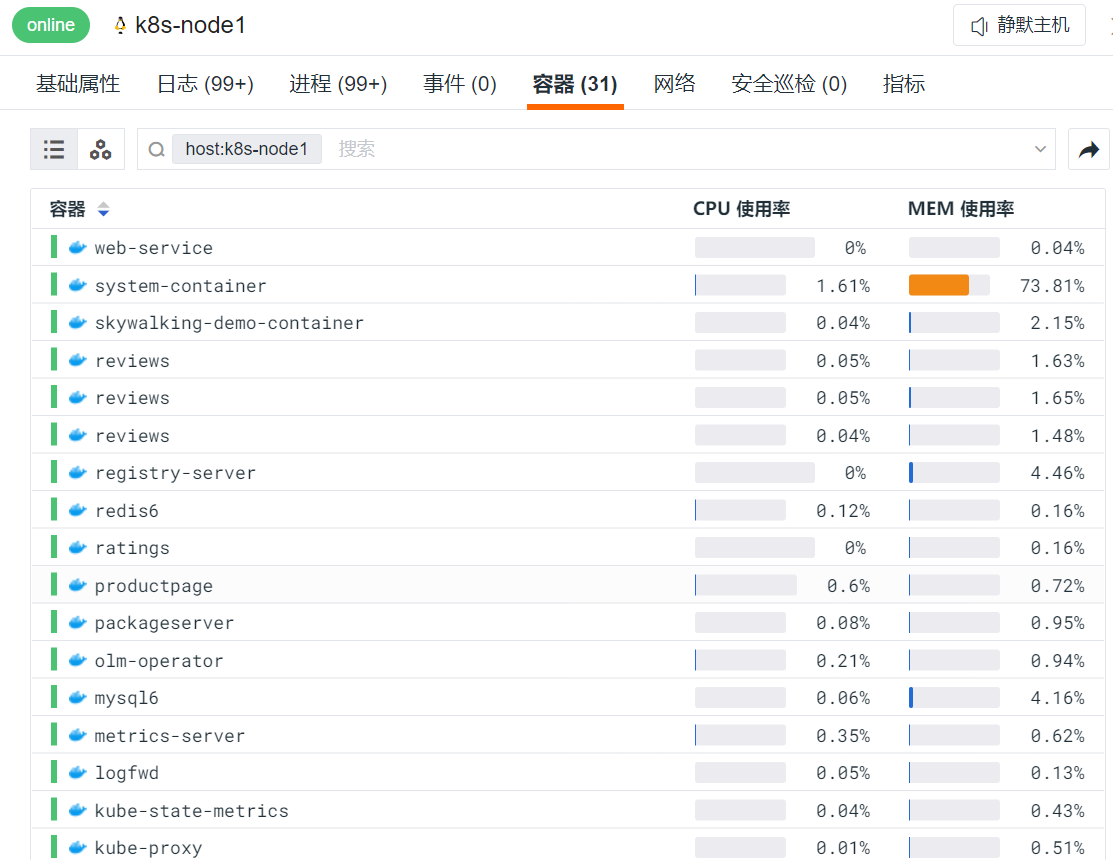
Click the Infrastructure module to view the list of all hosts where DataKit is installed.
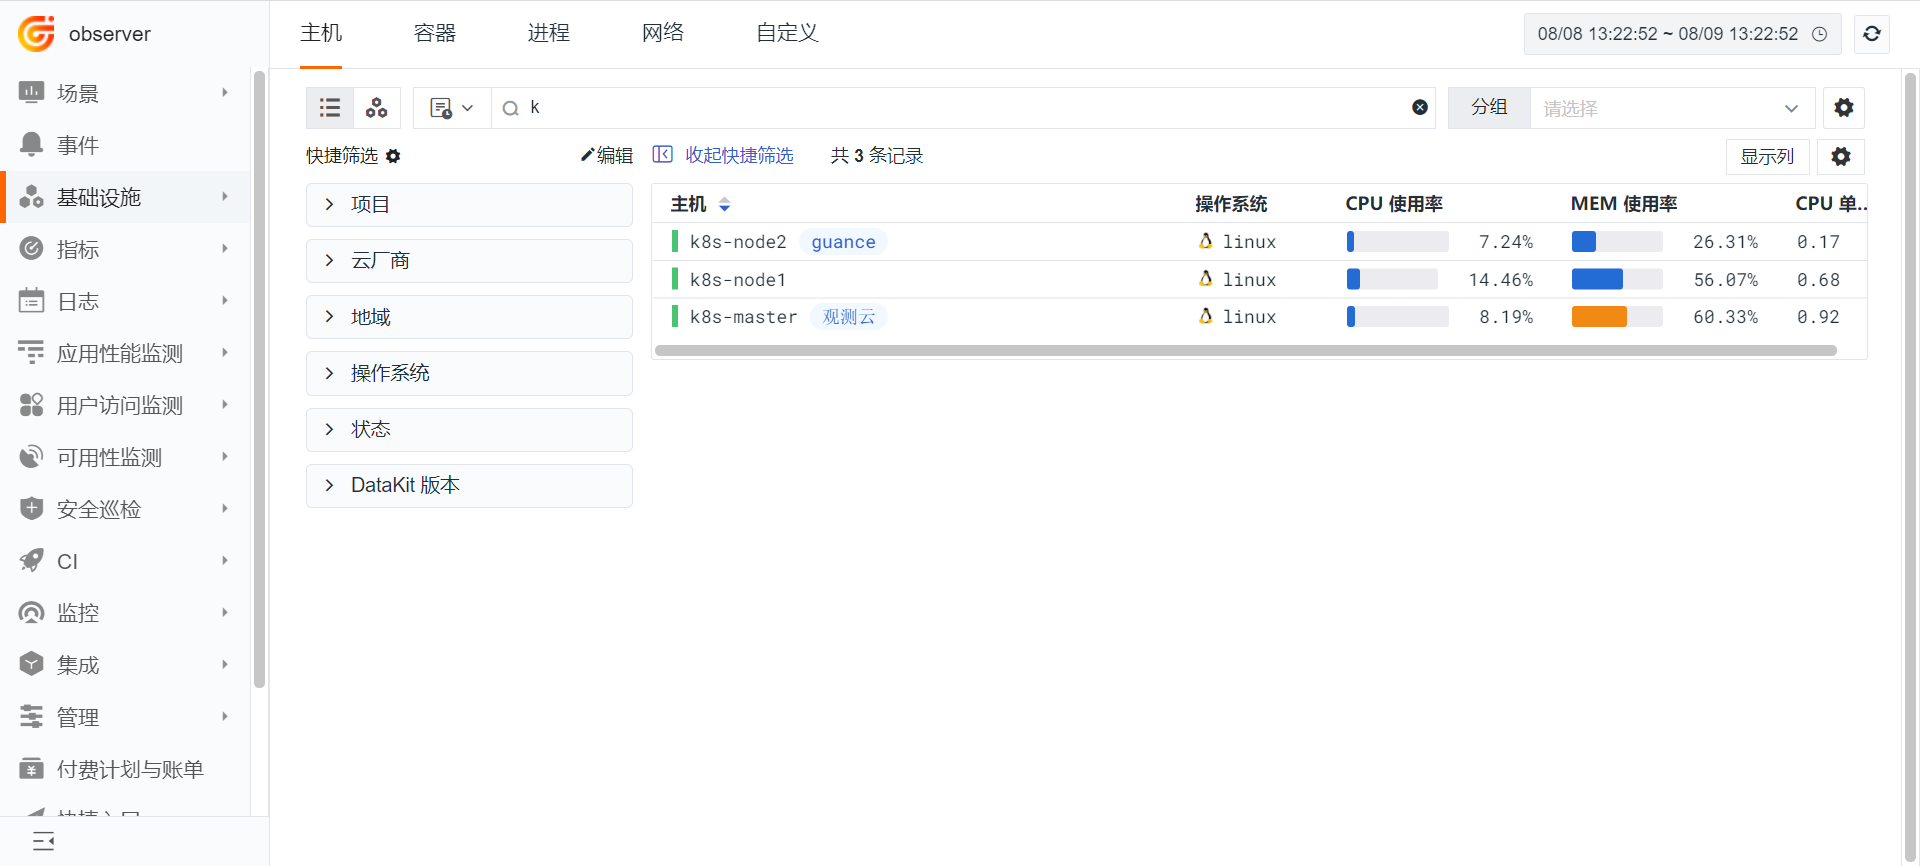
Click Host Name to view the detailed system information of the host and the running status of integrations (all installed plugins on that host).
Deploy the Sample Application
Sample Description
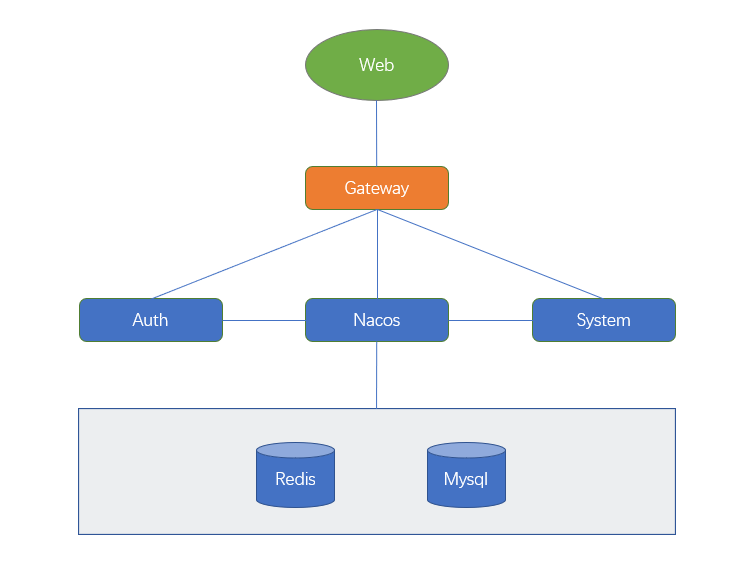
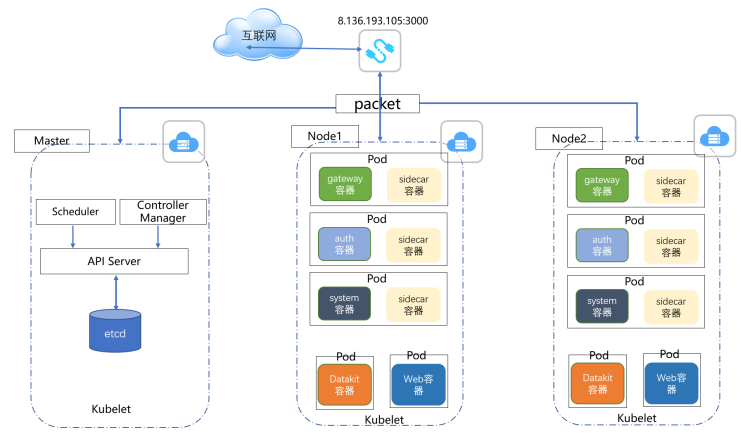
The Web layer accesses the backend Auth and System services through a gateway. The Web is developed using Vue, and the backend is developed using Java.
In this example, Statsd is enabled to collect JVM metrics. The image registry used is 172.16.0.215:5000. ddtrace is used to collect JVM metrics from Java applications. The internal IPs of Nacos, Redis, and MySQL used are 172.16.0.230.
Create the Web Deployment File
Copy the Web application content to the /usr/local/k8s/dist directory.

Create the file /usr/local/k8s/DockerfileWeb.
Content:
FROM nginx:1.21.0
RUN /bin/cp /usr/share/zoneinfo/Asia/Shanghai /etc/localtime
RUN echo 'Asia/Shanghai' >/etc/timezone

COPY nginx.conf /etc/nginx/nginx.conf
RUN mkdir -p /data/nginx/web/dist/
COPY ./dist/ /data/nginx/web/dist/
WORKDIR /etc/nginx
CMD ["nginx","-g","daemon off;"]
EXPOSE 80
EXPOSE 443
Create /usr/local/k8s/nginx.conf with the following content:
/usr/local/k8s/nginx.conf
events {
    worker_connections  1024;
}

http {
    include       mime.types;
    default_type  application/octet-stream;

    sendfile        on;
    #tcp_nopush     on;

    client_max_body_size  50m;
    #keepalive_timeout  0;
    keepalive_timeout  65;
    #gzip  on;
    server {
        listen       80;
        server_name  localhost;

        location / {
            root  /data/nginx/web/dist;
            index  index.html index.htm;
            try_files $uri $uri/ /index.html;
        }

            location /prod-api/{
            proxy_set_header Host $http_host;
            proxy_set_header X-Real-IP $remote_addr;
            proxy_set_header REMOTE-HOST $remote_addr;
            proxy_set_header X-Forwarded-For $proxy_add_x_forwarded_for;
            proxy_pass http://172.16.0.229:30001/;
        }

        location /nginx_status{
            stub_status;
        }

        #error_page  404              /404.html;

        # redirect server error pages to the static page /50x.html
        #
        error_page   500 502 503 504  /50x.html;
        location = /50x.html {
            root   html;
        }
    }
}
Create /usr/local/k8s/web-deployment.yaml with the following content:
/usr/local/k8s/web-deployment.yaml
apiVersion: v1
kind: Service
metadata:
  name: web-service
  labels:
    app: web-service
spec:
  selector:
    app: web-service
  ports:
    - protocol: TCP
      port: 80
      nodePort: 30000
      targetPort: 80
  type: NodePort
---
apiVersion: apps/v1
kind: Deployment
metadata:
  name: web-service
  labels:
    app: web-service
spec:
  replicas: 1
  selector:
    matchLabels:
      app: web-service
  template:
    metadata:
      labels:
        app: web-service
    spec:
      containers:
      - env:
        - name: POD_NAME
          valueFrom:
            fieldRef:
              fieldPath: metadata.name

        name: web-service
        image: 47.96.6.150:5000/df-demo/demo-web:v1
        #command: ["sh","-c"]
        ports:
        - containerPort: 80
          protocol: TCP
dd-java-agent Image
When using the java -jar approach to start the user's jar, you need to use -javaagent:/usr/local/datakit/data/dd-java-agent.jar. However, this jar may not exist in the user's image. To avoid modifying the customer's business image, we create an image containing dd-java-agent.jar and use it as an Init container that starts before the business container, providing the jar via shared storage.
Guance provides this image.
This example uses the Sidecar approach. If you want to embed the jar directly into the image, download dd-java-agent and include the following script in your Dockerfile to embed the jar into the image. Then change the jar path in the -javaagent parameter in the deployment yaml accordingly.
FROM openjdk:8u292

ENV workdir /data/app/
RUN mkdir -p ${workdir}

COPY  dd-java-agent.jar ${workdir}  # Embed dd-java-agent into the image
Create the Gateway Deployment File
Create /usr/local/k8s/DockerfileGateway
Content:
FROM openjdk:8u292
RUN /bin/cp /usr/share/zoneinfo/Asia/Shanghai /etc/localtime
RUN echo 'Asia/Shanghai' >/etc/timezone
ENV jar demo-gateway.jar
ENV workdir /data/app/
RUN mkdir -p ${workdir}
COPY ${jar} ${workdir}
WORKDIR ${workdir}
ENTRYPOINT ["sh", "-ec", "exec java ${JAVA_OPTS} -jar ${jar} ${PARAMS} 2>&1 > /dev/null"]
Create /usr/local/k8s/gateway-deployment.yaml with the following content:
/usr/local/k8s/gateway-deployment.yaml
apiVersion: v1
kind: Service
metadata:
  name: gateway-service
  labels:
    app: gateway-service
spec:
  selector:
    app: gateway-service
  ports:
    - protocol: TCP
      port: 9299
      nodePort: 30001
      targetPort: 9299
  type: NodePort
---
apiVersion: apps/v1
kind: Deployment
metadata:
  name: gateway-service
  labels:
    app: gateway-service
spec:
  replicas: 2
  selector:
    matchLabels:
      app: gateway-service
  template:
    metadata:
      labels:
        app: gateway-service
    spec:
      containers:
      - env:
        - name: DD_AGENT_HOST
          valueFrom:
            fieldRef:
              apiVersion: v1
              fieldPath: status.hostIP
        - name: POD_NAME
          valueFrom:
            fieldRef:
              fieldPath: metadata.name
        - name: NACOS_IP
          value: "172.16.0.230"
        - name: JAVA_OPTS
          value: |-
            -javaagent:/usr/dd-java-agent/agent/dd-java-agent.jar -Ddd.service.name=demo-k8s-gateway  -Ddd.tags=container_host:$(POD_NAME),node_ip:$(DD_AGENT_HOST) -Ddd.service.mapping=redis:redisk8s -Ddd.env=dev -Ddd.agent.port=9529
        - name: PARAMS
          value: "--spring.redis.host=$(NACOS_IP) --spring.nacos.ip=$(NACOS_IP)"
        name: gateway-service
        image: 47.96.6.150:5000/df-demo/demo-gateway:v1
        #command: ["sh","-c"]
        ports:
        - containerPort: 9299
          protocol: TCP
        volumeMounts:
        - mountPath: /usr/dd-java-agent/agent
          name: ddagent
      initContainers:
      - command:
        - sh
        - -c
        - set -ex;mkdir -p /ddtrace/agent;cp -r /datadog-init/* /ddtrace/agent;
        image: pubrepo.guance.com/datakit-operator/dd-lib-java-init
        imagePullPolicy: Always
        name: ddtrace-agent-sidecar
        volumeMounts:
        - mountPath: /ddtrace/agent
          name: ddagent
      restartPolicy: Always
      volumes:
      - emptyDir: {}
        name: ddagent
Create the Auth Deployment File
Create /usr/local/k8s/DockerfileAuth
Content:
FROM openjdk:8u292
RUN /bin/cp /usr/share/zoneinfo/Asia/Shanghai /etc/localtime
RUN echo 'Asia/Shanghai' >/etc/timezone
ENV jar demo-auth.jar
ENV workdir /data/app/
RUN mkdir -p ${workdir}
COPY ${jar} ${workdir}
WORKDIR ${workdir}
ENTRYPOINT ["sh", "-ec", "exec java ${JAVA_OPTS} -jar ${jar} ${PARAMS} 2>&1 > /dev/null"]
Create /usr/local/k8s/auth-deployment.yaml with the following content:
/usr/local/k8s/auth-deployment.yaml
apiVersion: v1
kind: Service
metadata:
  name: auth-service
  labels:
    app: auth-service
spec:
  selector:
    app: auth-service
  ports:
    - protocol: TCP
      port: 9200
      targetPort: 9200
  type: NodePort
---
apiVersion: apps/v1
kind: Deployment
metadata:
  name: auth-service
  labels:
    app: auth-service
spec:
  replicas: 2
  selector:
    matchLabels:
      app: auth-service
  template:
    metadata:
      labels:
        app: auth-service
    spec:
      containers:
      - env:
        - name: DD_AGENT_HOST
          valueFrom:
            fieldRef:
              apiVersion: v1
              fieldPath: status.hostIP
        - name: POD_NAME
          valueFrom:
            fieldRef:
              fieldPath: metadata.name
        - name: NACOS_IP
          value: "172.16.0.230"
        - name: JAVA_OPTS
          value: |-
            -javaagent:/usr/dd-java-agent/agent/dd-java-agent.jar -Ddd.service.name=demo-k8s-auth  -Ddd.tags=container_host:$(POD_NAME),node_ip:$(DD_AGENT_HOST) -Ddd.service.mapping=redis:redisk8s -Ddd.env=dev -Ddd.agent.port=9529
        - name: PARAMS
          value: "--spring.redis.host=$(NACOS_IP) --spring.nacos.ip=$(NACOS_IP)"
        name: auth-service
        image: 47.96.6.150:5000/df-demo/demo-auth:v1
        #command: ["sh","-c"]
        ports:
        - containerPort: 9200
          protocol: TCP
        volumeMounts:
        - mountPath: /usr/dd-java-agent/agent
          name: ddagent
      initContainers:
      - command:
        - sh
        - -c
        - set -ex;mkdir -p /ddtrace/agent;cp -r /datadog-init/* /ddtrace/agent;
        image: pubrepo.guance.com/datakit-operator/dd-lib-java-init
        imagePullPolicy: Always
        name: ddtrace-agent-sidecar
        volumeMounts:
        - mountPath: /ddtrace/agent
          name: ddagent
      restartPolicy: Always
      volumes:
      - emptyDir: {}
        name: ddagent
Create the System Deployment File
Create /usr/local/k8s/DockerfileSystem
Content:
FROM openjdk:8u292
RUN /bin/cp /usr/share/zoneinfo/Asia/Shanghai /etc/localtime
RUN echo 'Asia/Shanghai' >/etc/timezone
ENV jar demo-modules-system.jar
ENV workdir /data/app/
RUN mkdir -p ${workdir}
COPY ${jar} ${workdir}
WORKDIR ${workdir}

ENTRYPOINT ["sh", "-ec", "exec java ${JAVA_OPTS}   -jar ${jar} ${PARAMS}  2>&1 > /dev/null"]
Create /usr/local/k8s/system-deployment.yaml. The Pod uses three images: 172.16.0.238/df-ruoyi/demo-system:v1, pubrepo.guance.com/datakit/logfwd:1.2.7, and pubrepo.guance.com/datakit-operator/dd-lib-java-init.
The dd-lib-java-init image provides the dd-java-agent.jar file for the system-container business container. The logfwd container collects log files from the business container. The logfwd configuration is mounted into the container via a ConfigMap, specifying the log file paths, source name, etc.
Complete content of system-deployment.yaml:
system-deployment.yaml
apiVersion: v1
kind: Service
metadata:
  name: system-service
spec:
  selector:
    app: system-pod
  ports:
    - protocol: TCP
      port: 9201
      #nodePort: 30001
      targetPort: 9201
  type: NodePort
---
apiVersion: apps/v1
kind: Deployment
metadata:
  name: system-deployment
  #labels:
  #  app: system-deployment
spec:
  replicas: 1
  selector:
    matchLabels:
      app: system-pod
  template:
    metadata:
      labels:
        app: system-pod
    spec:
      containers:
      - name: system-container
        env:
        - name: POD_NAME
          valueFrom:
            fieldRef:
              fieldPath: metadata.name
        - name: DD_AGENT_HOST
          valueFrom:
            fieldRef:
              apiVersion: v1
              fieldPath: status.hostIP
        - name: NACOS_IP
          value: "172.16.0.229"
        - name: DB_IP
          value: "172.16.0.230"
        - name: JAVA_OPTS
          value: |-
            -javaagent:/usr/dd-java-agent/agent/dd-java-agent.jar -Ddd.service.name=demo-k8s-system  -Ddd.tags=container_host:$(POD_NAME),node_ip:$(DD_AGENT_HOST) -Ddd.service.mapping=mysql:mysql-k8s,redis:redisk8s -Ddd.env=dev -Ddd.agent.port=9529
        - name: PARAMS
          value: "--spring.redis.host=$(DB_IP) --spring.nacos.ip=$(NACOS_IP) --spring.db.ip=$(DB_IP)"
        image: 172.16.0.238/df-ruoyi/demo-system:v1
        #command: ["sh","-c"]
        ports:
        - containerPort: 9201
          protocol: TCP
        volumeMounts:
        - name: ddagent
          mountPath: /usr/dd-java-agent/agent
        - name: varlog
          mountPath: /data/app/logs/ruoyi-system
        resources:
          limits:
            memory: 512Mi
          requests:
            memory: 256Mi
      - name: logfwd
        image: pubrepo.guance.com/datakit/logfwd:1.2.7
        env:
        - name: LOGFWD_DATAKIT_HOST
          valueFrom:
            fieldRef:
              apiVersion: v1
              fieldPath: status.hostIP
        - name: LOGFWD_DATAKIT_PORT
          value: "9531"
        - name: LOGFWD_LOGFWD_ANNOTATION_DATAKIT_LOG_CONFIGS
          valueFrom:
            fieldRef:
              apiVersion: v1
              fieldPath: metadata.annotations['datakit/log']
        - name: LOGFWD_POD_NAME
          valueFrom:
            fieldRef:
              apiVersion: v1
              fieldPath: metadata.name
        - name: LOGFWD_POD_NAMESPACE
          valueFrom:
            fieldRef:
              apiVersion: v1
              fieldPath: metadata.namespace
        volumeMounts:
        - mountPath: /var/log
          name: varlog
        - mountPath: /opt/logfwd/config
          name: logfwd-config
          subPath: config
      initContainers:
      - name: ddtrace-agent-sidecar
        command:
        - sh
        - -c
        - set -ex;mkdir -p /ddtrace/agent;cp -r /datadog-init/* /ddtrace/agent;
        image: pubrepo.guance.com/datakit-operator/dd-lib-java-init
        imagePullPolicy: Always
        volumeMounts:
        - mountPath: /ddtrace/agent
          name: ddagent
      restartPolicy: Always
      volumes:
      - name: varlog
        emptyDir: {}
      - name: ddagent
        emptyDir: {}
      - configMap:
          name: logfwd-conf
        name: logfwd-config

---

apiVersion: v1
kind: ConfigMap
metadata:
  name: logfwd-conf
data:
  config: |
    [
        {
            "loggings": [
                {
                    "logfiles": ["/var/log/info.log","/var/log/error.log"],
                    "source": "k8s-log-system",
                    "multiline_match": "^\\d{4}-\\d{2}-\\d{2}"
                }
            ]
        }
    ]
Additionally, the system-deployment.yaml file uses environment variables to specify the DataKit and logfwd ports.
Environment variable descriptions:
- LOGFWD_DATAKIT_HOST: DataKit address
- LOGFWD_DATAKIT_PORT: logfwd port
logfwd-conf parameter descriptions:
- logfiles: List of log file paths.
- ignore: File path filtering using glob rules. Files matching any filter condition will not be collected.
- source: Data source.
- service: Additional tag. If empty, defaults to $source.
- pipeline: Path to the pipeline script.
- character_encoding: Character encoding.
- multiline_match: Multi-line matching pattern.
- remove_ansi_escape_codes: Whether to remove ANSI escape codes (e.g., text colors in stdout). Values: true or false.
Add the node_ip Tag to Trace Data
Add the following to the ConfigMap in datakit.yaml:
ddtrace.conf: |-
  [[inputs.ddtrace]]
    endpoints = ["/v0.3/traces", "/v0.4/traces", "/v0.5/traces"]
    # ignore_resources = []
    customer_tags = ["node_ip"]
Add the following under volumeMounts:
- mountPath: /usr/local/datakit/conf.d/ddtrace/ddtrace.conf
  name: datakit-conf
  subPath: ddtrace.conf
Real User Monitoring (RUM)
Create an Application
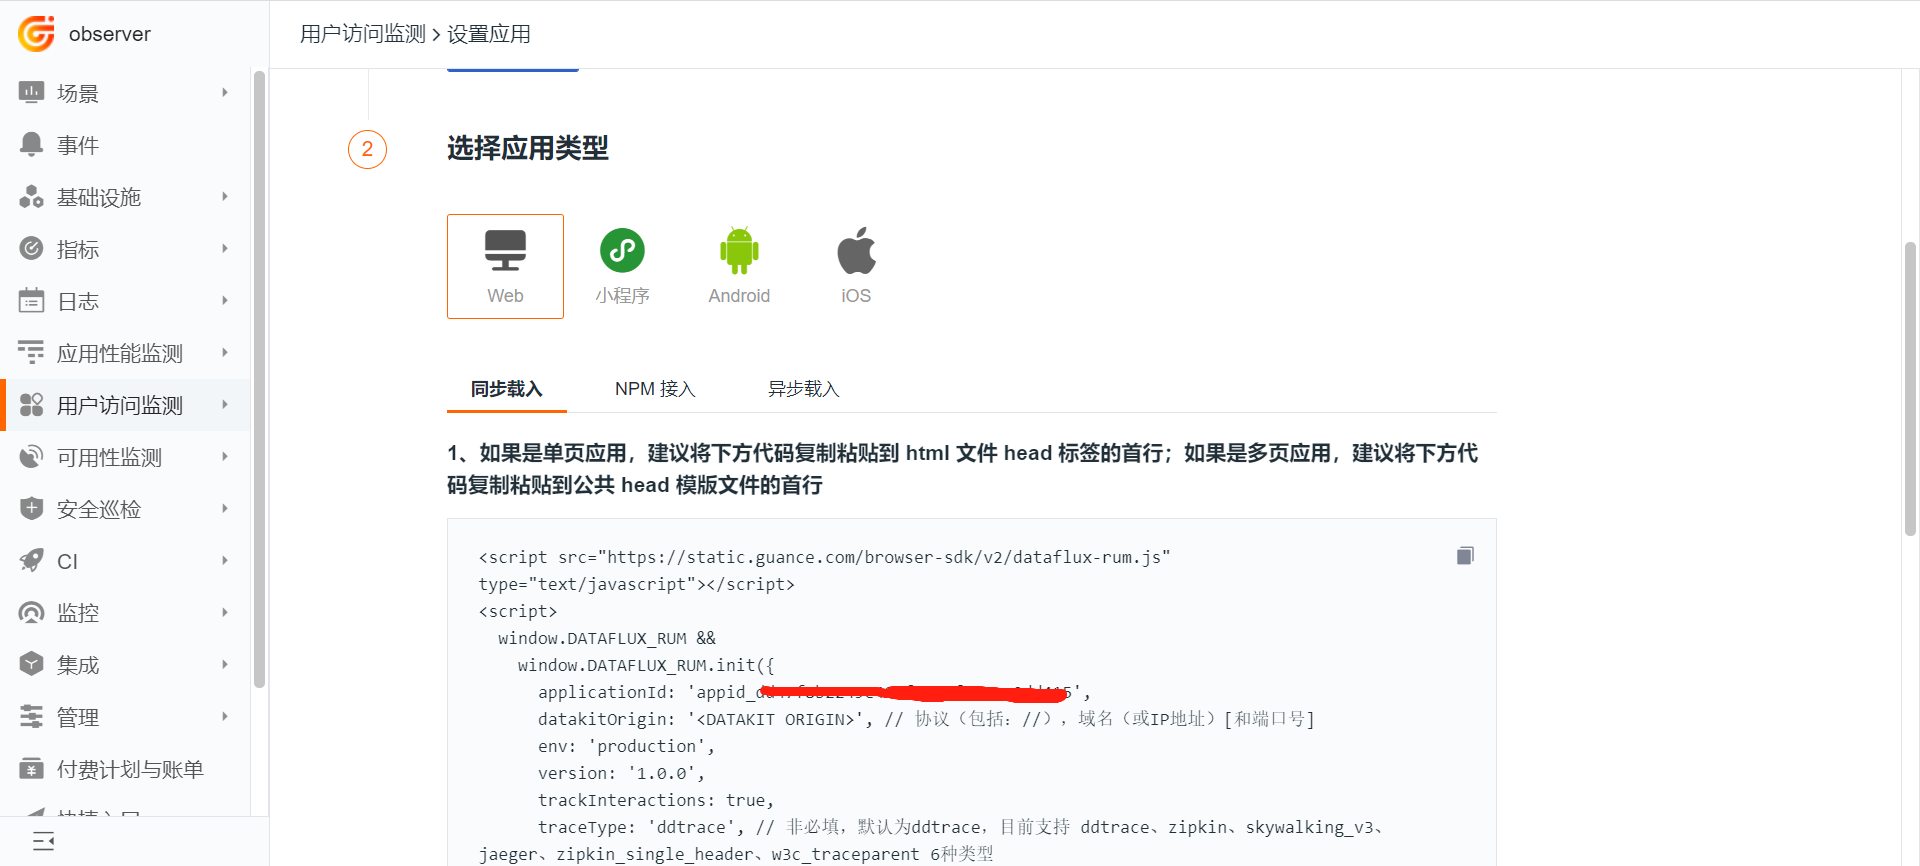
Log in to the Guance platform, select Real User Monitoring → Create Application → Select Web Type → Synchronous Load, and enter the application name web-k8s-demo.
Enable Frontend RUM Monitoring
DataKit enables the RUM collector by adding rum at the end of the ENV_DEFAULT_ENABLED_INPUTS environment variable value.
- name: ENV_DEFAULT_ENABLED_INPUTS
  value: cpu,disk,diskio,mem,swap,system,hostobject,net,host_processes,container,statsd,ebpf,rum
The DataKit address used for Real User Monitoring must be accessible by the client network. Therefore, modify the DataKit configuration file /usr/local/datakit/conf.d/datakit.conf to set listen="0.0.0.0:9529".
In this example, DataKit is deployed via DaemonSet, and the default configuration has already been modified. In production, it is recommended to deploy a dedicated DataKit for RUM.
Modify the /usr/local/k8s/dist/index.html file and add the following content in the <head>:
<script src="https://static.guance.com/browser-sdk/v2/dataflux-rum.js" type="text/javascript"></script>
<script>
  window.DATAFLUX_RUM &&
    window.DATAFLUX_RUM.init({
      applicationId: 'appid_ddxxxxxxxxxxxxxxxxxx5',
      datakitOrigin: 'http://172.16.0.230:9529',
      env: 'production',
      version: '1.0.0',
      trackInteractions: true,
      traceType: 'ddtrace',
      allowedTracingOrigins: ["http://8.136.207.182:30000","http://8.136.193.105:30000","http://8.136.204.98:30000"]
    })
</script>
-
applicationId: Application ID.
-
datakitOrigin: The accessible DataKit address or domain name. Here,
172.16.0.230is the IP of k8s node1. -
env: Required. The environment of the application, e.g., test, product, etc.
-
version: Required. The version of the application.
-
allowedTracingOrigins: Used to correlate RUM with APM. Configure the backend server address or domain name. In this example, both the frontend and backend access addresses are http://8.136.193.105:30000/, so port 30000 must be included.
-
trackInteractions: Enables user behavior tracking, such as button clicks, form submissions, etc.
-
traceType: Optional. Default is ddtrace. Currently supports ddtrace, zipkin, skywalking_v3, jaeger, zipkin_single_header, and w3c_traceparent.
For detailed information about Real User Monitoring, refer to <Web Application Monitoring (RUM) Best Practices>
Application Performance Monitoring (APM)
Enable ddtrace
See <Add the node_ip Tag to Trace Data>.
Integrate Java Applications with ddtrace
In the system image file DockerfileSystem, the command to start the jar is:
The environment variable JAVA_OPTS is defined in the deployment file system-deployment.yaml as follows:
- name: JAVA_OPTS
  value: |-
    -javaagent:/usr/dd-java-agent/agent/dd-java-agent.jar -Ddd.service.name=demo-k8s-system  -Ddd.tags=container_host:$(POD_NAME) -Ddd.service.mapping=mysql:mysql-k8s,redis:redisk8s -Ddd.env=dev -Ddd.agent.port=9529
Detailed explanation of JAVA_OPTS:
-Ddd.env: Environment type of the application, optional
-Ddd.tags: Custom tags, separated by commas, optional
-Ddd.service.name: Application name for JVM data source, required
-Ddd.agent.host=localhost    DataKit address, optional
-Ddd.agent.port=9529         DataKit port, required
-Ddd.version: Version, optional
-Ddd.jmxfetch.check-period: Collection interval in milliseconds, default 1500, optional
-Ddd.jmxfetch.statsd.host=127.0.0.1: Connection address for the statsd collector (same as DataKit address), optional
-Ddd.jmxfetch.statsd.port=8125: UDP port for the statsd collector on DataKit, default 8125, optional
-Ddd.trace.health.metrics.statsd.host=127.0.0.1: Address for sending health metrics (same as DataKit address), optional
-Ddd.trace.health.metrics.statsd.port=8125: Port for sending health metrics, optional
-Ddd.service.mapping: Aliases for Redis, MySQL, etc. called by the application, optional
Note: The
JAVA_OPTSdoes not specify the DataKit address for trace data reporting. Instead, the yaml defines the environment variableDD_AGENT_HOSTto specify the DataKit address. In a Kubernetes cluster, the principle is that trace data from a Pod is reported to the DataKit deployed on the same host. Seesystem-deployment.yamlfor the configuration.
Configure Cross-Origin Request Whitelist
response.headers.add('Access-Control-Allow-Headers','x-datadog-parent-id,x-datadog-sampled,x-datadog-sampling-priority,x-datadog-trace-id')
Logs
Configure logback.xml
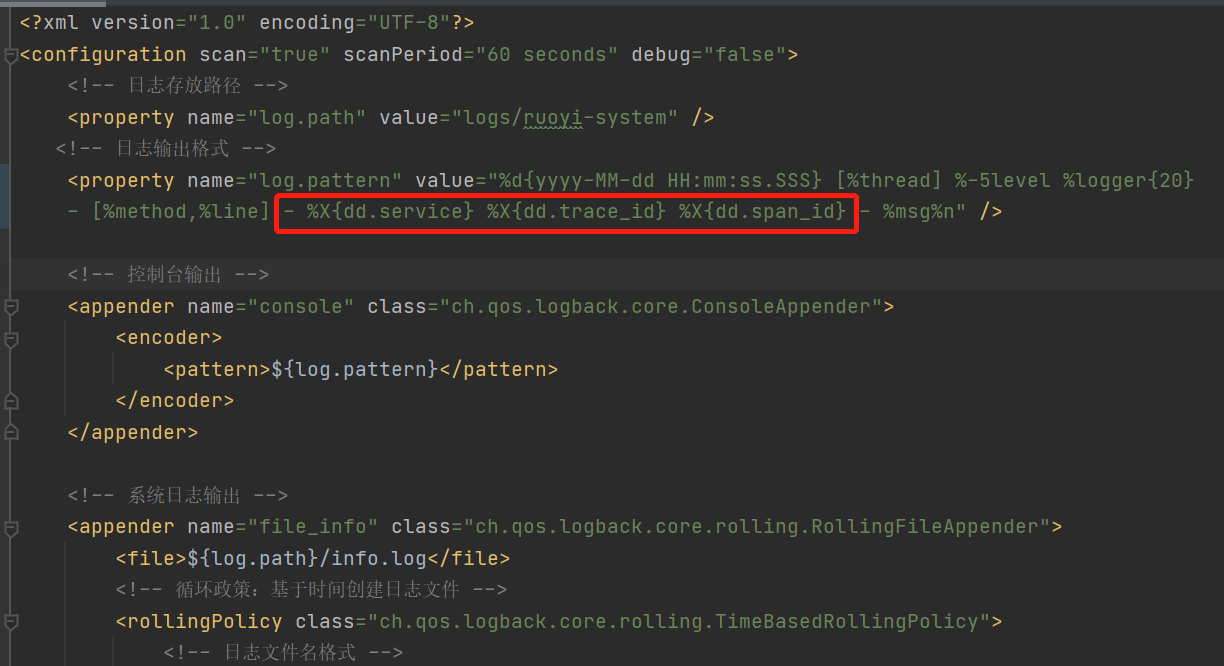
Modify logback.xml to output traceId, spanId, and service to the log for correlation with traces.
Enable Log Collection
For Kubernetes log collection, it is recommended to use the DataKit logfwd collector.
    logfwdserver.conf: |-
      [inputs.logfwdserver]
        ## logfwd receiver listening address and port
        address = "0.0.0.0:9531"

        [inputs.logfwdserver.tags]
        # some_tag = "some_value"
        # more_tag = "some_other_value"
Add the following under volumeMounts:
- mountPath: /usr/local/datakit/conf.d/log/logfwdserver.conf
  name: datakit-conf
  subPath: logfwdserver.conf
Log Parsing Pipeline
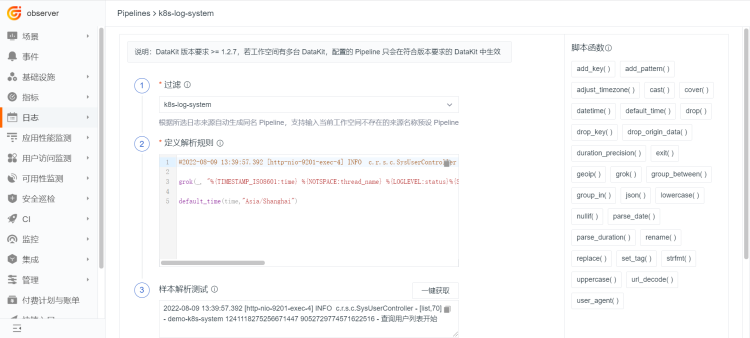
Use a Pipeline to parse the logs generated by the System module, extracting key information as tags, such as traceID, to correlate with traces.
Click the Logs module, go to Pipelines, create a new Pipeline, and in the filter select Source: k8s-log-system (the source set when collecting logs from the System module). Enter the following content, test it, and click Save.
#2022-08-09 13:39:57.392 [http-nio-9201-exec-4] INFO  c.r.s.c.SysUserController - [list,70] - demo-k8s-system 1241118275256671447 9052729774571622516 - 查询用户列表开始

grok(_, "%{TIMESTAMP_ISO8601:time} %{NOTSPACE:thread_name} %{LOGLEVEL:status}%{SPACE}%{NOTSPACE:class_name} - \\[%{NOTSPACE:method_name},%{NUMBER:line}\\] - %{DATA:service_name} %{DATA:trace_id} %{DATA:span_id} - %{GREEDYDATA:msg}")

default_time(time,"Asia/Shanghai")
Deploy the Application
Build Docker Images and Push to Harbor Registry
$ cd /usr/local/k8s/
$ docker build -t 172.16.0.215:5000/df-demo/demo-web:v1 -f DockerfileWeb .
$ docker push 172.16.0.215:5000/df-demo/demo-web:v1

$ docker build -t 172.16.0.215:5000/df-demo/demo-gateway:v1 -f DockerfileGateway .
$ docker push 172.16.0.215:5000/df-demo/demo-gateway:v1

$ docker build -t 172.16.0.215:5000/df-demo/demo-auth:v1 -f DockerfileAuth .
$ docker push 172.16.0.215:5000/df-demo/demo-auth:v1

$ docker build -t 172.16.0.215:5000/df-demo/demo-system:v1 -f DockerfileSystem .
$ docker push 172.16.0.215:5000/df-demo/demo-system:v1
Deploy
$ cd /usr/local/k8s/
$ kubectl apply -f web-deployment.yaml
$ kubectl apply -f gateway-deployment.yaml
$ kubectl apply -f auth-deployment.yaml
$ kubectl apply -f system-deployment.yaml
Trace Analysis
RUM-APM Correlation
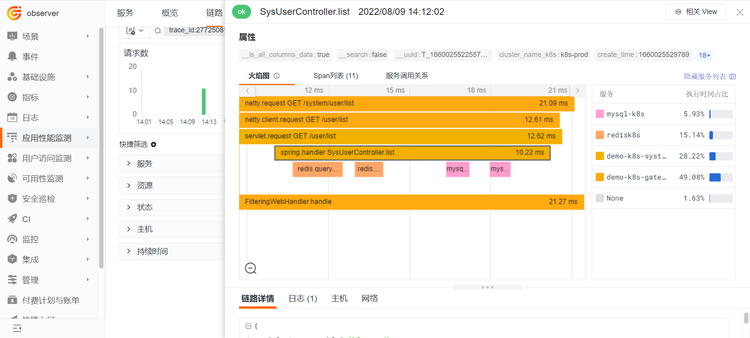
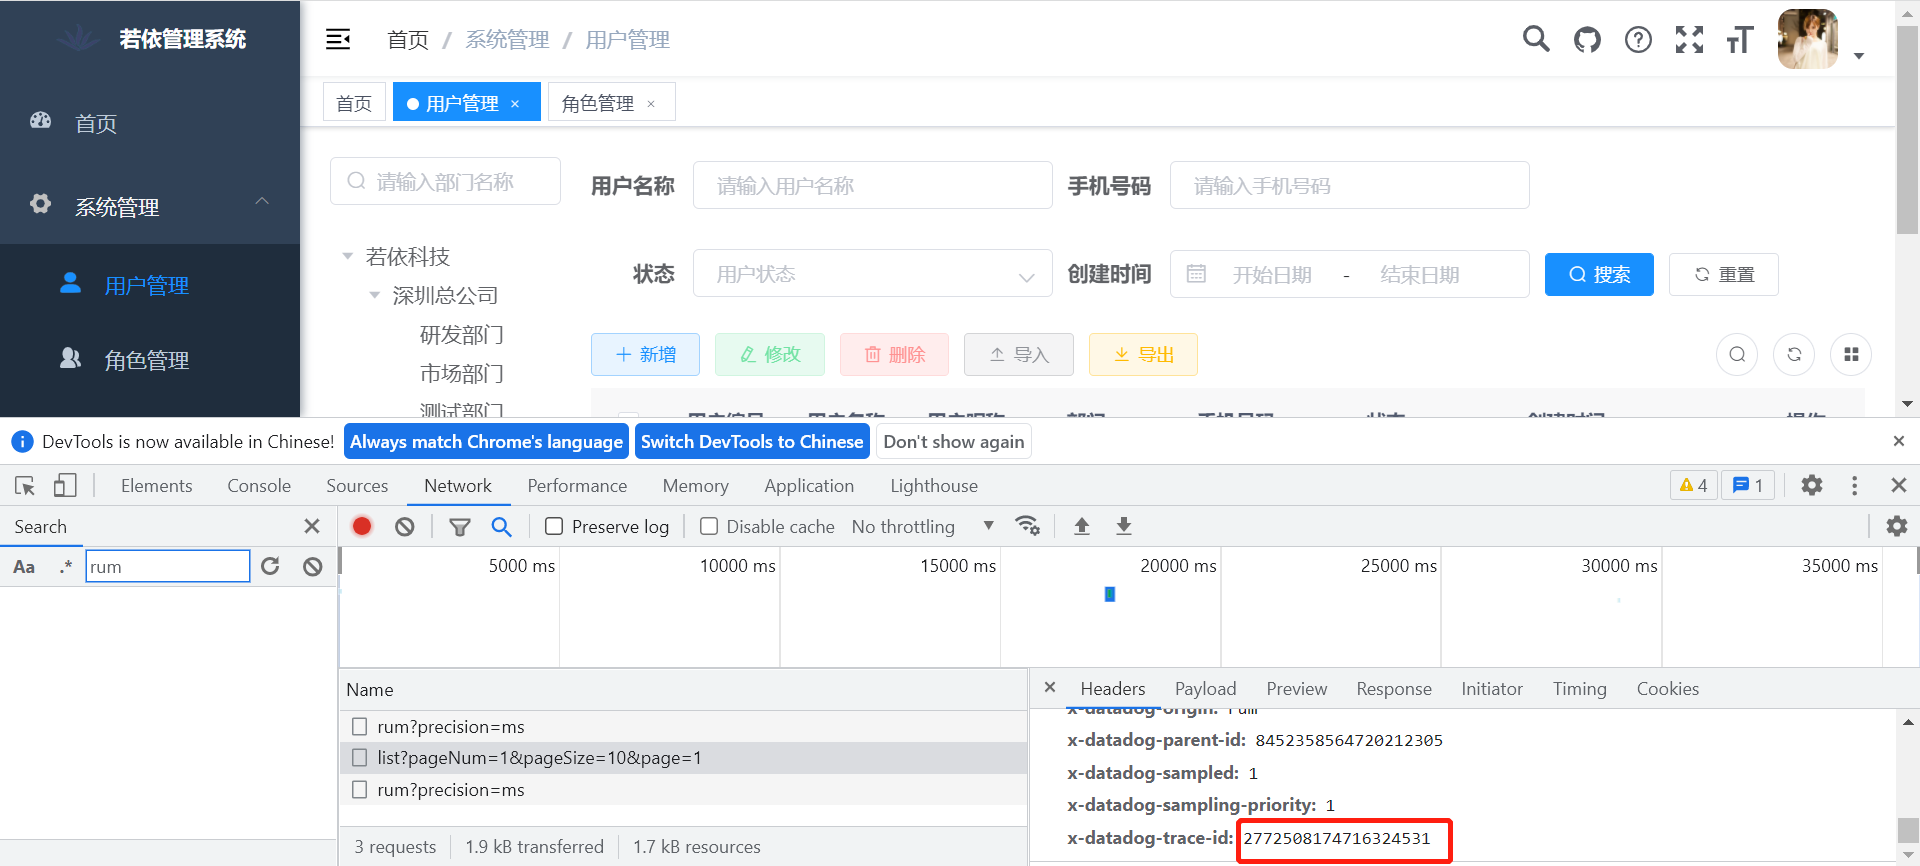
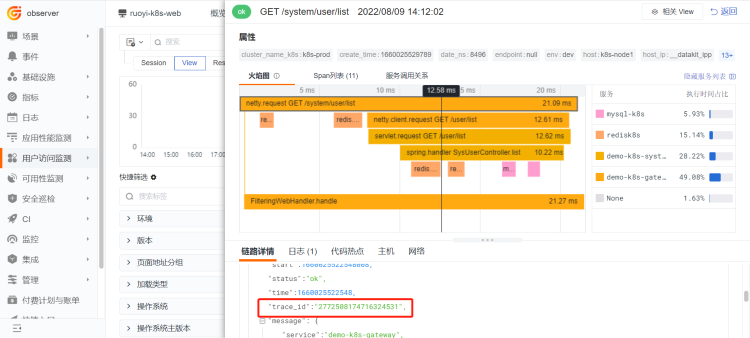
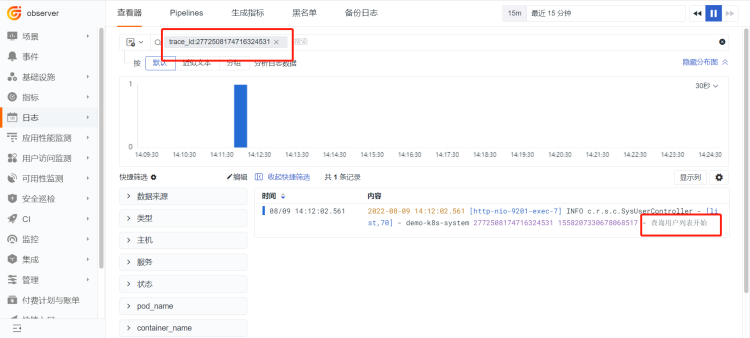
Access the Web application and click System Management → User Management. This triggers a user list query request list. The dataflux-rum.js generates a trace-id and stores it in the header. You can see that the trace-id corresponding to the list interface is 2772508174716324531. The request calls the backend list interface. The backend ddtrace reads the trace-id and records it in its own trace data. In logback.xml, %X{dd.trace_id} is added, so the trace_id is output with the log, enabling RUM, APM, and Log correlation.
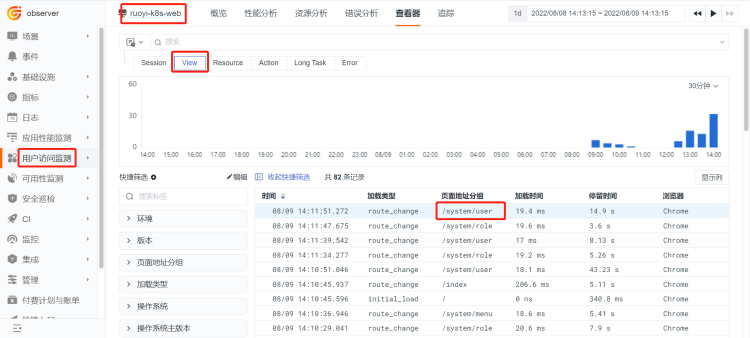
Click Real User Monitoring → ruoyi-k8s-web → Explorer → view. The previous operation was querying the user management list, so click /system/user in the list.
Click Fetch/XHR.
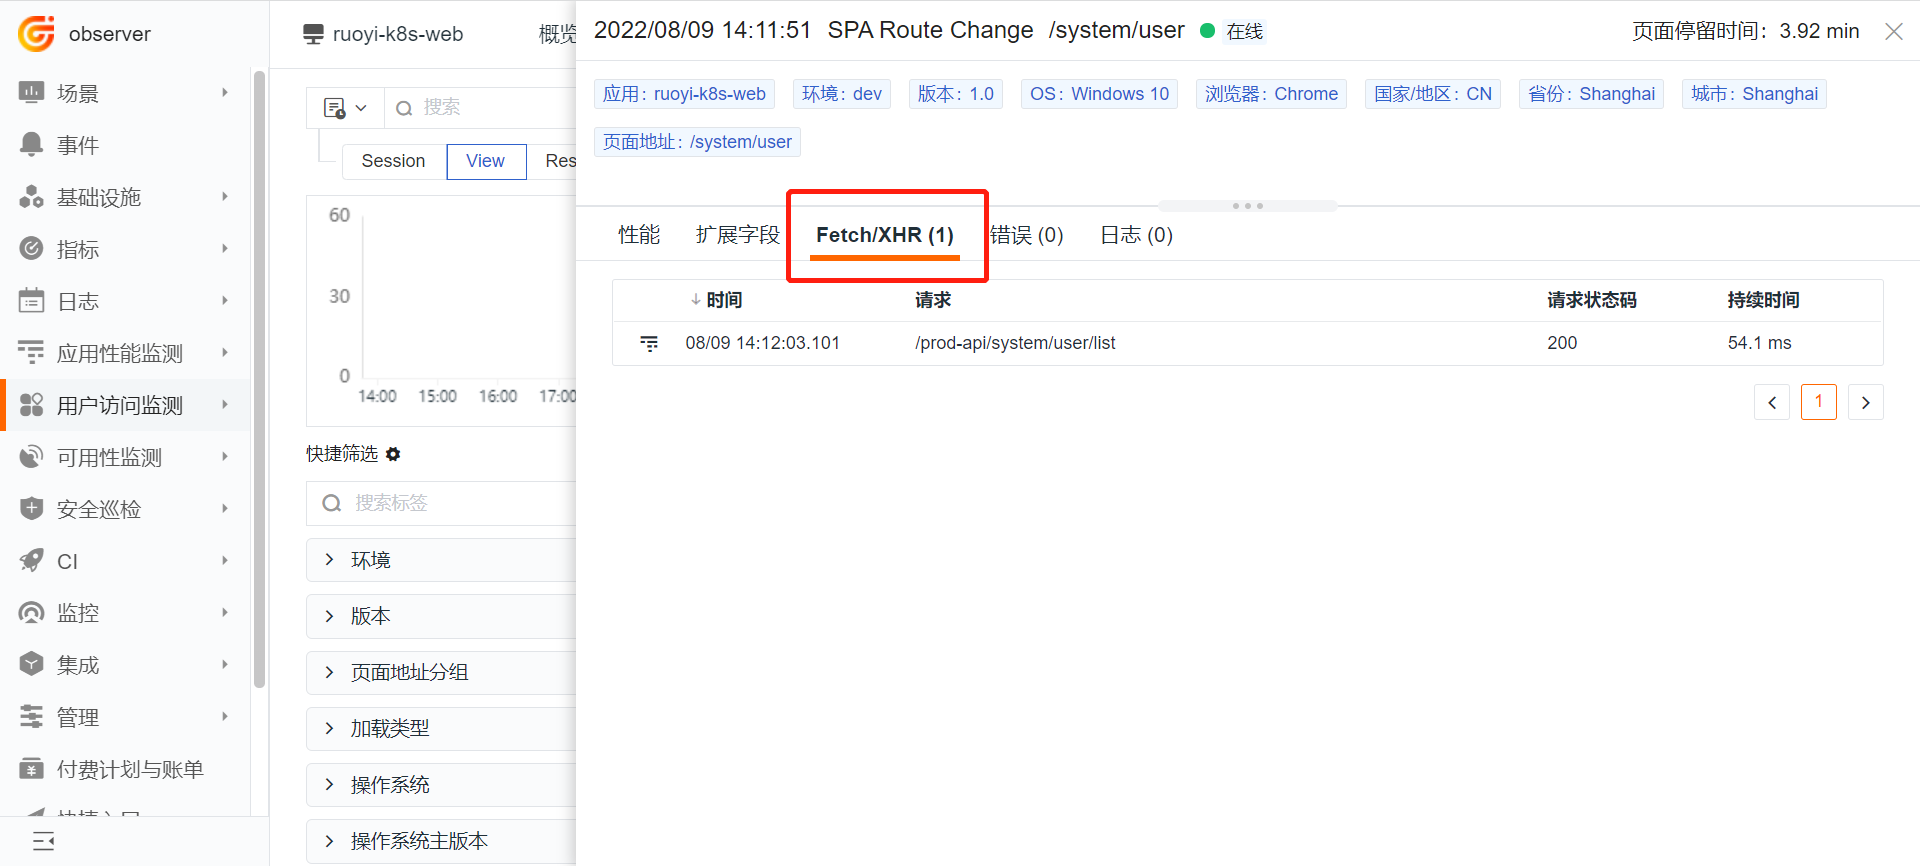
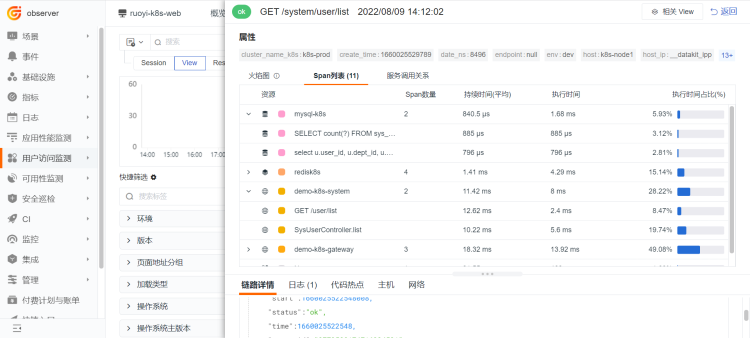
Click prod-api/system/user/list in the figure above. prod-api is the forwarding request added by nginx, and /system/user/list is the backend API. After entering, you can see the specific request and its duration.
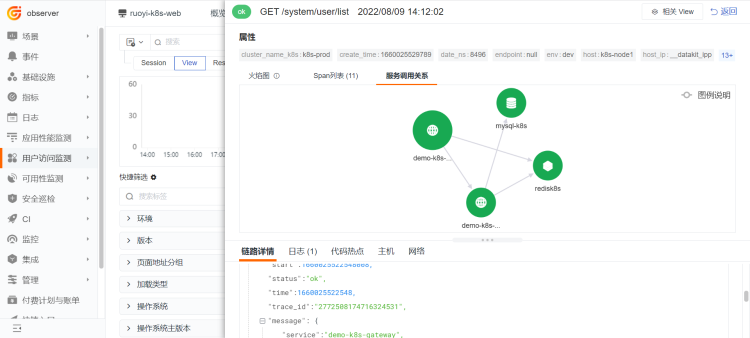
Log Analysis
Click the Logs module, select All Sources, and search for logs from the last 15 minutes by default. Based on the trace_id 2772508174716324531 generated by the frontend, enter it in the Search Bar and press Enter to search.
Click Application Performance Monitoring → Trace Filter → enter trace_id:704229736283371775, and press Enter to retrieve the trace call details.
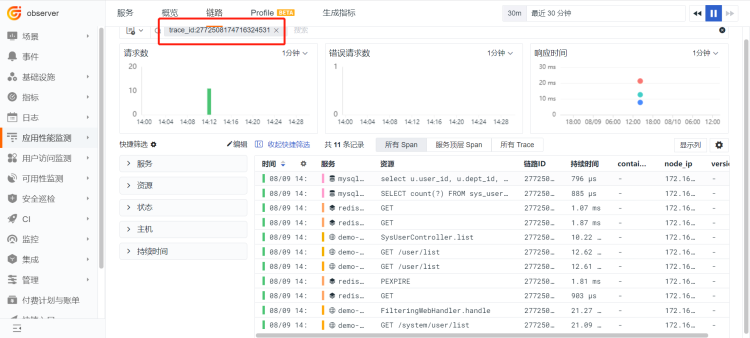
Click SysUserController.list to view the details.