OpenTelemetry to Grafana
Previous We introduced and demonstrated observability based on the traditional open-source OpenTelemetry components. With the popularity of observability in the past two years, Grafana has also entered the observability field.
Concepts
OTEL
OTEL is the abbreviation for OpenTelemetry, an observability project under CNCF that aims to provide standardization in the observability domain, addressing the standardization of data models, collection, processing, and export of observability data, and providing vendor-agnostic services.
OpenTelemetry is a set of standards and tools designed to manage observability data such as traces, metrics, and logs (with the potential for new types of observability data in the future). It is currently the industry standard.
Tempo
Grafana Tempo is an open-source, easy-to-use, and large-scale distributed tracing backend. Tempo is cost-effective, requiring only object storage to run, and is deeply integrated with Grafana, Prometheus, and Loki. Tempo works with any open-source tracing protocol, including Jaeger, Zipkin, and OpenTelemetry.
The Tempo project started at Grafana Labs in 2020 and was announced at Grafana ObservabilityCON in October. Tempo is released under the AGPLv3 license.
Loki
Loki is the latest open-source project from the Grafana Labs team, a horizontally scalable, highly available, multi-tenant log aggregation system. It is designed to be cost-effective and easy to operate because it does not index the content of logs, but rather indexes a set of labels for each log stream. The project is inspired by Prometheus, and the official description is: "Like Prometheus, but for logs."
Architecture
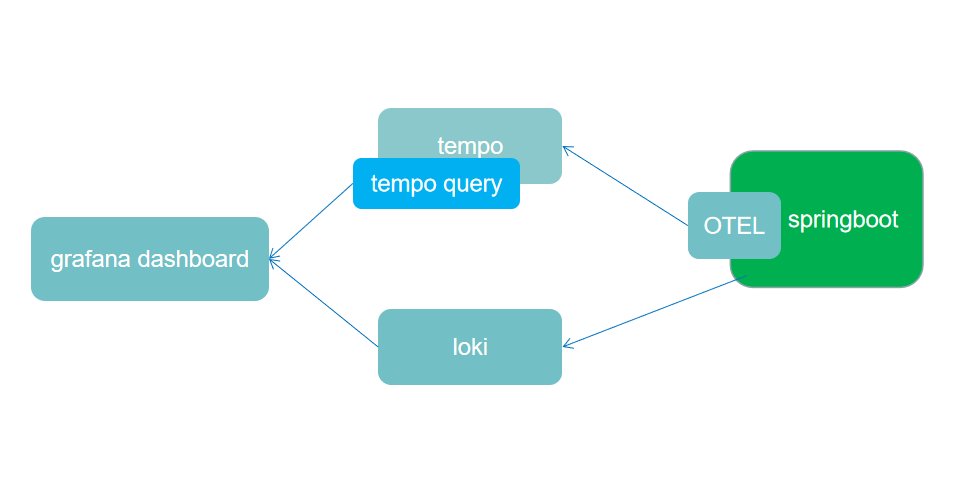
Execution Flow
- The OTEL collector outputs trace data from the Spring Boot application and tags the corresponding logs with
traceidandspanid. - Tempo collects and processes OTEL data and stores it locally. Tempo Query serves as the retrieval backend for Tempo.
- Loki collects log data from the Spring Boot application.
- Grafana Dashboard is used to display and view Tempo trace data and log data.
Installation & Configuration
1. Configure docker-compose.yaml
version: '3.3'

services:
    server:
        image: registry.cn-shenzhen.aliyuncs.com/lr_715377484/springboot-server:latest
        container_name: springboot_server
        ports:
            - 8080:8080
        environment:
            - OTEL_EXPORTER=otlp_span,prometheus
            - OTEL_EXPORTER_OTLP_ENDPOINT=http://tempo:55680
            - OTEL_EXPORTER_OTLP_INSECURE=true
            - OTEL_RESOURCE_ATTRIBUTES=service.name=springboot-server
            - JAVA_OPTS=-javaagent:/opentelemetry-javaagent.jar
        logging:
            driver: loki
            options:
                loki-url: 'http://localhost:3100/api/prom/push'
    loki:
        image: grafana/loki:2.2.0
        container_name: loki
        command: -config.file=/etc/loki/local-config.yaml
        ports:
            - "3100:3100"
        logging:
            driver: loki
            options:
                loki-url: 'http://localhost:3100/api/prom/push'
    tempo:
        image: grafana/tempo:0.6.0
        container_name: tempo
        command: ["--target=all", "--storage.trace.backend=local", "--storage.trace.local.path=/var/tempo", "--auth.enabled=false"]
        ports:
            - 8081:80
            - 55680:55680
    tempo-query:
        image: grafana/tempo-query:0.6.0
        container_name: tempo-query
        #command: ["--grpc-storage-plugin.configuration-file=/etc/tempo-query.yaml"]
        environment:
            - BACKEND=tempo:80
        volumes:
            - ./etc/tempo-query.yaml:/etc/tempo-query.yaml
        ports:
            - "16686:16686"  # jaeger-ui
        depends_on:
            - tempo
        logging:
            driver: loki
            options:
                loki-url: 'http://localhost:3100/api/prom/push'
    grafana:
        image: grafana/grafana:7.3.7
        container_name: grafana
        volumes:
            - ./config/grafana:/etc/grafana/provisioning/datasources
        environment:
            - GF_AUTH_ANONYMOUS_ENABLED=true
            - GF_AUTH_ANONYMOUS_ORG_ROLE=Admin
            - GF_AUTH_DISABLE_LOGIN_FORM=true
        ports:
            - "3000:3000"
        logging:
            driver: loki
            options:
                loki-url: 'http://localhost:3100/api/prom/push'
2. Configure Grafana
After deploying the application, you can configure data sources in Grafana. The newer version of Grafana supports using YAML to configure data sources in advance.
apiVersion: 1

deleteDatasources:
  - name: Prometheus
  - name: Tempo

datasources:
- name: Tempo
  type: tempo
  access: proxy
  orgId: 1
  url: http://tempo-query:16686
  basicAuth: false
  isDefault: false
  version: 1
  editable: false
  apiVersion: 1
  uid: tempo
- name: Loki
  type: loki
  access: proxy
  orgId: 1
  url: http://loki:3100
  basicAuth: false
  isDefault: false
  version: 1
  editable: false
  apiVersion: 1
  jsonData:
    derivedFields:
      - datasourceUid: tempo
        matcherRegex: (?:traceID|trace_id)=(\w+)
        name: TraceID
        url: $${__value.raw}
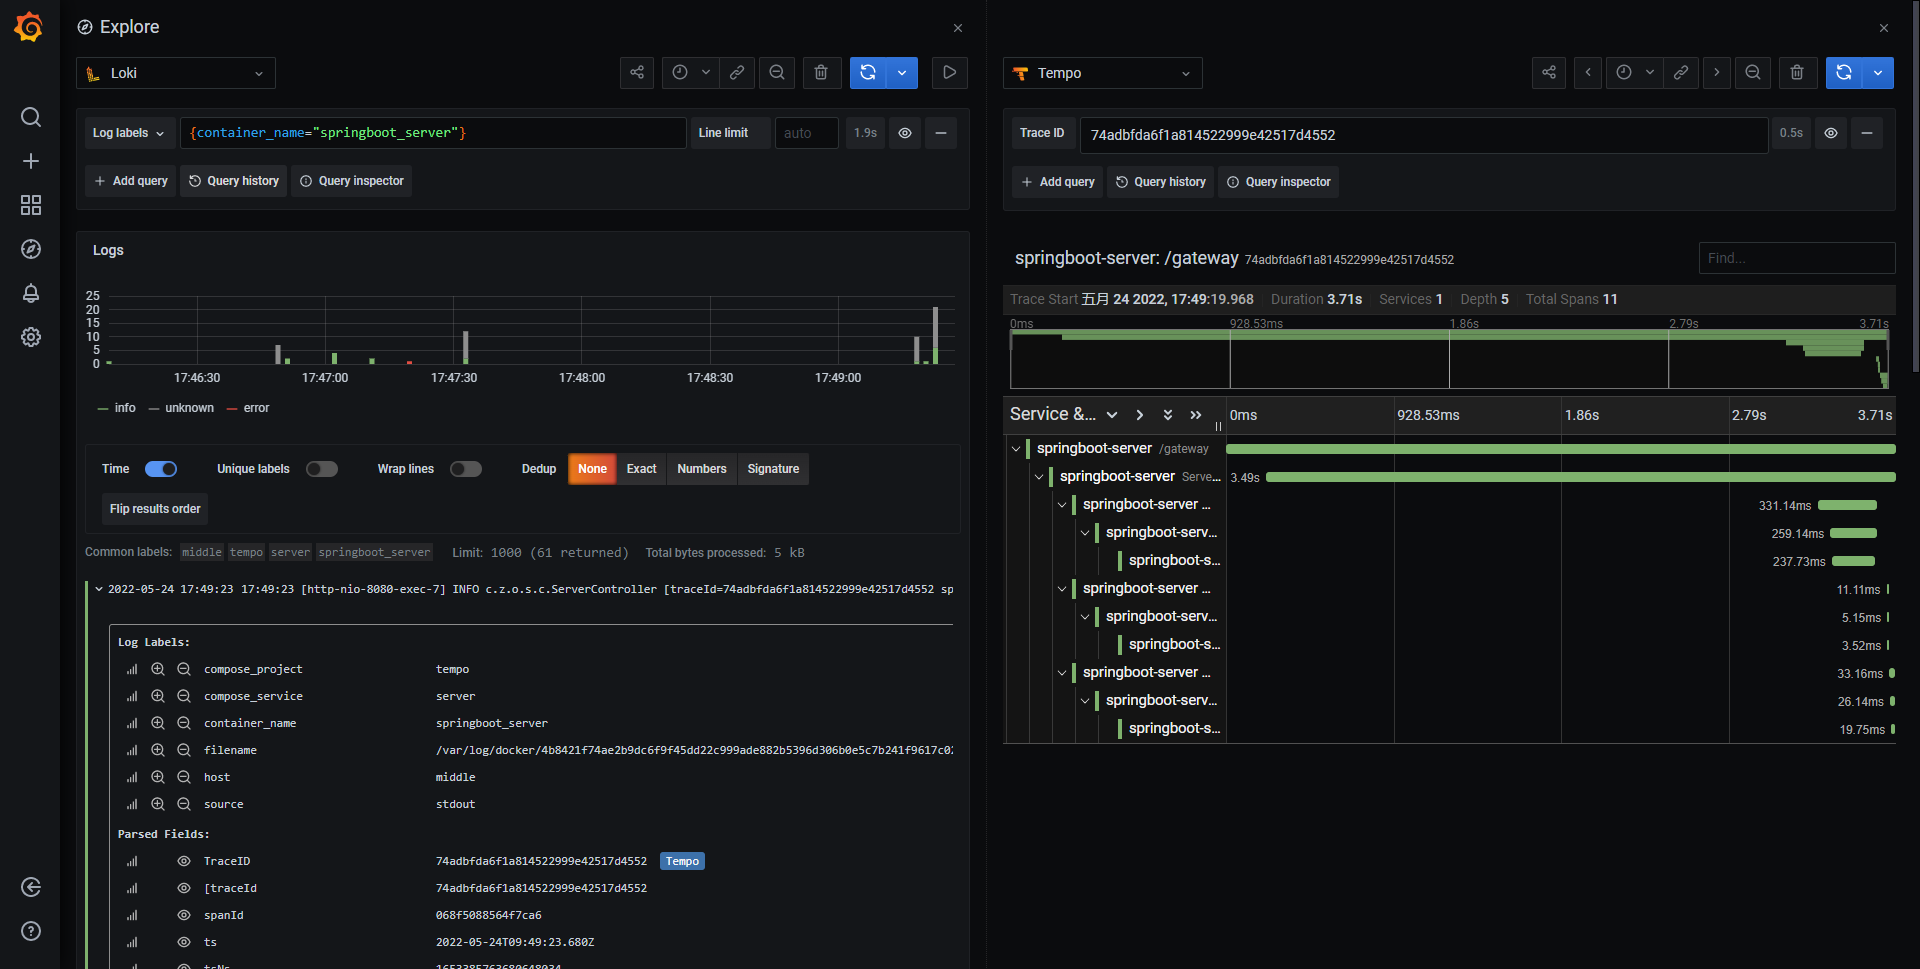
Loki parses logs and sets the URL for matched trace IDs, allowing you to directly query trace information from logs, enabling integration between logs and traces.
3. Install the Loki Plugin via Docker
docker plugin install grafana/loki-docker-driver:latest --alias loki --grant-all-permissions
4. Start
docker-compose up -d
5. Check Startup Status
docker-compose ps

6. Generate Traces and Logs
curl http://localhost:8080/gateway
Observability
In Grafana, you can enter application filter criteria to view the corresponding log information. If the current log level is Error, Grafana highlights it in red for quick identification.
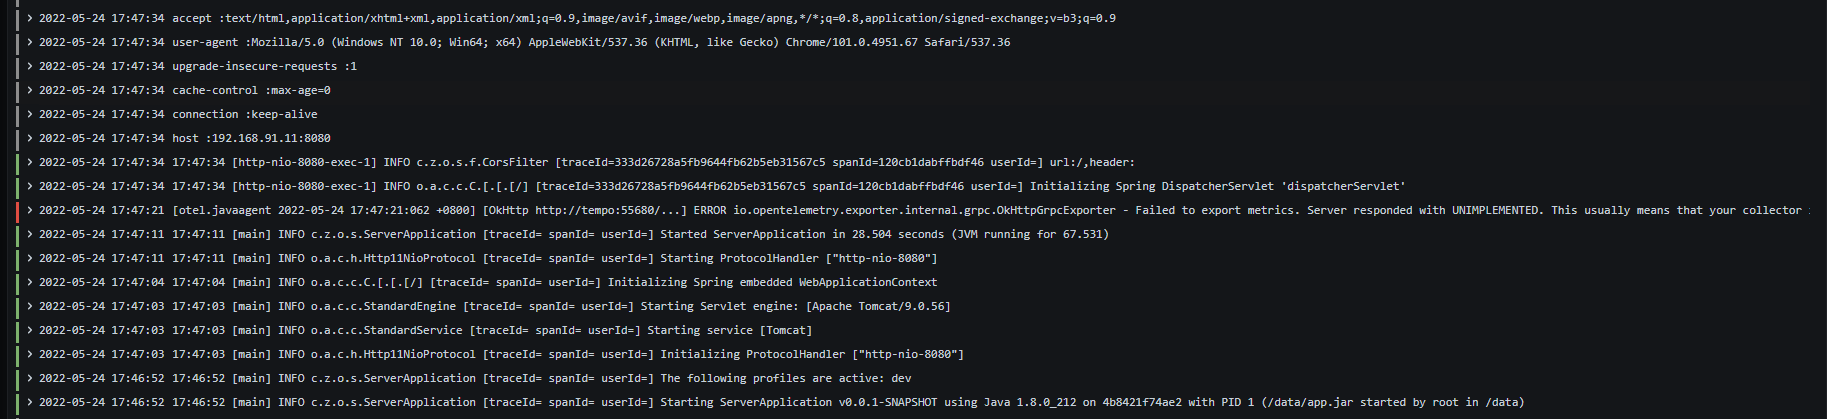
Clicking on a log entry allows you to view the associated tags. If the log contains a trace ID, Grafana automatically links to Tempo. Clicking the Tempo button navigates to the trace details for that log. This approach helps you quickly locate issues.
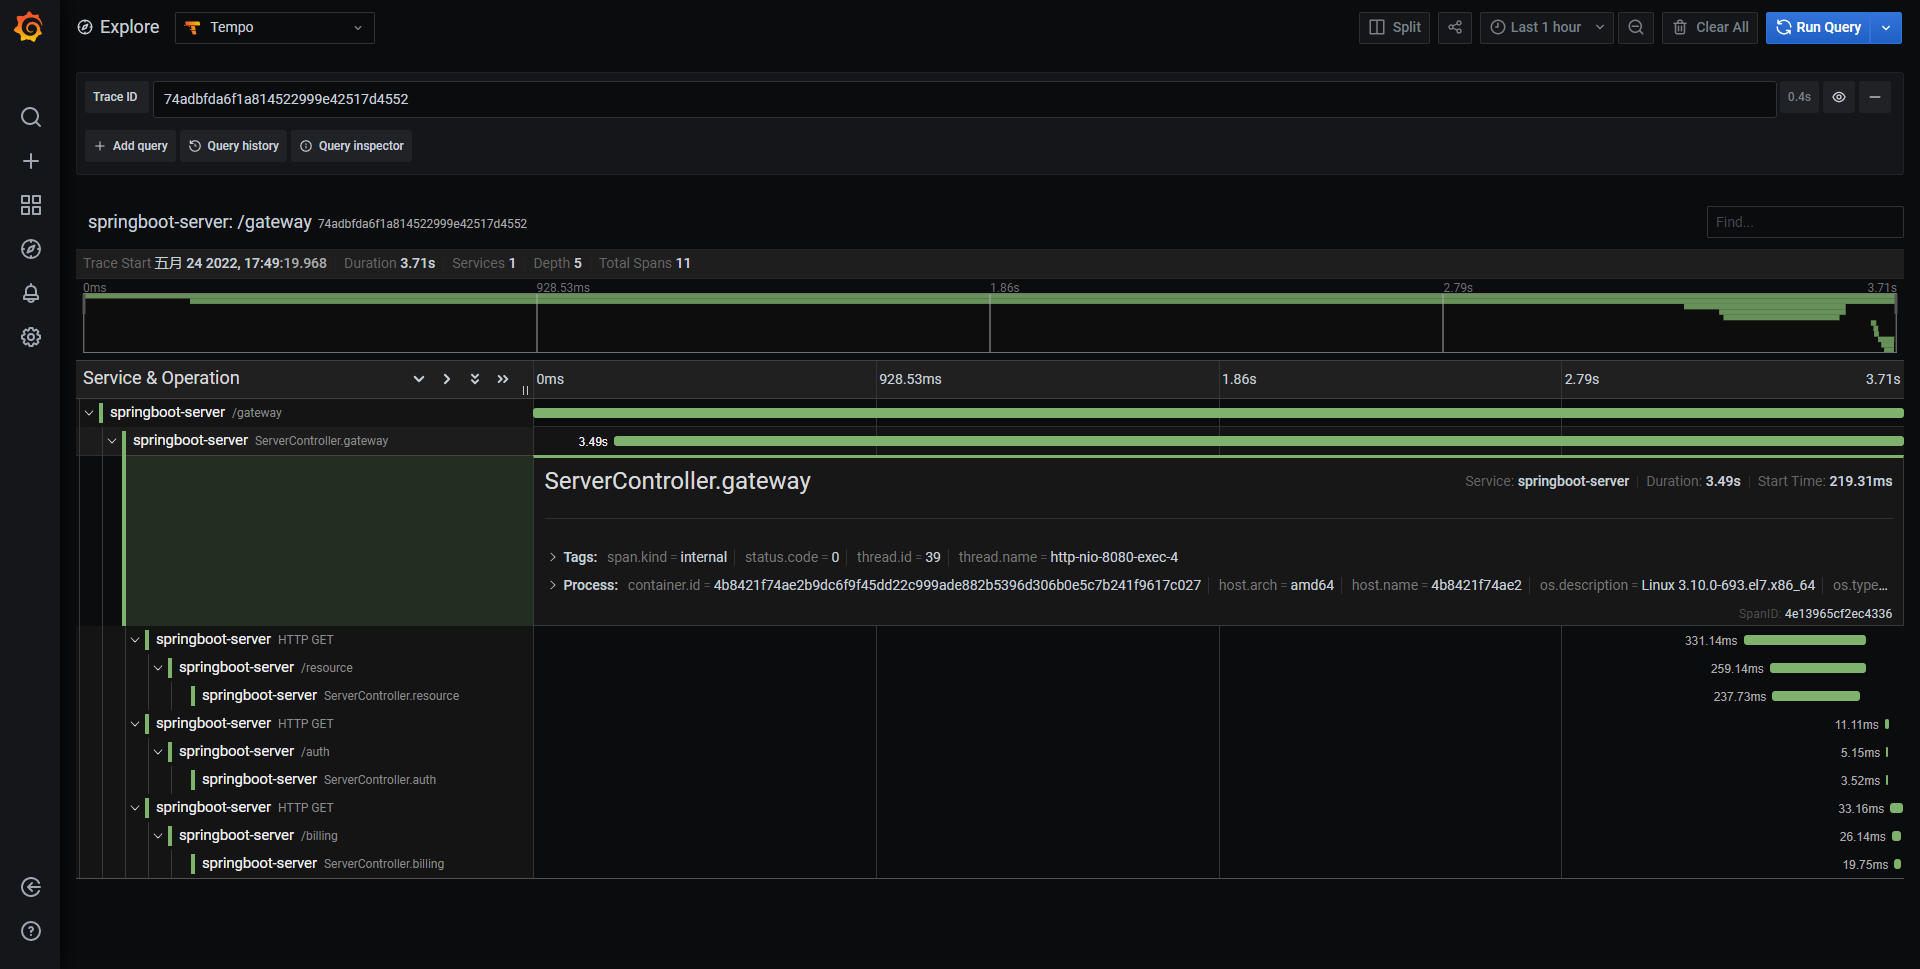
Switch to the Tempo view to query trace details by trace ID.
Extensions
Tempo stores and retrieves traces as a backend service and can work with other tracing protocols: Jaeger, Zipkin, and OTLP. Tempo is not a trace collector but an intermediary that aggregates traces from other protocols like Jaeger, Zipkin, etc.
As a new incubation product from Grafana Labs, Tempo is not yet mature. Issues encountered during use may heavily rely on community support from the Grafana team, increasing communication overhead.
Loki, as a new log storage tool, also has its own advantages and disadvantages:
Advantages
- Loki has a very simple architecture, using the same labels as Prometheus for indexing. These labels allow querying both log content and monitoring data, reducing the switching cost between queries and significantly lowering the storage cost of log indexes.
- Compared to ELK, Loki consumes fewer resources and is more cost-effective.
- It integrates with Grafana for log collection and visualization, enabling log filtering and context viewing.
Disadvantages:
- The technology is relatively new, and the corresponding community is not very active.
- Limited functionality: it excels at log viewing and filtering but lacks the data processing and cleansing capabilities of ELK. Additionally, ELK can be combined with various technologies for big data log processing, whereas Loki cannot.
The demo source code for this article: https://github.com/lrwh/observable-demo/blob/main/opentelemetry-to-grafana
Next We will introduce and demonstrate OpenTelemetry observability based on the Guance platform.