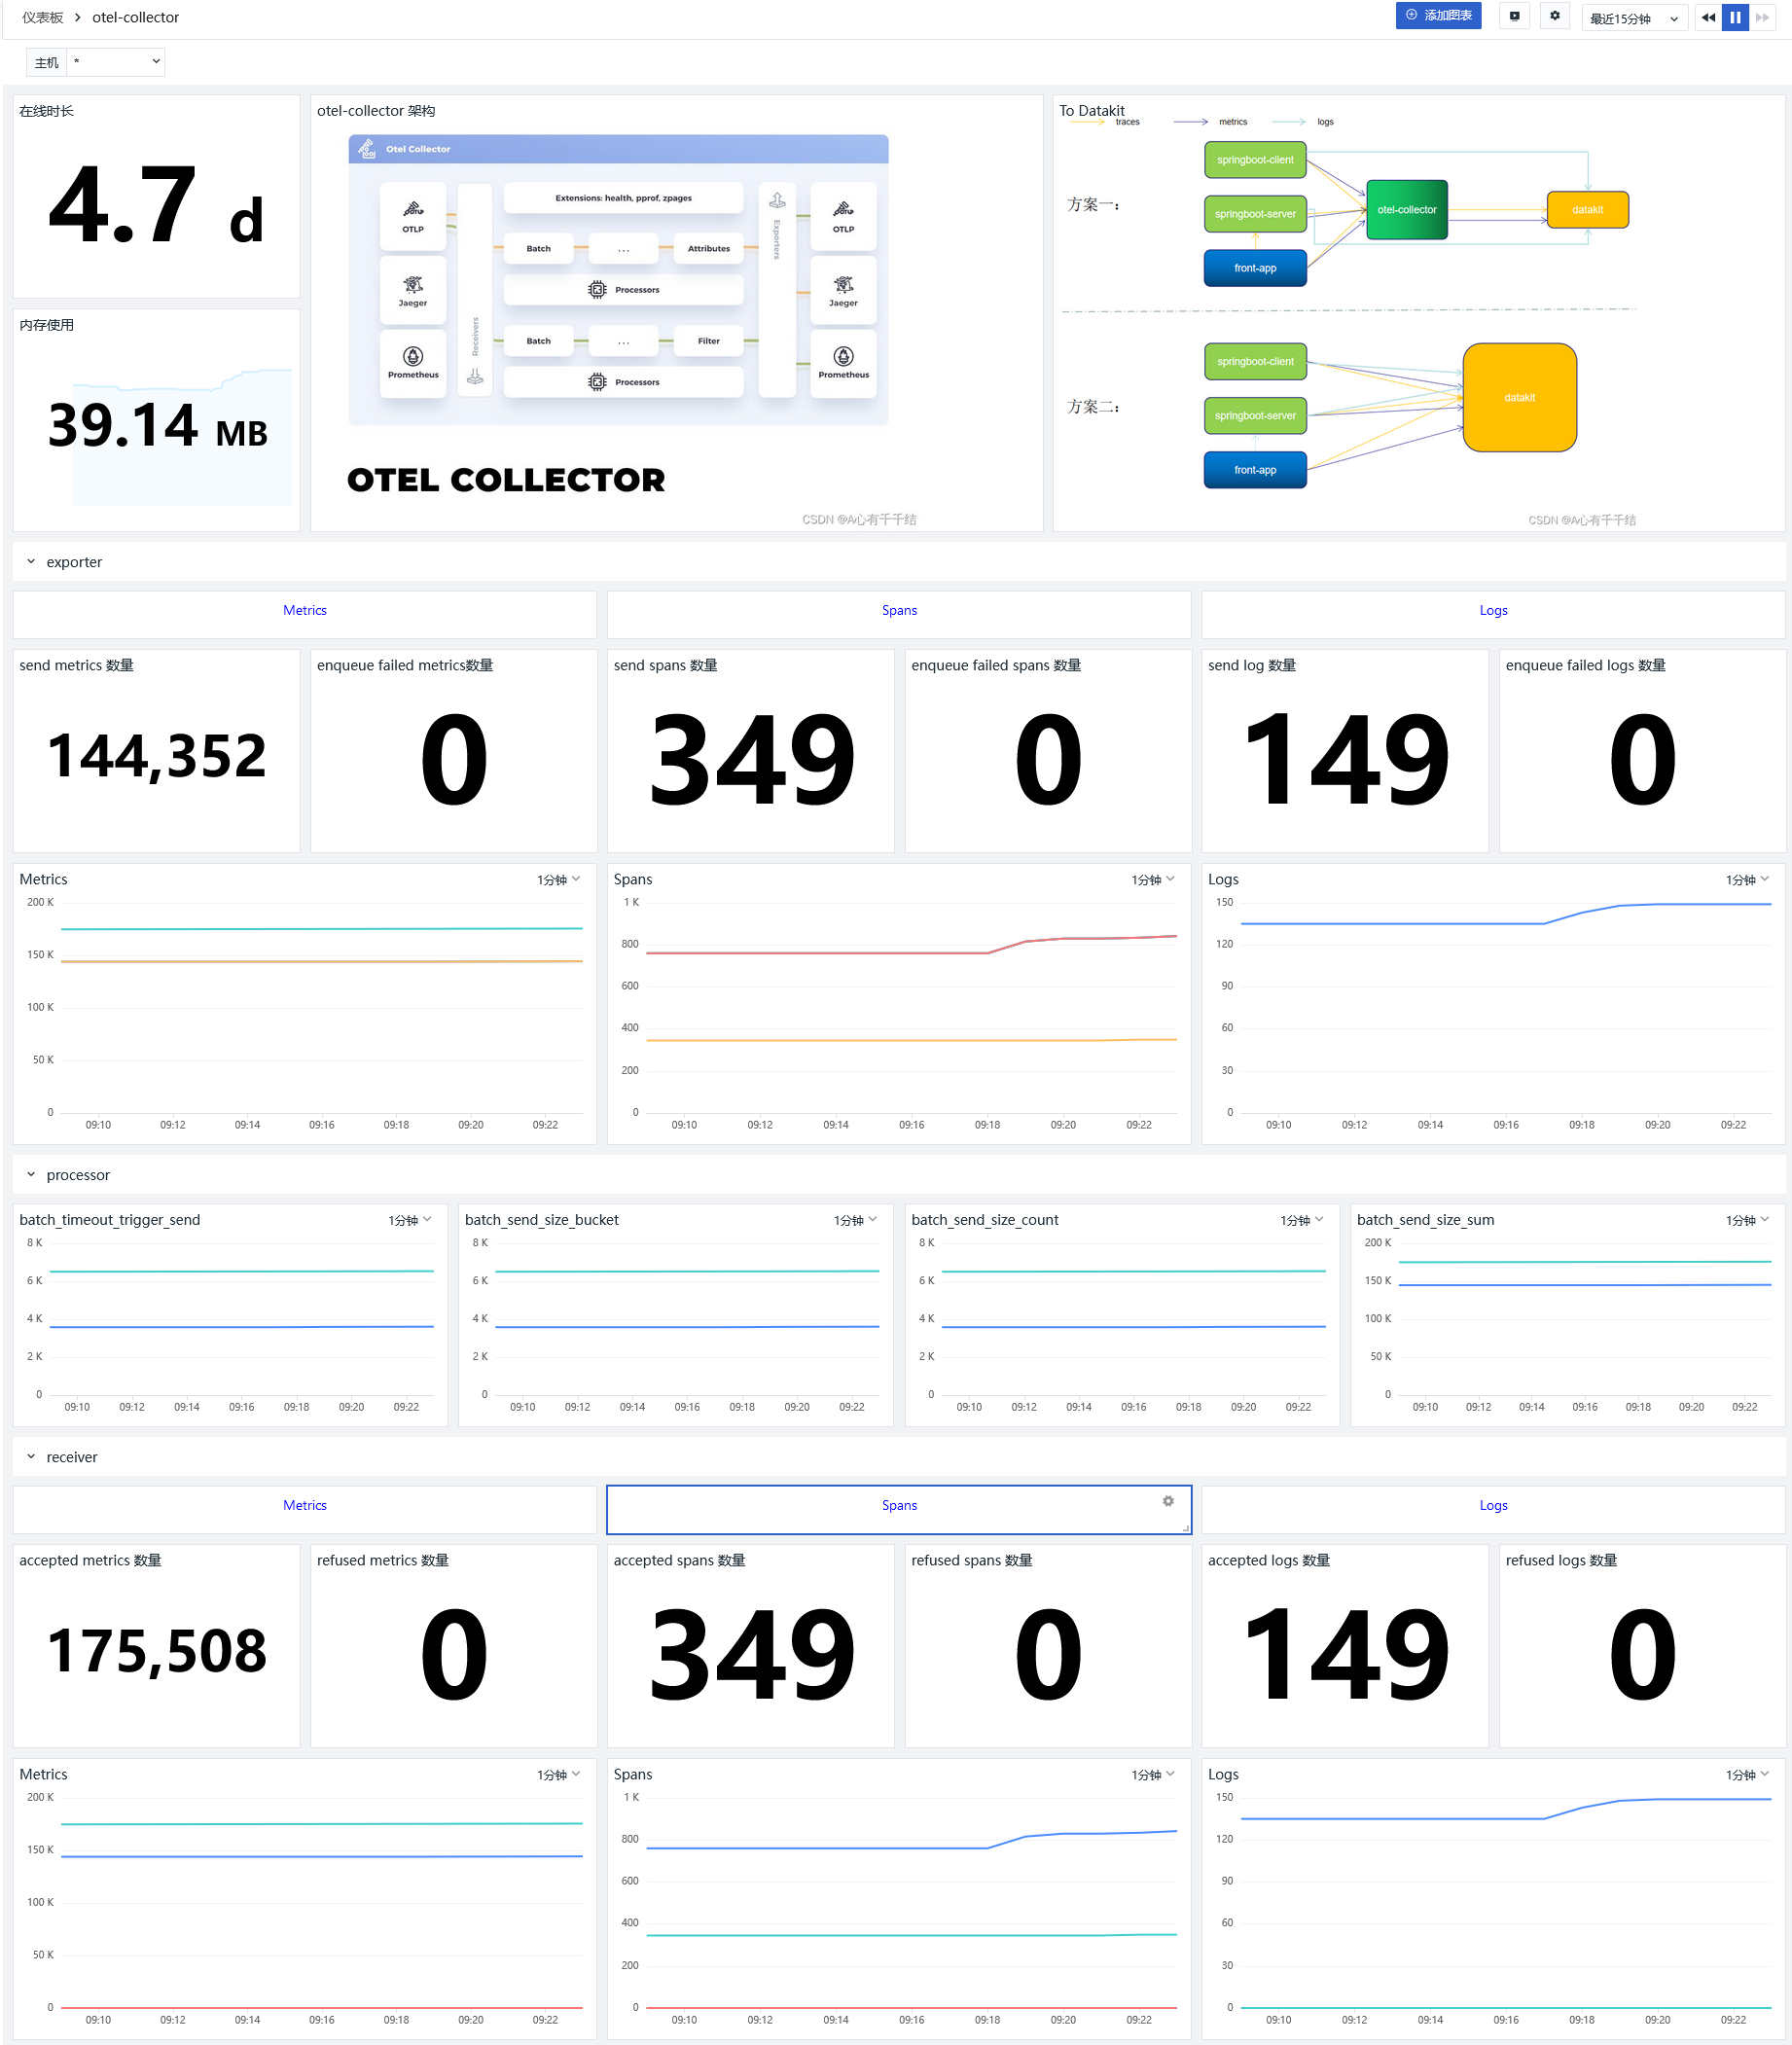
OpenTelemetry to Guance
In the previous two articles, we demonstrated and introduced how to perform observability based on OpenTelemetry.
OpenTelemetry to Jaeger, Grafana, ELK
As a classic observability architecture, different types of data are stored on different platforms — for example, logs in ELK, traces in Jaeger (an APM system), and metrics in Prometheus, visualized through Grafana.
Combining Grafana Tempo with Loki allows us to visually observe log-trace correlation. However, Loki's characteristics mean it cannot provide good log processing and analysis capabilities for large production systems. Log-trace correlation is only one part of observability, and querying solely through logs and traces cannot solve most problems, especially in the era of microservices and cloud-native architecture. The diversity of issues requires us to analyze from multiple aspects. For example, user access lag might not be a program issue; it could be caused by other comprehensive factors such as the current system's network, CPU, etc. In multi-cloud environments, Grafana cannot effectively support business development.
is a unified collection and management platform for various data types such as metrics, logs, APM, RUM, infrastructure, containers, middleware, and network performance. Using Guance allows us to observe the application comprehensively, not just the correlation between logs and traces. For more information on Guance, please go to Product Advantages.
DataKit is the frontend gateway of Guance. To send data to Guance, you need to configure DataKit correctly. Using DataKit provides the following advantages:
-
In a host environment, each host has a DataKit. Data is first sent to the local DataKit, which caches, preprocesses, and then reports it. This avoids network jitter and provides edge processing capabilities, reducing the pressure on backend data processing.
-
In a Kubernetes environment, each node has a DataKit DaemonSet. By leveraging the Kubernetes local traffic mechanism, data from pods on each node is first sent to the local DataKit on that node. This avoids network jitter and adds pod and node labels to APM data, making it easier to locate issues in distributed environments.
Since DataKit receives OTLP protocol data, you can either send data directly to DataKit without a collector, or set the collector's exporter to OTLP (DataKit).
Architecture

Architecturally, there are still two solutions for your choice.
DataKit supports multiple methods for log collection. This best practice primarily uses the socket method for log collection. The Spring Boot application pushes logs to DataKit via Logback-logstash.
Solution 1
- The application server and client push metric and trace data to the OTel Collector via the OTLP exporter.
- The front-end app (front-app) pushes trace data to the OTel Collector and accesses the application service API.
- The OTel Collector collects and transforms the data, then transmits metric and trace data to DataKit via the OTLP exporter.
- At the same time, the application server and client push logs to DataKit.
Exporter
The OTel Collector is configured with one exporter: otlpExporter.
Parameter description
endpoint : "http://192.168.91.11:4319" # The address of the DataKit OpenTelemetry collector, using GRPC protocol.
tls.insecure : true # TLS security verification disabled
compression: none # Gzip disabled (enabled by default)
Note
All applications are deployed on the same machine with IP 192.168.91.11. If applications and some middleware are deployed separately, modify the corresponding IP accordingly. If using cloud servers, ensure relevant ports are open to avoid access failures.
Solution 2
Solution 2 simply replaces the OTel Collector with DataKit.
When starting the backend server and client, modify the otel.exporter.otlp.endpoint address to point directly to DataKit.
-Dotel.exporter.otlp.endpoint=http://192.168.91.11:4319
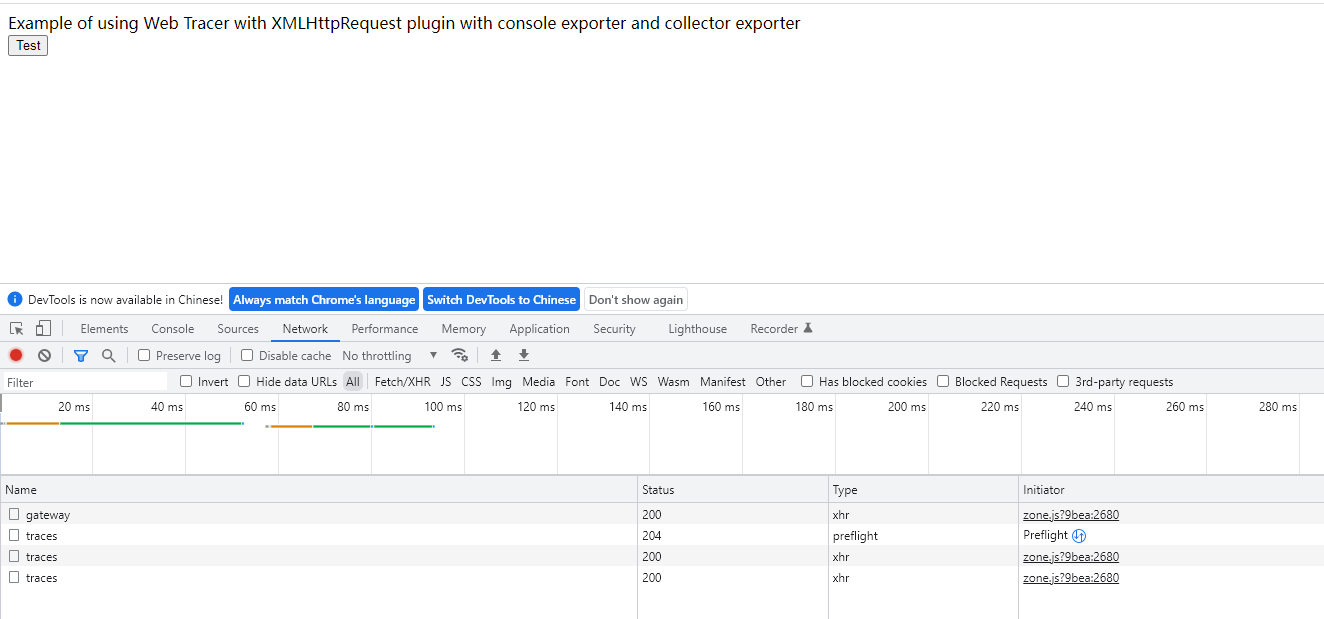
Front-end changes
const otelExporter = new OTLPTraceExporter({
// optional - url default value is http://localhost:55681/v1/traces
url: 'http://192.168.91.11:9529/otel/v1/trace',
headers: {},
});
Installing and Configuring DataKit
Installing DataKit
-
DataKit version >= 1.2.12
Enabling the OpenTelemetry Collector
Refer to the OpenTelemetry Collector Integration Document.
Adjust the following parameters
[inputs.opentelemetry.grpc] parameter description
- trace_enable: true # Enable gRPC trace
- metric_enable: true # Enable gRPC metric
- addr: 0.0.0.0:4319 # Port to listen on
Restart DataKit
Enabling Log Collection
- Enable the Logging plugin, copy the sample file
- Modify logging-socket-4560.conf
[[inputs.logging]]
## required
# logfiles = [
# "/var/log/syslog",
# "/var/log/message",
# ]
sockets = [
"tcp://0.0.0.0:4560"
]
## glob filteer
ignore = [""]
## your logging source, if it's empty, use 'default'
source = "otel"
## add service tag, if it's empty, use $source.
service = "otel"
## grok pipeline script path
pipeline = "log_socket.p"
## optional status:
## "emerg","alert","critical","error","warning","info","debug","OK"
ignore_status = []
## optional encodings:
## "utf-8", "utf-16le", "utf-16le", "gbk", "gb18030" or ""
character_encoding = ""
## The pattern should be a regexp. Note the use of '''this regexp'''
## regexp link: https://golang.org/pkg/regexp/syntax/#hdr-Syntax
# multiline_match = '''^\S'''
## removes ANSI escape codes from text strings
remove_ansi_escape_codes = false
[inputs.logging.tags]
# some_tag = "some_value"
# more_tag = "some_other_value"
Parameter description
- sockets # Socket configuration
-
pipeline: log_socket.p # Log parsing pipeline
-
Configure the pipeline
cd pipeline vim log_socket.p
json(_,message,"message")
json(_,class,"class")
json(_,serverName,"service")
json(_,thread,"thread")
json(_,severity,"status")
json(_,traceId,"trace_id")
json(_,spanId,"span_id")
json(_,`@timestamp`,"time")
set_tag(service)
default_time(time)
- Restart DataKit
Enabling Metric Collection
- Enable the Prometheus plugin, copy the sample file
- Modify prom-otel.conf
[[inputs.prom]]
## Exporter URLs
urls = ["http://127.0.0.1:8888/metrics"]
## Ignore request errors to the URL
ignore_req_err = false
## Collector alias
source = "prom"
## Output destination for collected data
# If configured, collected data will be written to a local file instead of being sent to the center.
# You can then use the command `datakit --prom-conf /path/to/this/conf` to debug the locally saved metrics.
# If the URL is already configured as a local file path, --prom-conf will prioritize debugging the data from the output path.
# output = "/abs/path/to/file"
## Maximum size of collected data in bytes
# When outputting data to a local file, you can set the maximum size limit.
# If the collected data exceeds this limit, it will be discarded.
# Default maximum size: 32MB
# max_file_size = 0
## Metric type filter. Accepted values: counter, gauge, histogram, summary, untyped
# By default, only counter and gauge metrics are collected.
# If empty, no filtering is applied.
metric_types = []
## Metric name filter: metrics matching the pattern will be retained.
# Supports regular expressions; multiple patterns can be configured (match any one).
# If empty, no filtering is applied, and all metrics are retained.
# metric_name_filter = ["cpu"]
## Measurement name prefix
# If configured, a prefix will be added to the measurement name.
measurement_prefix = ""
## Measurement name
# By default, the metric name is split by "_". The first field becomes the measurement name, and the remaining fields become the metric name.
# If measurement_name is configured, the metric name is not split.
# The final measurement name will have the measurement_prefix prepended.
# measurement_name = "prom"
## Collection interval: "ns", "us" (or "µs"), "ms", "s", "m", "h"
interval = "10s"
## Tags to filter out; multiple tags can be configured.
# Matching tags will be ignored.
# tags_ignore = ["xxxx"]
## TLS configuration
tls_open = false
# tls_ca = "/tmp/ca.crt"
# tls_cert = "/tmp/peer.crt"
# tls_key = "/tmp/peer.key"
## Custom authentication method, currently only Bearer Token is supported.
# token and token_file: only one needs to be configured.
# [inputs.prom.auth]
# type = "bearer_token"
# token = "xxxxxxxx"
# token_file = "/tmp/token"
## Custom measurement names
# Metrics with a common prefix can be grouped into one measurement.
# Custom measurement name configuration takes precedence over the measurement_name option.
#[[inputs.prom.measurements]]
# prefix = "cpu_"
# name = "cpu"
# [[inputs.prom.measurements]]
# prefix = "mem_"
# name = "mem"
## Rename tag keys in Prometheus data
[inputs.prom.tags_rename]
overwrite_exist_tags = false
[inputs.prom.tags_rename.mapping]
# tag1 = "new-name-1"
# tag2 = "new-name-2"
# tag3 = "new-name-3"
## Custom tags
[inputs.prom.tags]
# some_tag = "some_value"
# more_tag = "some_other_value"
Parameter description
- urls # OTel Collector metric URL
-
metric_types = []: Collect all metric types
-
Restart DataKit
Installing OpenTelemetry Collector
Source Code
https://github.com/lrwh/observable-demo/tree/main/opentelemetry-collector-to-guance
Configuring otel-collector-config.yaml
Add a collector configuration with 1 receiver (otlp), 4 exporters (prometheus, zipkin, jaeger, and elasticsearch).
receivers:
otlp:
protocols:
grpc:
http:
cors:
allowed_origins:
- http://*
- https://*
exporters:
  otlp:
    endpoint: "http://192.168.91.11:4319"
    tls:
      insecure: true
    compression: none # Gzip disabled
processors:
batch:
extensions:
health_check:
pprof:
endpoint: :1888
zpages:
endpoint: :55679
service:
extensions: [pprof, zpages, health_check]
pipelines:
traces:
receivers: [otlp]
processors: [batch]
exporters: [otlp]
metrics:
receivers: [otlp]
processors: [batch]
exporters: [otlp]
Install the OTel Collector via docker-compose
version: '3.3'

services:
    # Collector
    otel-collector:
        image: otel/opentelemetry-collector-contrib:0.51.0
        command: ["--config=/etc/otel-collector-config.yaml"]
        volumes:
            - ./otel-collector-config.yaml:/etc/otel-collector-config.yaml
        ports:
            - "1888:1888"   # pprof extension
            - "8888:8888"   # Prometheus metrics exposed by the collector
            - "8889:8889"   # Prometheus exporter metrics
            - "13133:13133" # health_check extension
            - "4350:4317"        # OTLP gRPC receiver
            - "55670:55679" # zpages extension
            - "4318:4318"
Start the container
Check startup status

Spring Boot Application Integration (APM & Log)
This mainly uses the socket method provided by Logstash-logback to upload logs to Logstash, requiring some code adjustments.
1. Add Maven dependency for Logstash-logback
<dependency>
  <groupId>net.logstash.logback</groupId>
  <artifactId>logstash-logback-encoder</artifactId>
  <version>7.0.1</version>
</dependency>
2. Add logback-logstash.xml
<?xml version="1.0" encoding="UTF-8"?>
<configuration scan="true" scanPeriod="30 seconds">
    <!-- Some parameters are sourced from properties file -->
    <springProperty scope="context" name="logName" source="spring.application.name" defaultValue="localhost.log"/>
    <!-- Allows dynamic log level modification after configuration -->
    <jmxConfigurator />
    <property name="log.pattern" value="%d{HH:mm:ss} [%thread] %-5level %logger{10} [traceId=%X{trace_id} spanId=%X{span_id} userId=%X{user-id}] %msg%n" />

    <springProperty scope="context" name="logstashHost" source="logstash.host" defaultValue="logstash"/>
    <springProperty scope="context" name="logstashPort" source="logstash.port" defaultValue="4560"/>
    <!-- %m message, %p log level, %t thread name, %d date, %c fully qualified class name -->
    <appender name="STDOUT" class="ch.qos.logback.core.ConsoleAppender">
        <encoder>
            <pattern>${log.pattern}</pattern>
            <charset>UTF-8</charset>
        </encoder>
    </appender>

    <appender name="FILE" class="ch.qos.logback.core.rolling.RollingFileAppender">
        <file>logs/${logName}/${logName}.log</file>    <!-- usage -->
        <append>true</append>
        <rollingPolicy class="ch.qos.logback.core.rolling.SizeAndTimeBasedRollingPolicy">
            <fileNamePattern>logs/${logName}/${logName}-%d{yyyy-MM-dd}.log.%i</fileNamePattern>
            <maxFileSize>64MB</maxFileSize>
            <maxHistory>30</maxHistory>
            <totalSizeCap>1GB</totalSizeCap>
        </rollingPolicy>
        <encoder>
            <pattern>${log.pattern}</pattern>
            <charset>UTF-8</charset>
        </encoder>
    </appender>

    <!-- LOGSTASH output settings -->
    <appender name="LOGSTASH" class="net.logstash.logback.appender.LogstashTcpSocketAppender">
        <!-- Configure Logstash service address -->
        <destination>${logstashHost}:${logstashPort}</destination>
        <!-- Log output encoding -->
        <encoder class="net.logstash.logback.encoder.LoggingEventCompositeJsonEncoder">
            <providers>
                <timestamp>
                    <timeZone>UTC+8</timeZone>
                </timestamp>
                <pattern>
                    <pattern>
                        {
                        "podName":"${podName:-}",
                        "namespace":"${k8sNamespace:-}",
                        "severity": "%level",
                        "serverName": "${logName:-}",
                        "traceId": "%X{trace_id:-}",
                        "spanId": "%X{span_id:-}",
                        "pid": "${PID:-}",
                        "thread": "%thread",
                        "class": "%logger{40}",
                        "message": "%message\n%exception"
                        }
                    </pattern>
                </pattern>
            </providers>
        </encoder>
        <!-- Keepalive -->
        <keepAliveDuration>5 minutes</keepAliveDuration>
    </appender>

    <!-- Only print error-level content -->
    <logger name="net.sf.json" level="ERROR" />
    <logger name="org.springframework" level="ERROR" />

    <root level="info">
        <appender-ref ref="STDOUT"/>
        <appender-ref ref="LOGSTASH"/>
    </root>
</configuration>
3. Add application-logstash.yml
4. Rebuild the package
5. Start the services
java -javaagent:opentelemetry-javaagent-1.13.1.jar \
-Dotel.traces.exporter=otlp \
-Dotel.exporter.otlp.endpoint=http://localhost:4350 \
-Dotel.resource.attributes=service.name=server,username=liu \
-Dotel.metrics.exporter=otlp \
-Dotel.propagators=b3 \
-jar springboot-server.jar --client=true \
--spring.profiles.active=logstash \
--logstash.host=192.168.91.11 \
--logstash.port=4560
java -javaagent:opentelemetry-javaagent-1.13.1.jar \
-Dotel.traces.exporter=otlp \
-Dotel.exporter.otlp.endpoint=http://localhost:4350 \
-Dotel.resource.attributes=service.name=client,username=liu \
-Dotel.metrics.exporter=otlp \
-Dotel.propagators=b3 \
-jar springboot-client.jar \
--spring.profiles.active=logstash \
--logstash.host=localhost \
--logstash.port=4560
JS Integration (RUM)
Source Code
https://github.com/lrwh/observable-demo/tree/main/opentelemetry-js
Configuring OTLPTraceExporter
const otelExporter = new OTLPTraceExporter({
  // optional - url default value is http://localhost:55681/v1/traces
  url: 'http://192.168.91.11:4318/v1/traces',
  headers: {},
});
Here, the URL is the OTLP receiver address of the OTel Collector (HTTP protocol).
Configuring server_name
const providerWithZone = new WebTracerProvider({
      resource: new Resource({
        [SemanticResourceAttributes.SERVICE_NAME]: 'front-app',
      }),
    }
);
Installation
Start
Default port: 8090
APM and RUM Correlation
APM and RUM are correlated primarily through header parameters. To maintain consistency, a unified propagator must be configured. Here, RUM uses B3, so APM also needs to be configured with B3. Simply add -Dotel.propagators=b3 to the APM startup parameters.
APM and Log Correlation
APM and Log correlation is primarily achieved by injecting traceId and spanId into log records. Different log integration methods have different injection approaches.
Guance
Access the front-end URL to generate trace information.
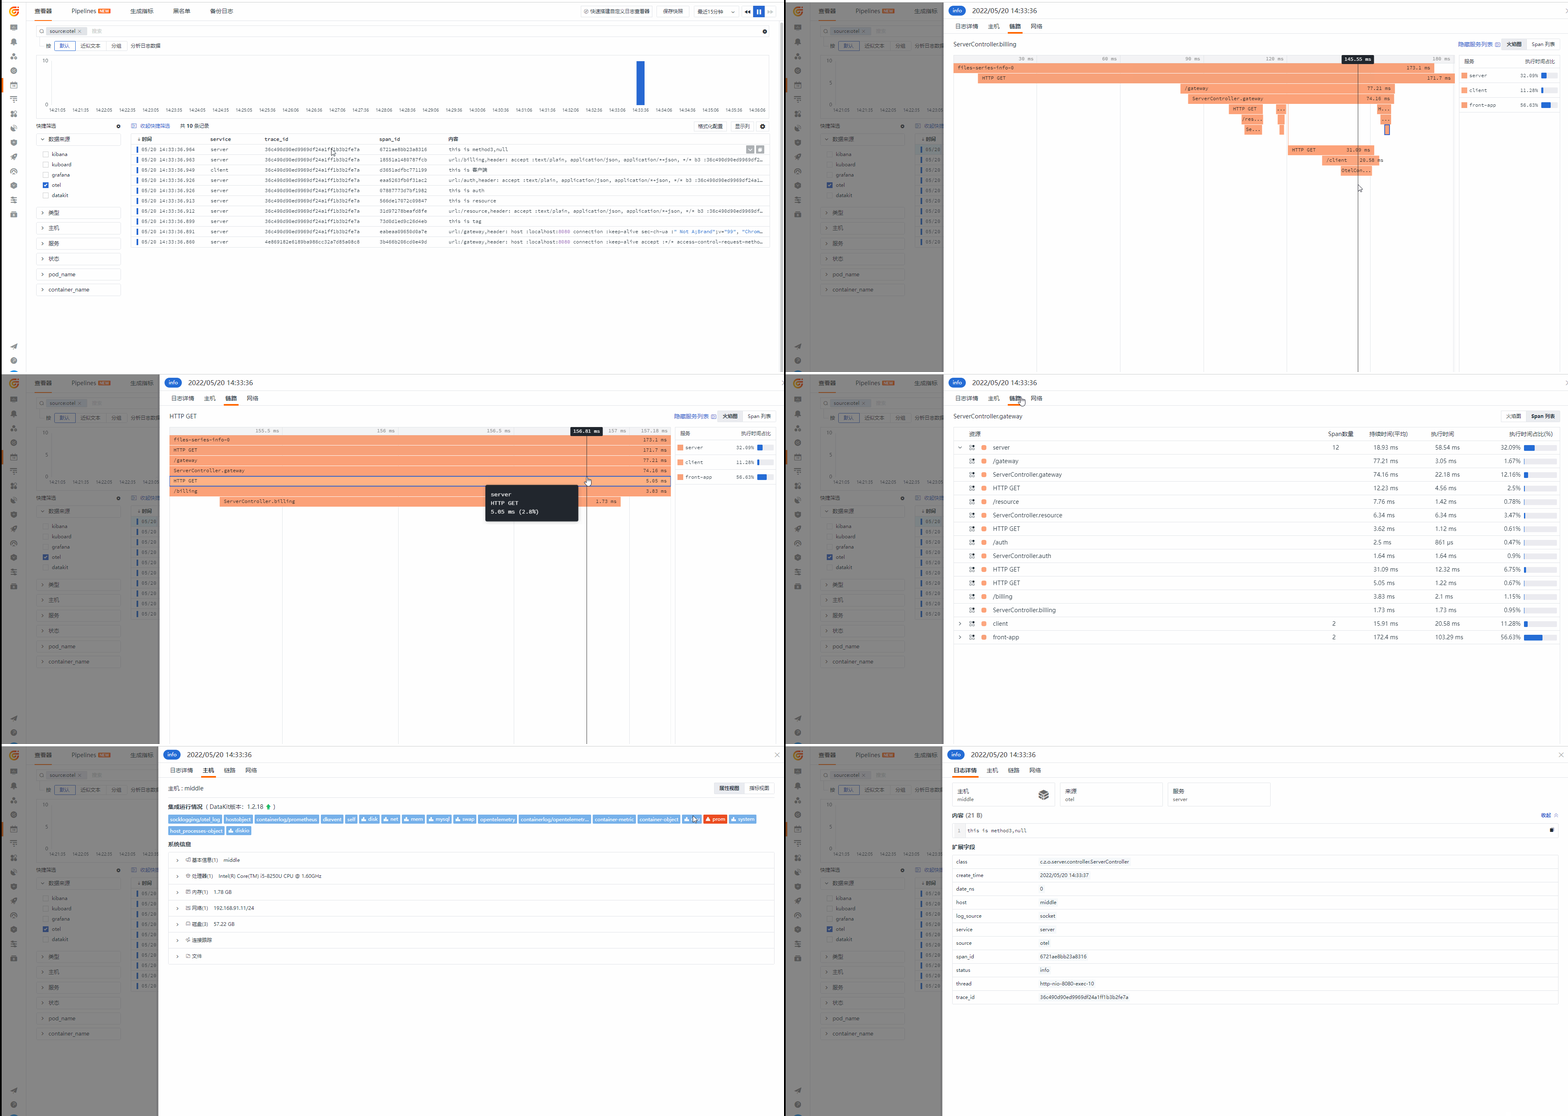
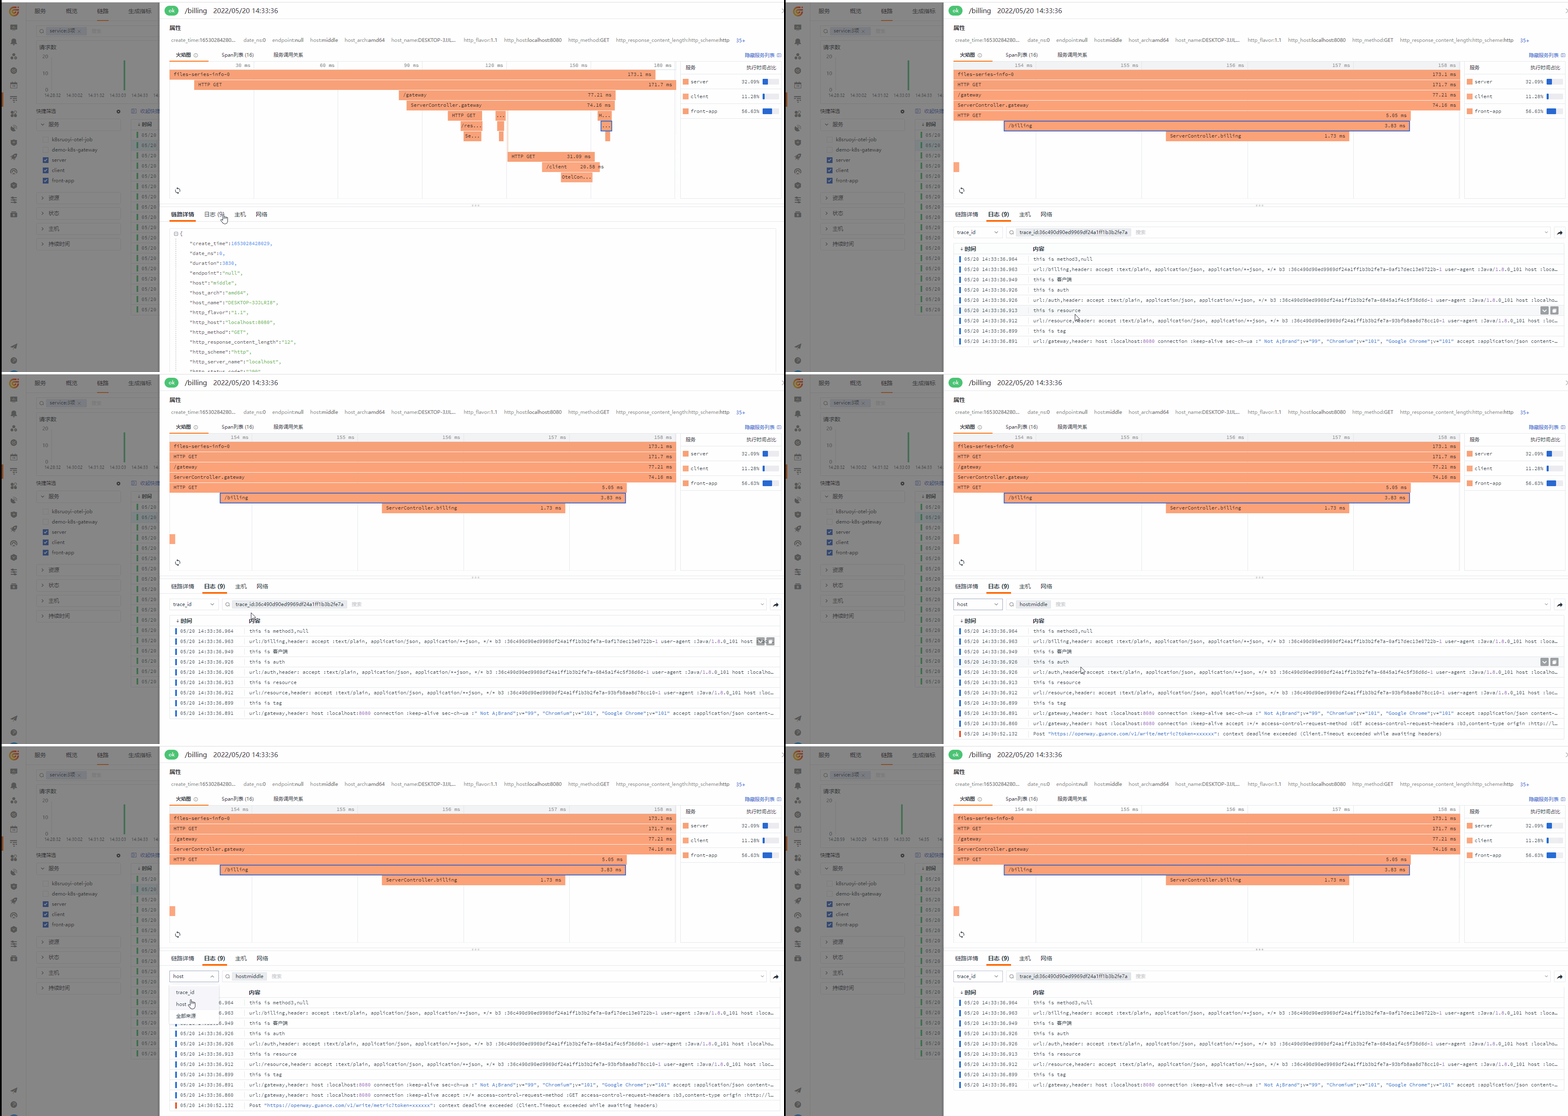
Log Explorer
Traces (Application Performance Monitoring (APM))
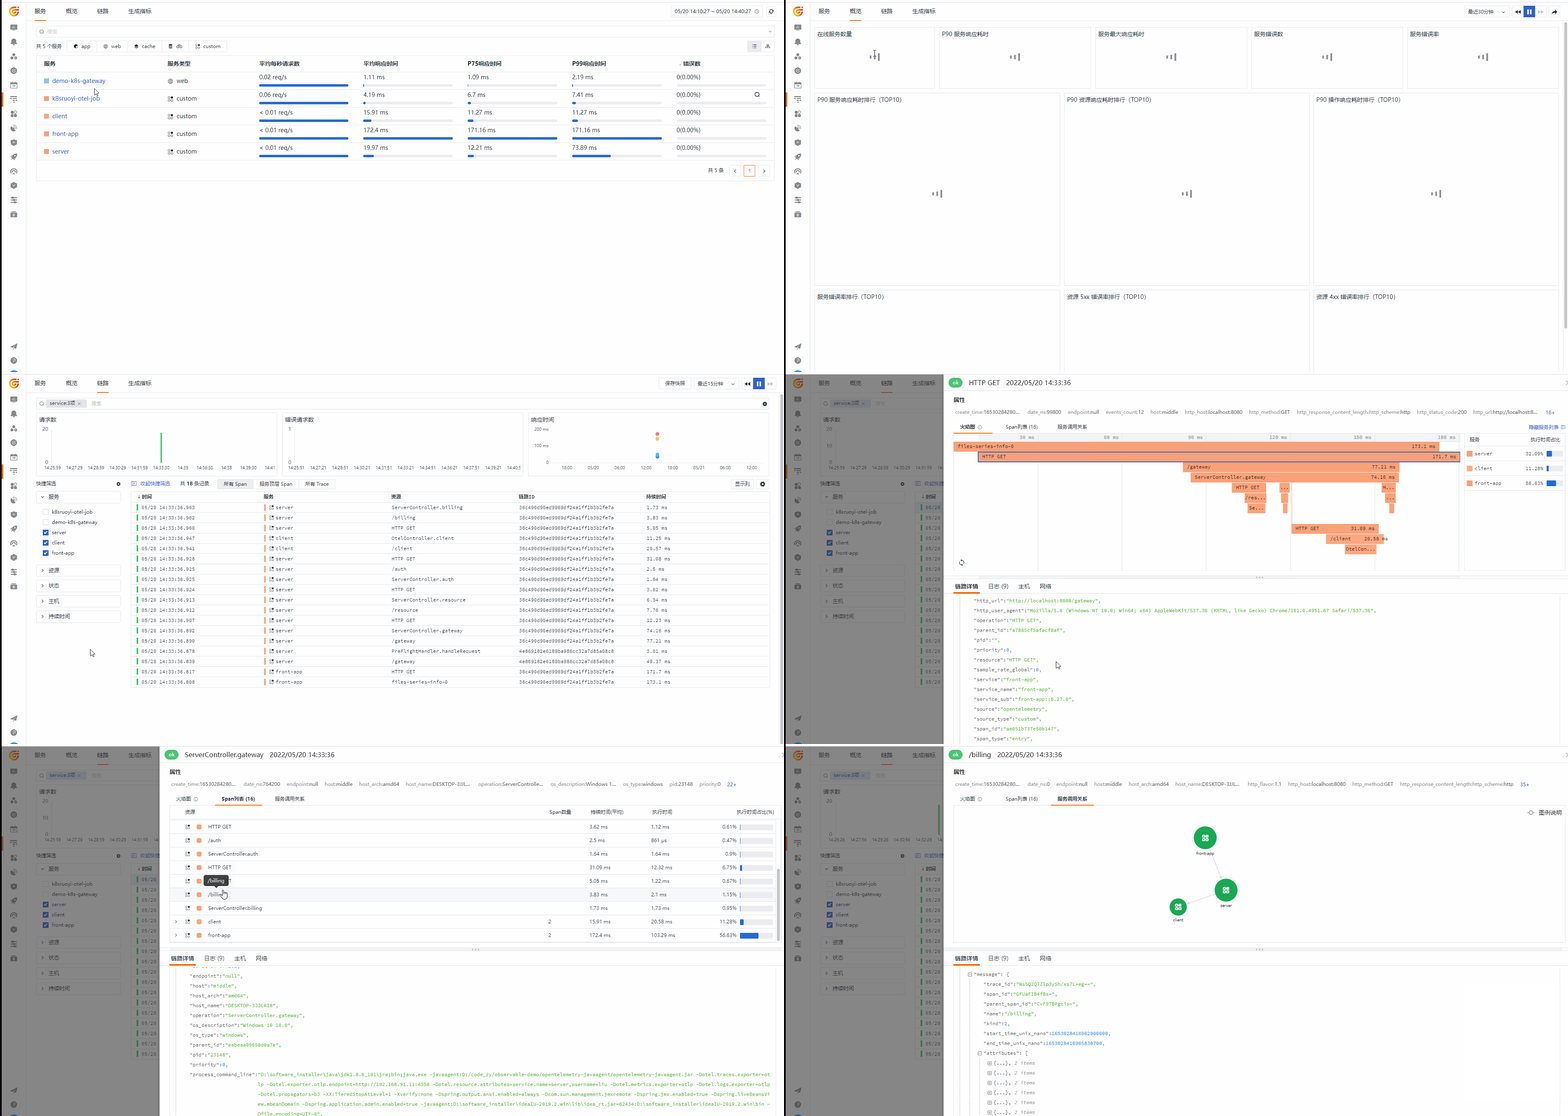
View Logs from Traces
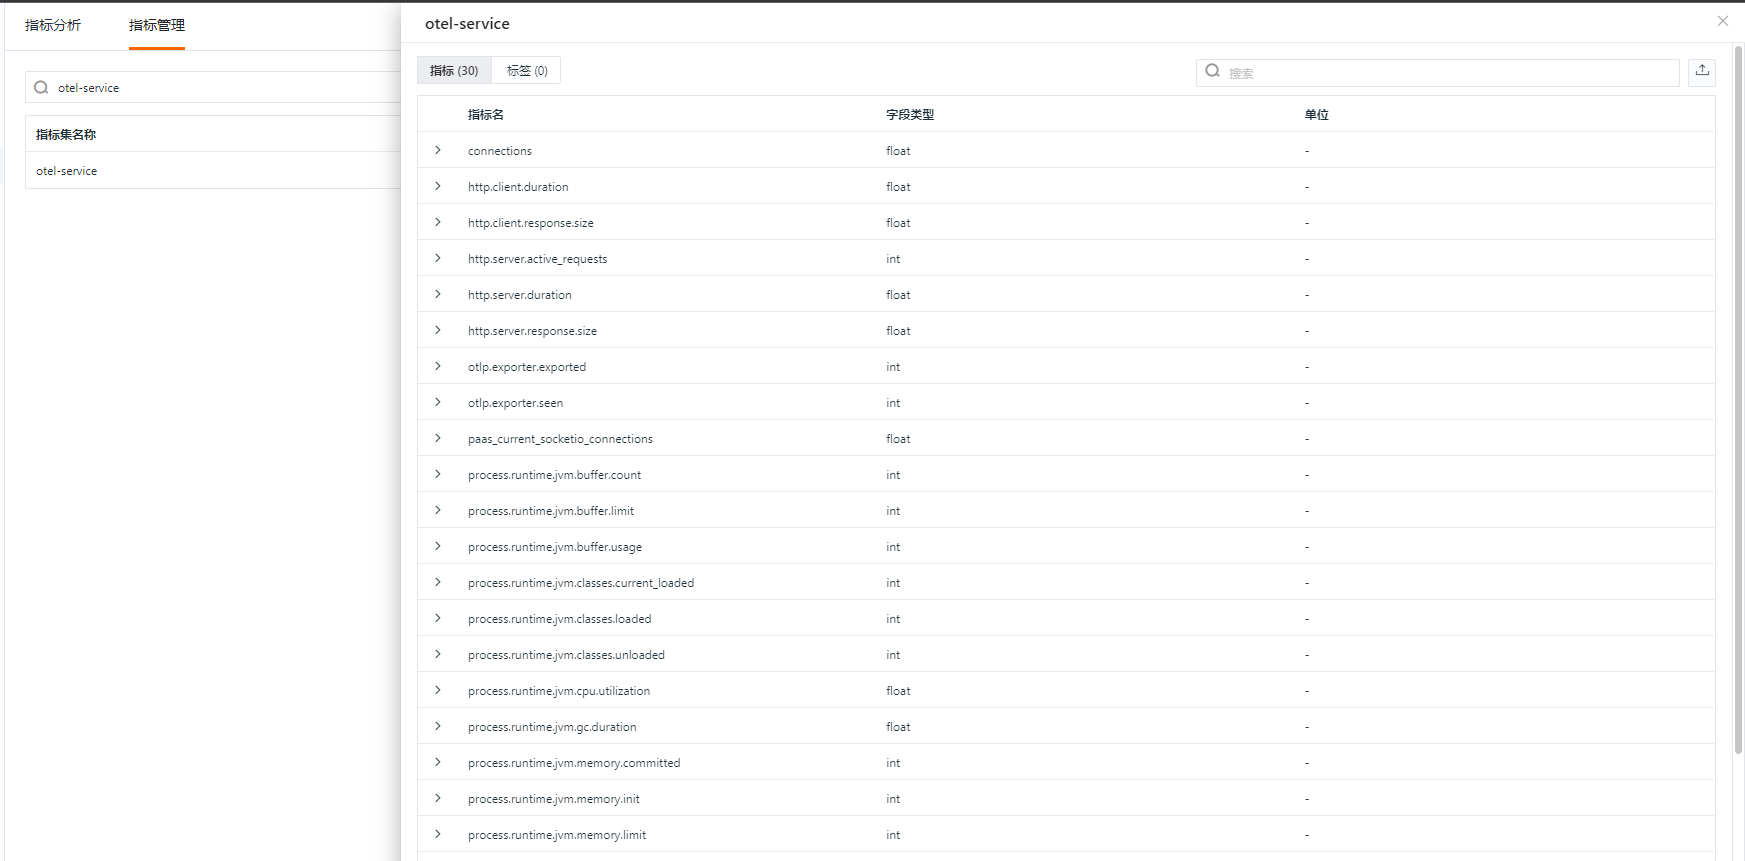
Application Metrics
Application metrics are stored in the measurement named otel-service.
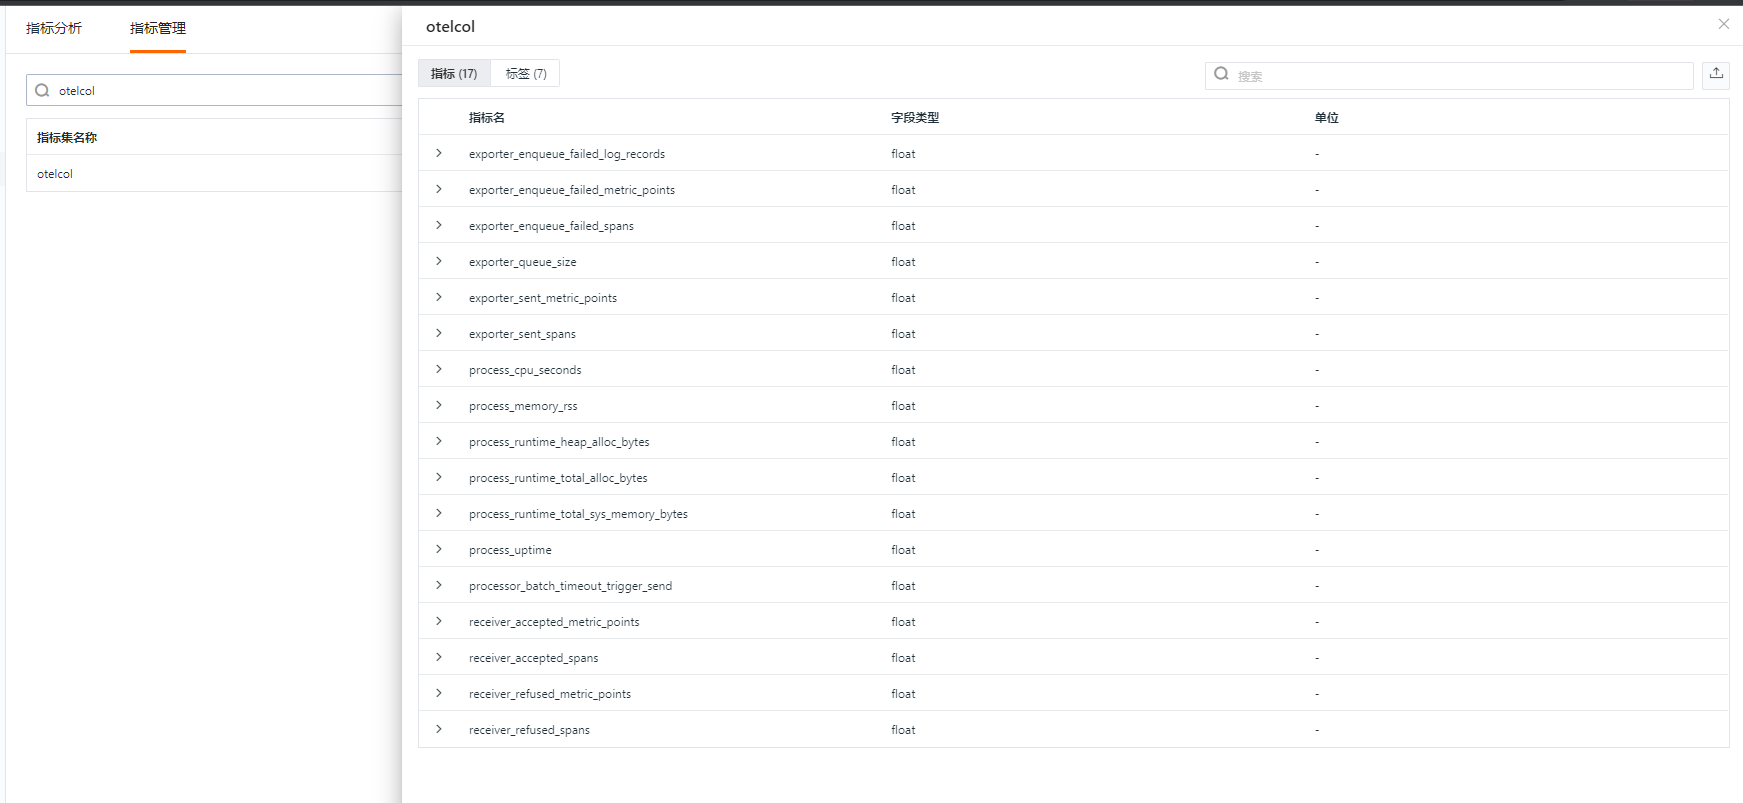
Otelcol Metrics
Otelcol Integration View