OpenTelemetry to Jaeger, Grafana, ELK
OpenTelemetry offers many open-source combination solutions. Here we introduce and demonstrate OpenTelemetry deployment on three different platforms/architectures.
OpenTelemetry
OTEL is the abbreviation for OpenTelemetry, an observability project under the CNCF. It aims to provide standardized solutions in the observability domain, addressing the standardization of data models, collection, processing, and export of observability data, offering vendor-agnostic services.
OpenTelemetry is a collection of standards and tools designed to manage observability data such as Traces, Metrics, Logs, etc. (new observability data types may emerge in the future). It has become the industry standard.
OTLP
OTLP (OpenTelemetry Protocol) is the native telemetry signal transmission protocol of OpenTelemetry. Although the OpenTelemetry project includes implementations of Zipkin v2 or Jaeger Thrift protocol formats, these are provided as third-party contribution libraries. Only OTLP is natively supported by the OpenTelemetry official project. The OTLP data model is defined using ProtoBuf. If you need to implement a backend service capable of collecting OTLP telemetry data, you need to understand its content. Refer to the code repository: opentelemetry-proto (https://github.com/open-telemetry/opentelemetry-proto)
OpenTelemetry-Collector
OpenTelemetry Collector (hereinafter referred to as "otel-collector") provides a vendor-agnostic implementation for receiving, processing, and exporting telemetry data. It eliminates the need to run, operate, and maintain multiple agents/collectors to support sending open-source observability data formats (e.g., Jaeger, Prometheus, etc.) to one or more open-source or commercial backends. Additionally, the collector gives end users control over their data. The collector is the default location where instrumentation libraries export their telemetry data.
OpenTelemetry-Java
OpenTelemetry SDK developed in Java supports pushing data to different observability platforms through various exporters.
OpenTelemetry-JS
Distributed tracing based on front-end JavaScript, introduced by OpenTelemetry.
Architecture
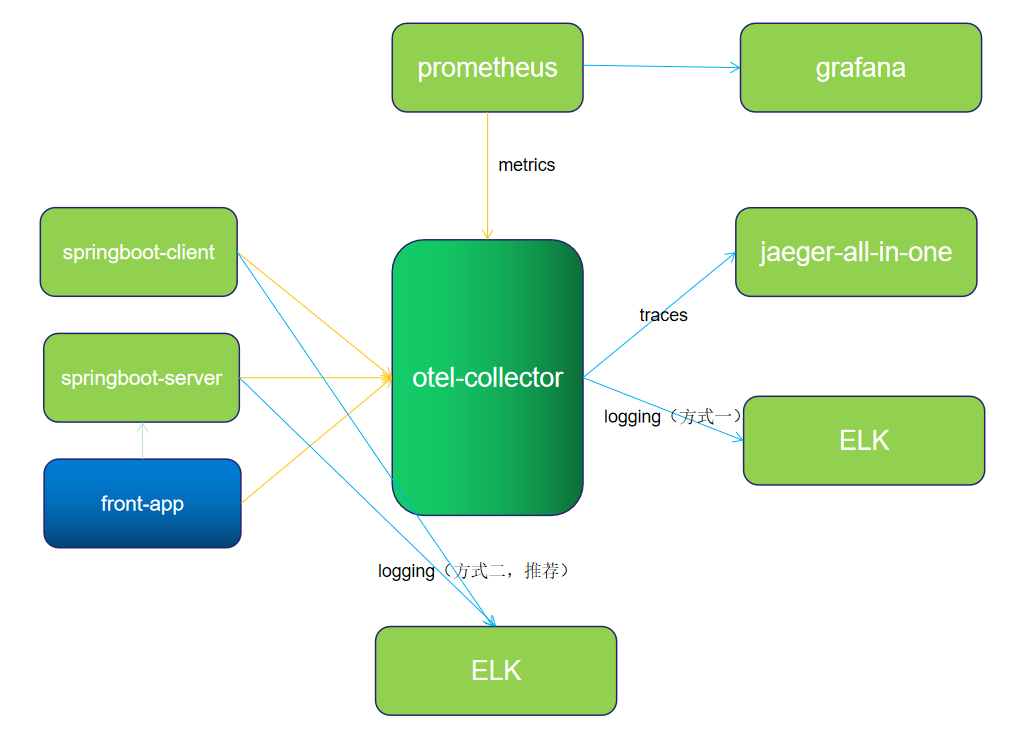
Architecture Description
- Application server and client push metric and trace data to the otel-collector via the otlp-exporter.
- The front-app is a front-end trace that pushes trace information to the otel-collector and accesses the application service API.
- The otel-collector collects and transforms the data, then pushes it to Jaeger and Zipkin.
- Prometheus pulls data from the otel-collector.
Two log push methods:
Method 1: Report logs via OTLP
The application server and client push logs to the otel-collector via the otlp-exporter, which then sends them to Elasticsearch via the otel-collector exporter. Since OpenTelemetry logs are not yet stable, it is recommended to handle logs separately, bypassing the otel-collector. During testing, conflicts were also found when configuring both log and metric exporters, mainly on the otel-collector side. We await an official fix.
Method 2: Report logs via Logback-logstash
The application server and client push logs to logstash via Logback-logstash.
The otel-collector is configured with four exporters.
  prometheus:
    endpoint: "0.0.0.0:8889"
    const_labels:
      label1: value1
  zipkin:
    endpoint: "http://otel_collector_zipkin:9411/api/v2/spans"
    format: proto
  jaeger:
    endpoint: otel_collector_jaeger:14250
    tls:
      insecure: true
  elasticsearch:
    endpoints: "http://192.168.0.17:9200"
Note: All applications are deployed on the same machine with IP 192.168.0.17. If applications and some middleware are deployed separately, modify the corresponding IP addresses accordingly. If using cloud servers, ensure relevant ports are opened to avoid access failures.
Installation and Deployment
Installing OpenTelemetry-Collector
Source Code Address
https://github.com/lrwh/observable-demo/tree/main/opentelemetry-collector-to-all
Configure otel-collector-config.yaml
Add a collector configuration with 1 receiver (otlp) and 4 exporters (prometheus, zipkin, jaeger, and elasticsearch).
receivers:
  otlp:
    protocols:
      grpc:
      http:
        cors:
          allowed_origins:
            - http://*
            - https://*
exporters:
  prometheus:
    endpoint: "0.0.0.0:8889"
    const_labels:
      label1: value1
  zipkin:
    endpoint: "http://otel_collector_zipkin:9411/api/v2/spans"
    format: proto

  jaeger:
    endpoint: otel_collector_jaeger:14250
    tls:
      insecure: true
  elasticsearch:
    endpoints: "http://192.168.0.17:9200"

processors:
  batch:

extensions:
  health_check:
  pprof:
    endpoint: :1888
  zpages:
    endpoint: :55679

service:
  extensions: [pprof, zpages, health_check]
  pipelines:
    traces:
      receivers: [otlp]
      processors: [batch]
      exporters: [zipkin, jaeger]
    metrics:
      receivers: [otlp]
      processors: [batch]
      exporters: [prometheus]
    logs:
      receivers: [otlp]
      processors: [batch]
      exporters: [elasticsearch]
Install otel-collector via docker-compose.
version: '3.3'

services:
    jaeger:
        image: jaegertracing/all-in-one:1.29
        container_name: otel_collector_jaeger
        ports:
            - 16686:16686
            - 14250
            - 14268
    zipkin:
        image: openzipkin/zipkin:latest
        container_name: otel_collector_zipkin
        ports:
            - 9411:9411
    # Collector
    otel-collector:
        image: otel/opentelemetry-collector:0.50.0
        command: ["--config=/etc/otel-collector-config.yaml"]
        volumes:
            - ./otel-collector-config.yaml:/etc/otel-collector-config.yaml
        ports:
            - "1888:1888"   # pprof extension
            - "8888:8888"   # Prometheus metrics exposed by the collector
            - "8889:8889"   # Prometheus exporter metrics
            - "13133:13133" # health_check extension
            - "4317:4317"        # OTLP gRPC receiver
            - "4318:4318"        # OTLP http receiver
            - "55670:55679" # zpages extension
        depends_on:
            - jaeger
            - zipkin
    prometheus:
        container_name: prometheus
        image: prom/prometheus:latest
        volumes:
            - ./prometheus.yaml:/etc/prometheus/prometheus.yml
        ports:
            - "9090:9090"
    grafana:
        container_name: grafana
        image: grafana/grafana
        ports:
            - "3000:3000"
Configure Prometheus
scrape_configs:
  - job_name: 'otel-collector'
    scrape_interval: 10s
    static_configs:
      - targets: ['otel-collector:8889']
      - targets: ['otel-collector:8888']
Start Containers
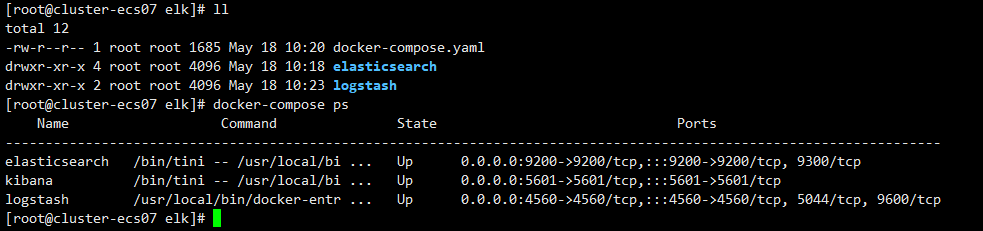
Check Startup Status

Installing ELK with Docker
Using Docker to install ELK is simple and convenient. The relevant component version is 7.16.2.
Pull Images
docker pull docker.elastic.co/elasticsearch/elasticsearch:7.16.2
docker pull docker.elastic.co/logstash/logstash:7.16.2
docker pull docker.elastic.co/kibana/kibana:7.16.2
Configuration Directory
# Linux-specific configuration
sysctl -w vm.max_map_count=262144
sysctl -p
# End of Linux configuration

mkdir -p ~/elk/elasticsearch/plugins
mkdir -p ~/elk/elasticsearch/data
mkdir -p ~/elk/logstash
chmod 777 ~/elk/elasticsearch/data
Logstash Configuration
input {
  tcp {
    mode => "server"
    host => "0.0.0.0"
    port => 4560
    codec => json_lines
  }
}
output {
  elasticsearch {
    hosts => "es:9200"
    index => "springboot-logstash-demo-%{+YYYY.MM.dd}"
  }
}
tcp : TCP protocol. port: TCP port codec: JSON line parsing
Docker-compose Configuration
version: '3'
services:
  elasticsearch:
    image: docker.elastic.co/elasticsearch/elasticsearch:7.16.2
    container_name: elasticsearch
    volumes:
      - ~/elk/elasticsearch/plugins:/usr/share/elasticsearch/plugins # Plugin file mount
      - ~/elk/elasticsearch/data:/usr/share/elasticsearch/data # Data file mount
    environment:
      - "cluster.name=elasticsearch" # Set cluster name to elasticsearch
      - "discovery.type=single-node" # Start in single-node mode
      - "ES_JAVA_OPTS=-Xms512m -Xmx512m" # Set JVM memory size
      - "ingest.geoip.downloader.enabled=false" # (Dynamic, Boolean) If true, Elasticsearch automatically downloads and manages updates for GeoIP2 databases from the ingest.geoip.downloader.endpoint. If false, Elasticsearch does not download updates and deletes all downloaded databases. Defaults to true.
    ports:
      - 9200:9200
  logstash:
    image: docker.elastic.co/logstash/logstash:7.16.2
    container_name: logstash
    volumes:
      - ~/elk/logstash/logstash.conf:/usr/share/logstash/pipeline/logstash.conf # Mount logstash configuration file
    depends_on:
      - elasticsearch # Kibana starts after elasticsearch
    links:
      - elasticsearch:es # Use the domain name "es" to access elasticsearch service
    ports:
      - 4560:4560
  kibana:
    image: docker.elastic.co/kibana/kibana:7.16.2
    container_name: kibana
    depends_on:
      - elasticsearch # Kibana starts after elasticsearch
    links:
      - elasticsearch:es # Use the domain name "es" to access elasticsearch service
    environment:
      - "elasticsearch.hosts=http://es:9200" # Set the address to access elasticsearch
    ports:
      - 5601:5601
Start Containers
Check Startup Status
Springboot Application Integration (APM)
Source Code Address
https://github.com/lrwh/observable-demo/tree/main/springboot-server
Start Server
java -javaagent:opentelemetry-javaagent-1.13.1.jar \
-Dotel.traces.exporter=otlp \
-Dotel.exporter.otlp.endpoint=http://localhost:4350 \
-Dotel.resource.attributes=service.name=server,username=liu \
-Dotel.metrics.exporter=otlp \
-Dotel.logs.exporter=otlp \
-Dotel.propagators=b3 \
-jar springboot-server.jar --client=true
Start Client
java -javaagent:opentelemetry-javaagent-1.13.1.jar \
-Dotel.traces.exporter=otlp \
-Dotel.exporter.otlp.endpoint=http://localhost:4350 \
-Dotel.resource.attributes=service.name=client,username=liu \
-Dotel.metrics.exporter=otlp \
-Dotel.logs.exporter=otlp \
-Dotel.propagators=b3 \
-jar springboot-client.jar
Parameter Description
otel.traces.exporter: otlp # Configure exporter type to otlp, default is otlp.
otel.exporter.otlp.endpoint: otlp exporter endpoint (grpc)
otel.resource.attributes: Configure tags.
otel.metrics.exporter: otlp # Configure metrics exporter type, default is none.
otel.logs.exporter: otlp # Configure logs exporter type, default is none.
otel.propagators: Configure trace propagator.
Since OpenTelemetry logs are not yet stable and mature, production use is not recommended. Some bugs were encountered during testing. Use for learning purposes only.
Springboot Application Integration (Log)
Method 1: Report Logs via OTLP
The application server and client push logs to the otel-collector via the otlp-exporter, which then sends them to Elasticsearch via the otel-collector exporter.
Modify Startup Parameters
Add the parameter -Dotel.logs.exporter=otlp when starting the application.
java -javaagent:opentelemetry-javaagent-1.13.1.jar \
-Dotel.traces.exporter=otlp \
-Dotel.exporter.otlp.endpoint=http://localhost:4350 \
-Dotel.resource.attributes=service.name=server,username=liu \
-Dotel.metrics.exporter=otlp \
-Dotel.logs.exporter=otlp \
-Dotel.propagators=b3 \
-jar springboot-server.jar --client=true
java -javaagent:opentelemetry-javaagent-1.13.1.jar \
-Dotel.traces.exporter=otlp \
-Dotel.exporter.otlp.endpoint=http://localhost:4350 \
-Dotel.resource.attributes=service.name=client,username=liu \
-Dotel.metrics.exporter=otlp \
-Dotel.logs.exporter=otlp \
-Dotel.propagators=b3 \
-jar springboot-client.jar
Method 2: Report Logs via Logstash-logback
This method uses the socket provided by Logstash-logback to upload logs to Logstash. Some code modifications are required.
1. Add Logstash-logback Dependency to Maven
<dependency>
  <groupId>net.logstash.logback</groupId>
  <artifactId>logstash-logback-encoder</artifactId>
  <version>7.0.1</version>
</dependency>
2. Create logback-logstash.xml
<?xml version="1.0" encoding="UTF-8"?>
<configuration scan="true" scanPeriod="30 seconds">
    <!-- Some parameters come from properties files -->
    <springProperty scope="context" name="logName" source="spring.application.name" defaultValue="localhost.log"/>
    <!-- Allows dynamic modification of log levels after configuration -->
    <jmxConfigurator />
    <property name="log.pattern" value="%d{HH:mm:ss} [%thread] %-5level %logger{10} [traceId=%X{trace_id} spanId=%X{span_id} userId=%X{user-id}] %msg%n" />

    <springProperty scope="context" name="logstashHost" source="logstash.host" defaultValue="logstash"/>
    <springProperty scope="context" name="logstashPort" source="logstash.port" defaultValue="4560"/>
    <!-- %m output message, %p log level, %t thread name, %d date, %c full class name,,,, -->
    <appender name="STDOUT" class="ch.qos.logback.core.ConsoleAppender">
        <encoder>
            <pattern>${log.pattern}</pattern>
            <charset>UTF-8</charset>
        </encoder>
    </appender>

    <appender name="FILE" class="ch.qos.logback.core.rolling.RollingFileAppender">
        <file>logs/${logName}/${logName}.log</file>    <!-- Usage method -->
        <append>true</append>
        <rollingPolicy class="ch.qos.logback.core.rolling.SizeAndTimeBasedRollingPolicy">
            <fileNamePattern>logs/${logName}/${logName}-%d{yyyy-MM-dd}.log.%i</fileNamePattern>
            <maxFileSize>64MB</maxFileSize>
            <maxHistory>30</maxHistory>
            <totalSizeCap>1GB</totalSizeCap>
        </rollingPolicy>
        <encoder>
            <pattern>${log.pattern}</pattern>
            <charset>UTF-8</charset>
        </encoder>
    </appender>

    <!-- LOGSTASH output settings -->
    <appender name="LOGSTASH" class="net.logstash.logback.appender.LogstashTcpSocketAppender">
        <!-- Configure LogStash service address -->
        <destination>${logstashHost}:${logstashPort}</destination>
        <!-- Log output encoding -->
        <encoder class="net.logstash.logback.encoder.LoggingEventCompositeJsonEncoder">
            <providers>
                <timestamp>
                    <timeZone>UTC+8</timeZone>
                </timestamp>
                <pattern>
                    <pattern>
                        {
                        "podName":"${podName:-}",
                        "namespace":"${k8sNamespace:-}",
                        "severity": "%level",
                        "serverName": "${logName:-}",
                        "traceId": "%X{trace_id:-}",
                        "spanId": "%X{span_id:-}",
                        "pid": "${PID:-}",
                        "thread": "%thread",
                        "class": "%logger{40}",
                        "message": "%message\n%exception"
                        }
                    </pattern>
                </pattern>
            </providers>
        </encoder>
        <!-- Keep-alive -->
        <keepAliveDuration>5 minutes</keepAliveDuration>
    </appender>

    <!-- Only print ERROR level content -->
    <logger name="net.sf.json" level="ERROR" />
    <logger name="org.springframework" level="ERROR" />

    <root level="info">
        <appender-ref ref="STDOUT"/>
        <appender-ref ref="LOGSTASH"/>
    </root>
</configuration>
3. Create application-logstash.yml
4. Rebuild the Package
5. Start the Service
java -javaagent:opentelemetry-javaagent-1.13.1.jar \
-Dotel.traces.exporter=otlp \
-Dotel.exporter.otlp.endpoint=http://localhost:4350 \
-Dotel.resource.attributes=service.name=server,username=liu \
-Dotel.metrics.exporter=otlp \
-Dotel.propagators=b3 \
-jar springboot-server.jar --client=true \
--spring.profiles.active=logstash \
--logstash.host=localhost \
--logstash.port=4560
java -javaagent:opentelemetry-javaagent-1.13.1.jar \
-Dotel.traces.exporter=otlp \
-Dotel.exporter.otlp.endpoint=http://localhost:4350 \
-Dotel.resource.attributes=service.name=client,username=liu \
-Dotel.metrics.exporter=otlp \
-Dotel.logs.exporter=otlp \
-Dotel.propagators=b3 \
-jar springboot-client.jar \
--spring.profiles.active=logstash \
--logstash.host=localhost \
--logstash.port=4560
JS Integration (RUM)
Source Code Address
https://github.com/lrwh/observable-demo/tree/main/opentelemetry-js
Configure OTLPTraceExporter
const otelExporter = new OTLPTraceExporter({
  // optional - url default value is http://localhost:55681/v1/traces
  url: 'http://192.168.91.11:4318/v1/traces',
  headers: {},
});
The url here is the otlp receiver address of the otel-collector (HTTP protocol).
Configure server_name
const providerWithZone = new WebTracerProvider({
      resource: new Resource({
        [SemanticResourceAttributes.SERVICE_NAME]: 'front-app',
      }),
    }
);
Install
Start
Default port8090
APM and RUM Correlation
APM and RUM are correlated mainly through header parameters. To maintain consistency, a unified propagator (Propagator) needs to be configured. Here, RUM uses B3, so APM also needs to be configured with B3. Simply add -Dotel.propagators=b3 to the APM startup parameters.
APM and Log Correlation
APM and Log are correlated mainly by embedding traceId and spanId in the log. Different log integration methods have different injection points.
UI Display
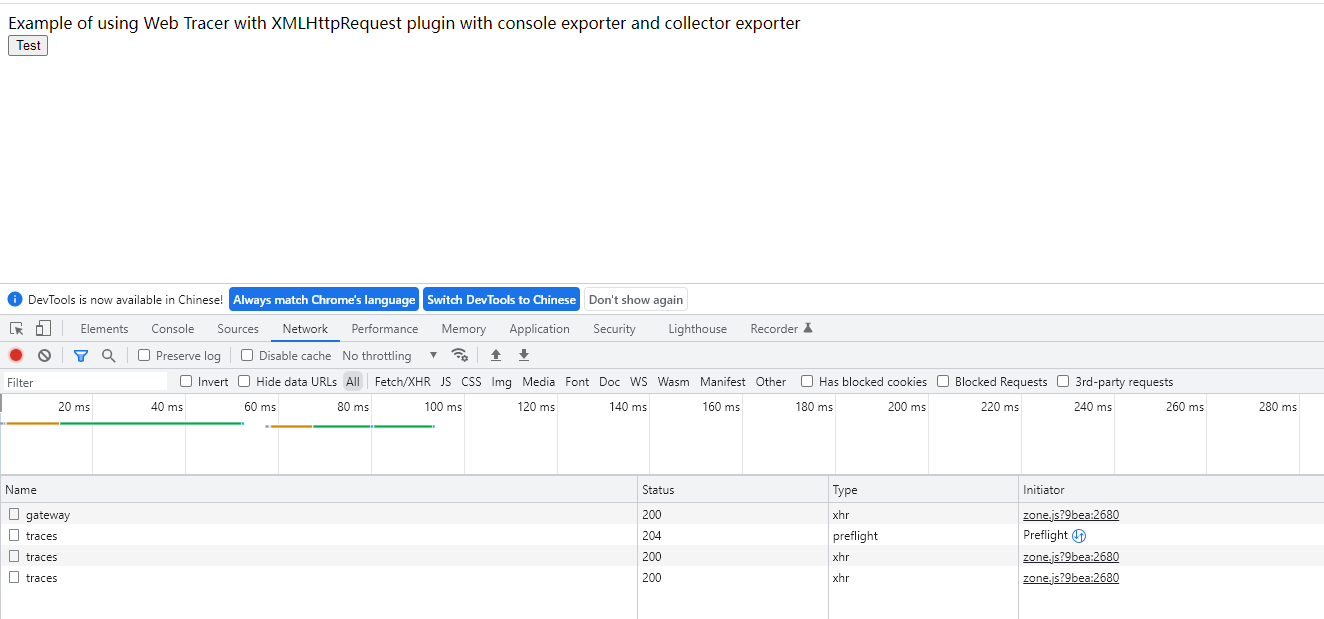
Access the front-end URL to generate trace information.
ELK Log Display
ELK stands for ElasticSearch, Logstash, Kibana.
Report Logs via OTLP
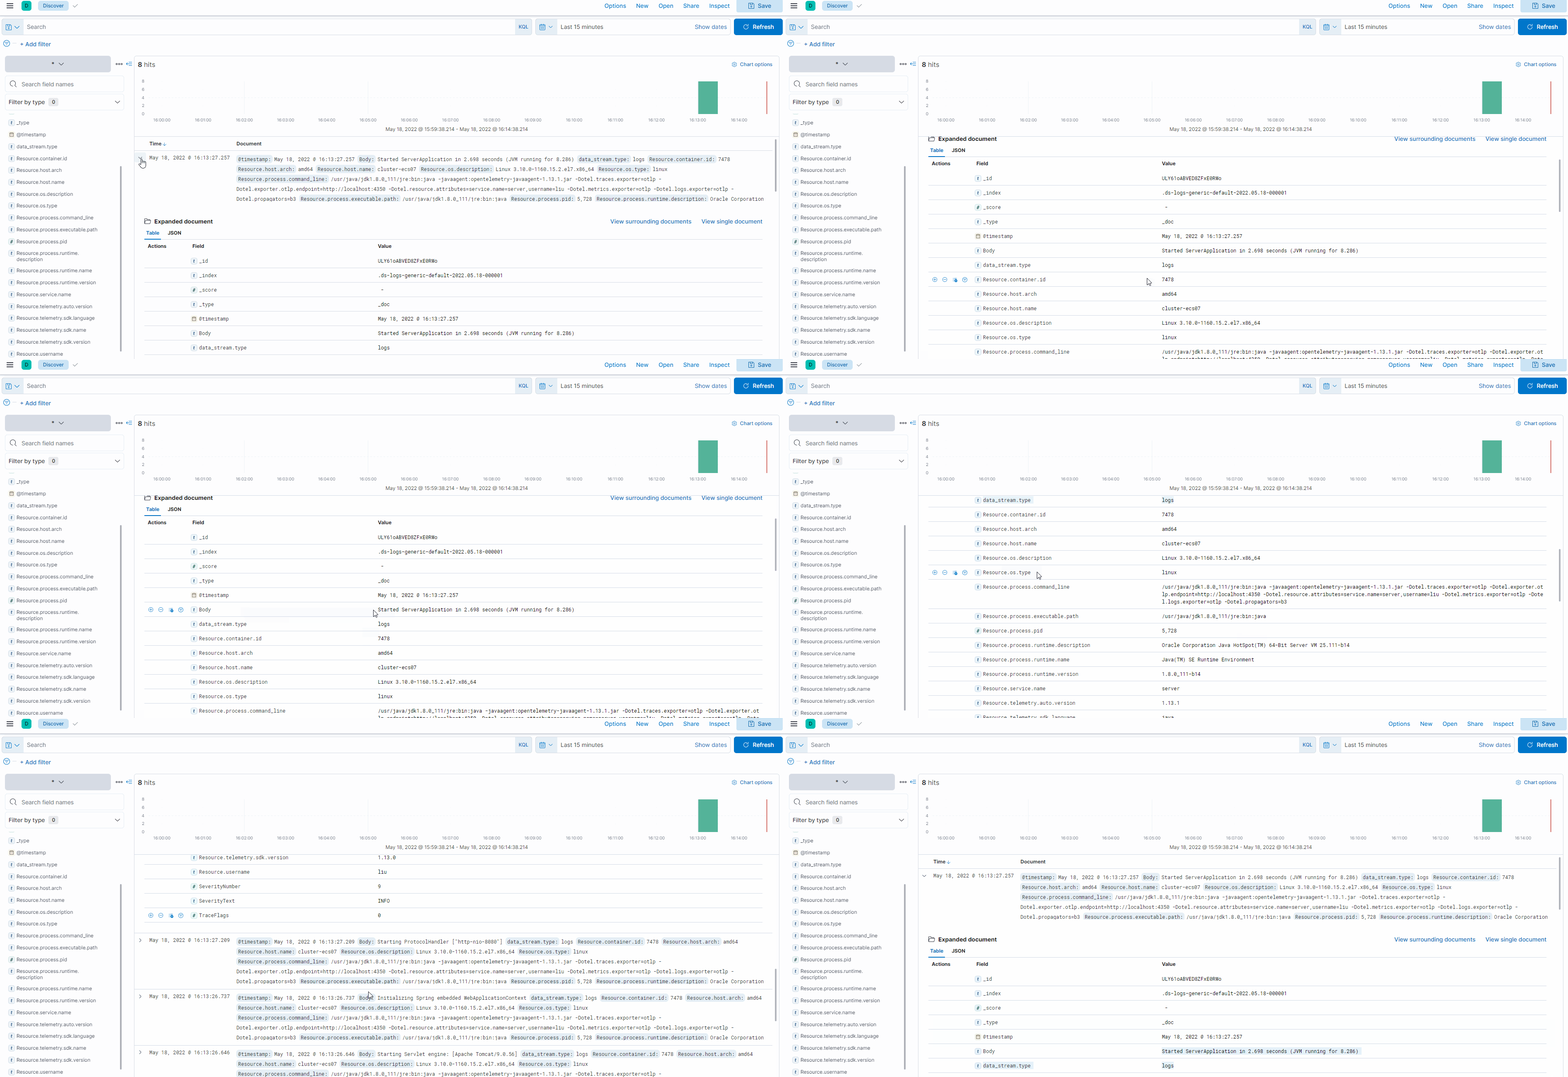
Expanded log source section:
"_source": {
  "@timestamp": "2022-05-18T08:39:20.661000000Z",
  "Body": "this is method3,null",
  "Resource.container.id": "7478",
  "Resource.host.arch": "amd64",
  "Resource.host.name": "cluster-ecs07",
  "Resource.os.description": "Linux 3.10.0-1160.15.2.el7.x86_64",
  "Resource.os.type": "linux",
  "Resource.process.command_line": "/usr/java/jdk1.8.0_111/jre:bin:java -javaagent:opentelemetry-javaagent-1.13.1.jar -Dotel.traces.exporter=otlp -Dotel.exporter.otlp.endpoint=http://localhost:4350 -Dotel.resource.attributes=service.name=server,username=liu -Dotel.metrics.exporter=otlp -Dotel.logs.exporter=otlp -Dotel.propagators=b3",
  "Resource.process.executable.path": "/usr/java/jdk1.8.0_111/jre:bin:java",
  "Resource.process.pid": 5728,
  "Resource.process.runtime.description": "Oracle Corporation Java HotSpot(TM) 64-Bit Server VM 25.111-b14",
  "Resource.process.runtime.name": "Java(TM) SE Runtime Environment",
  "Resource.process.runtime.version": "1.8.0_111-b14",
  "Resource.service.name": "server",
  "Resource.telemetry.auto.version": "1.13.1",
  "Resource.telemetry.sdk.language": "java",
  "Resource.telemetry.sdk.name": "opentelemetry",
  "Resource.telemetry.sdk.version": "1.13.0",
  "Resource.username": "liu",
  "SeverityNumber": 9,
  "SeverityText": "INFO",
  "SpanId": "bb890485f7b6ba05",
  "TraceFlags": 1,
  "TraceId": "b4841a6b3ec9aa93d7f002393a156ff5"
  },
Through the otlp protocol, traceId and spanId are automatically injected into the log.
Report Logs via Logstash-logback
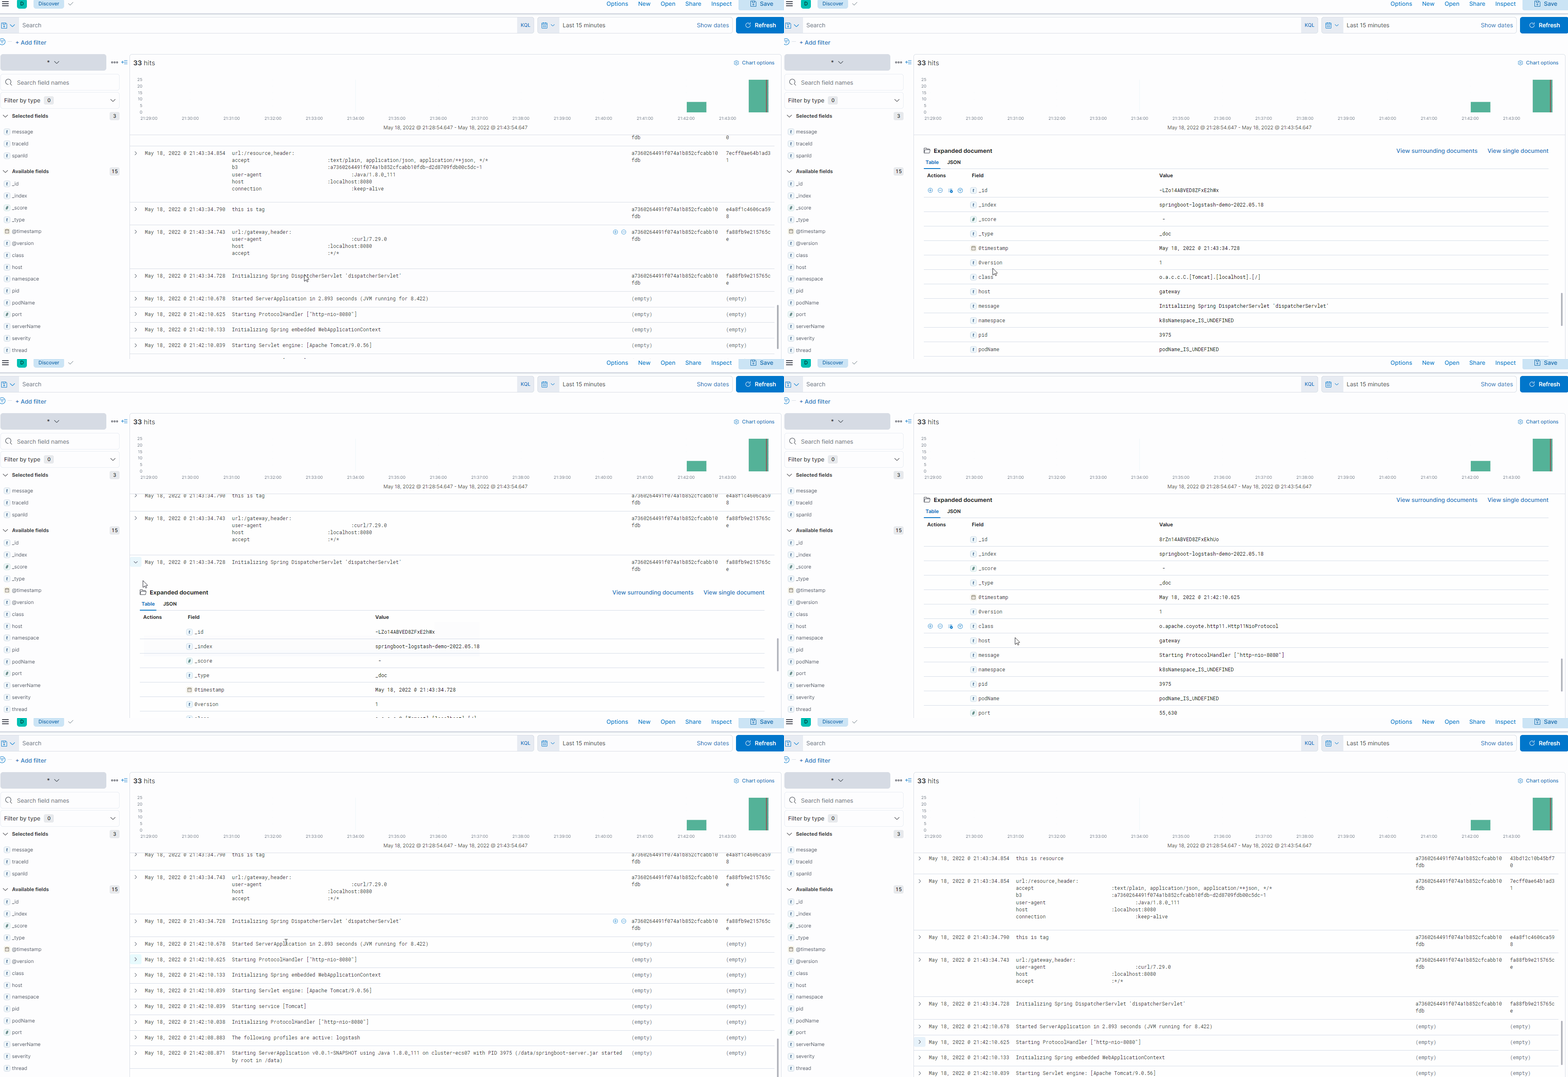
Expanded log source section:
  "_source": {
    "@timestamp": "2022-05-18T13:43:34.790Z",
    "port": 55630,
    "serverName": "otlp-server",
    "namespace": "k8sNamespace_IS_UNDEFINED",
    "message": "this is tag\n",
    "@version": "1",
    "severity": "INFO",
    "thread": "http-nio-8080-exec-1",
    "pid": "3975",
    "host": "gateway",
    "class": "c.z.o.server.controller.ServerController",
    "traceId": "a7360264491f074a1b852cfcabb10fdb",
    "spanId": "e4a8f1c4606ca598",
    "podName": "podName_IS_UNDEFINED"
  },
With the Logstash-logback method, traceId and spanId need to be manually injected.
Prometheus & Grafana Metrics Display
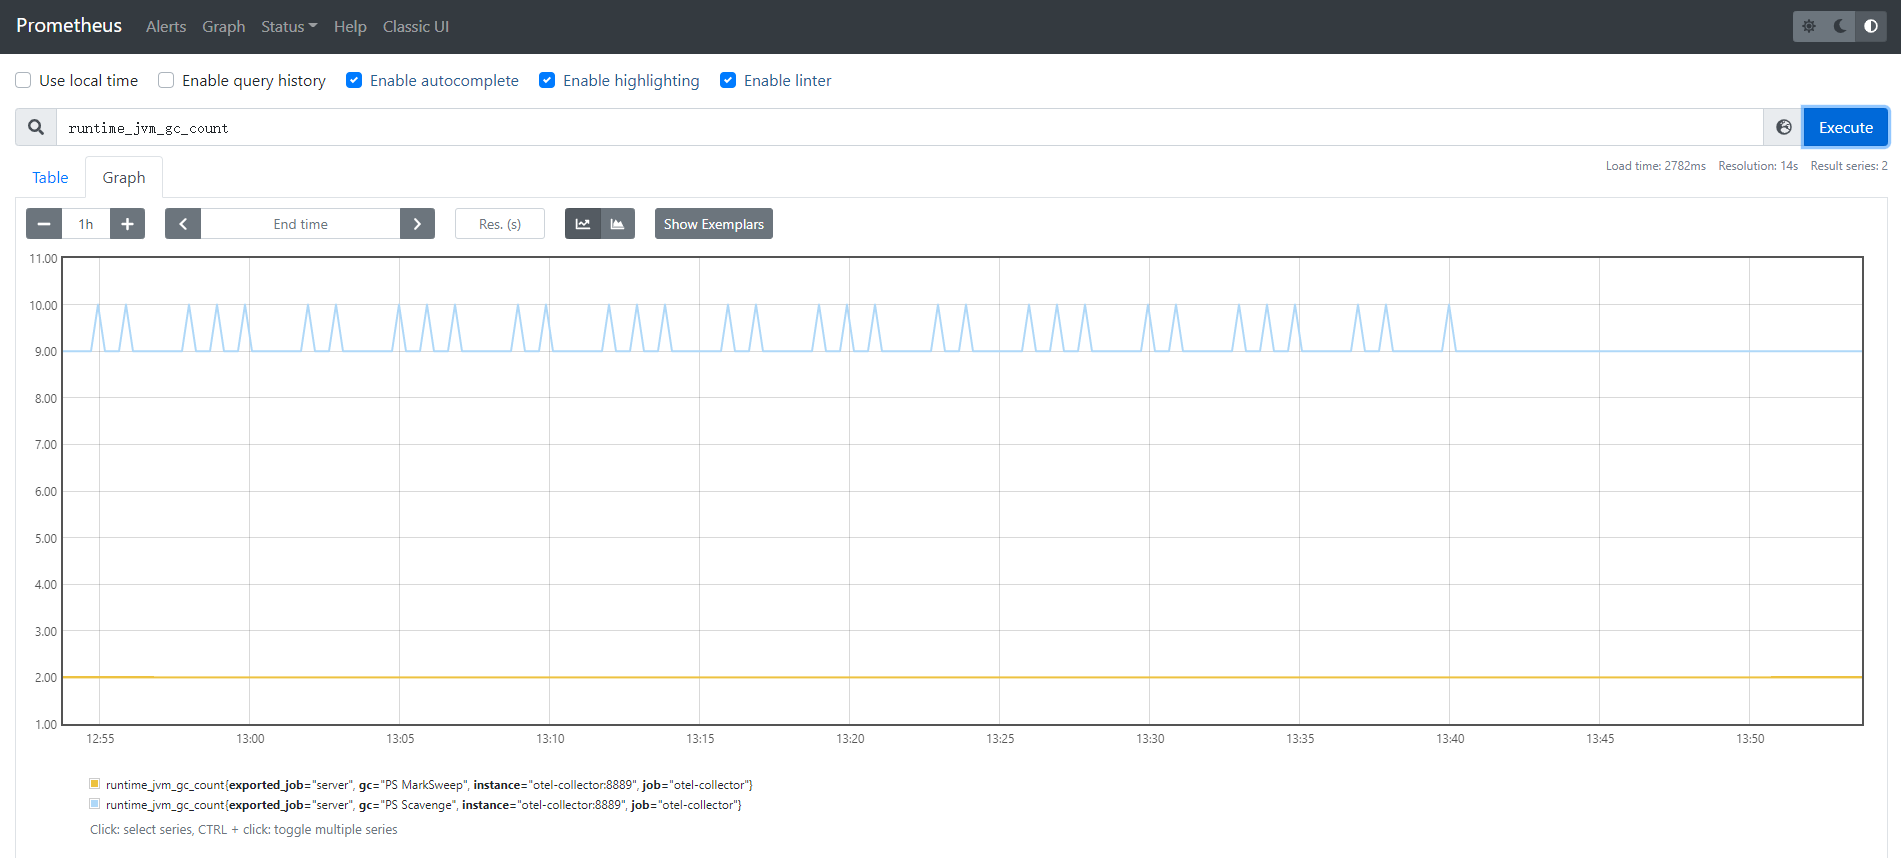
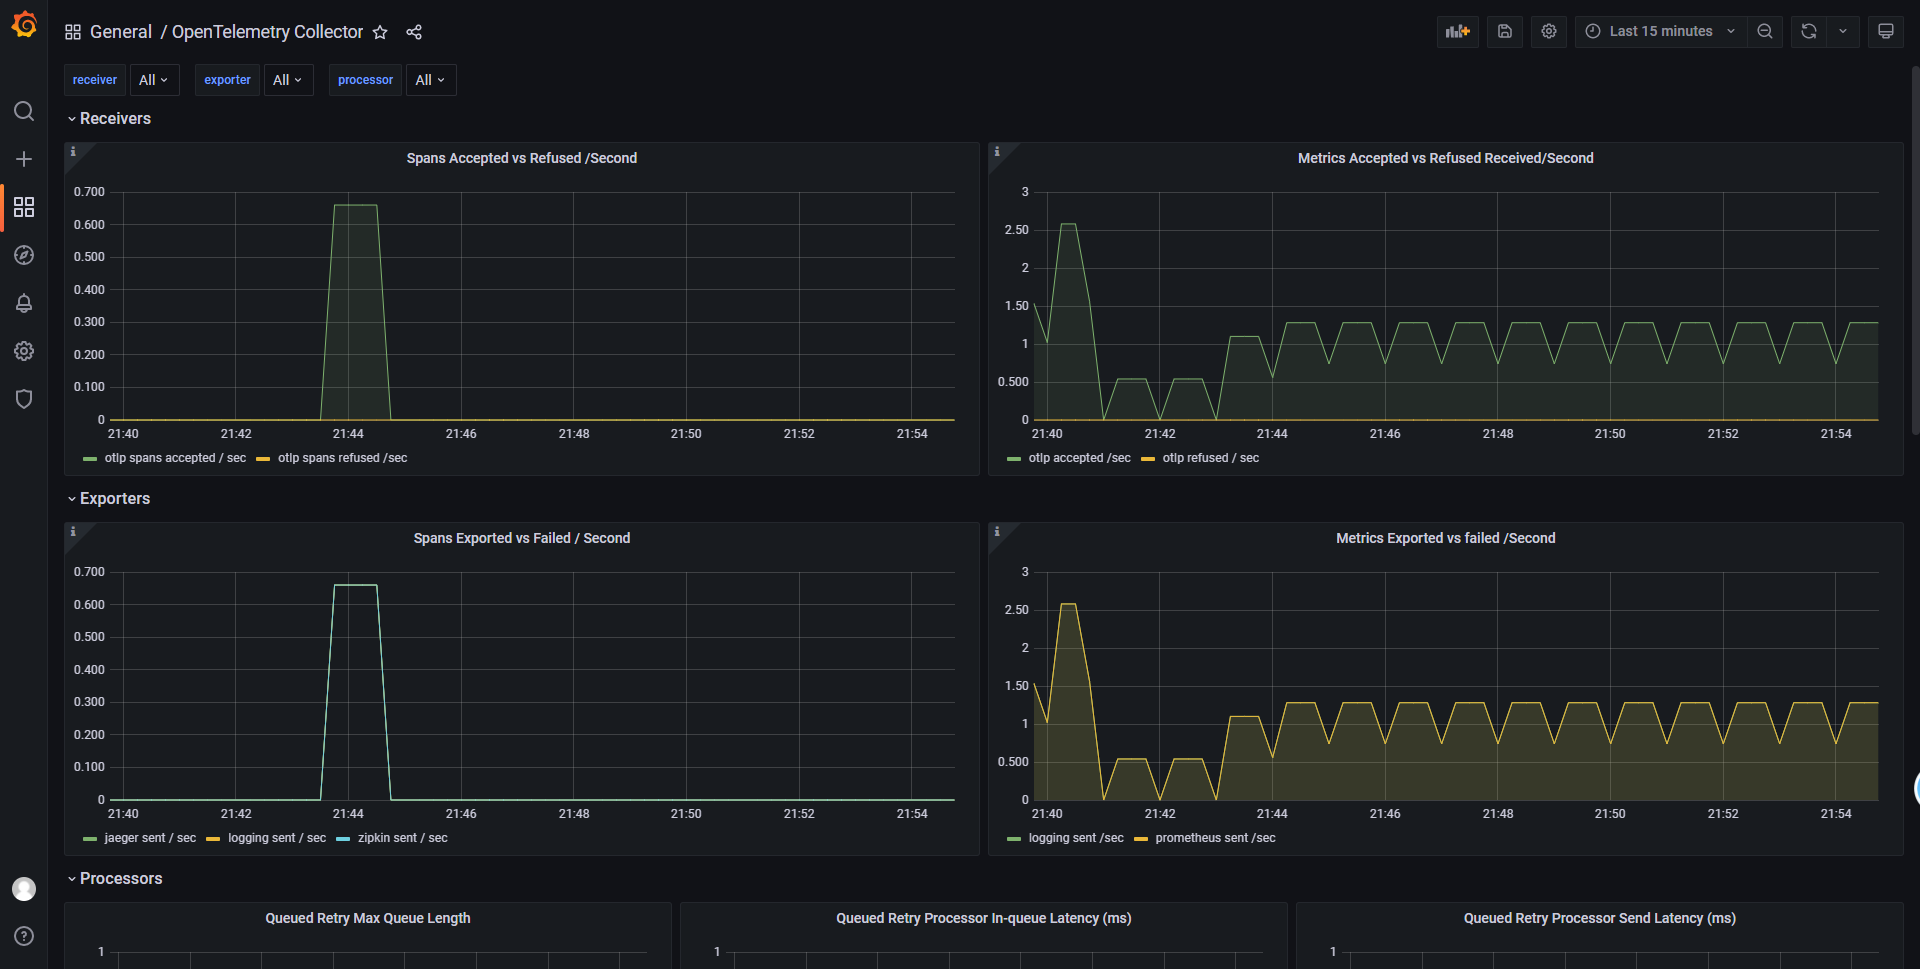
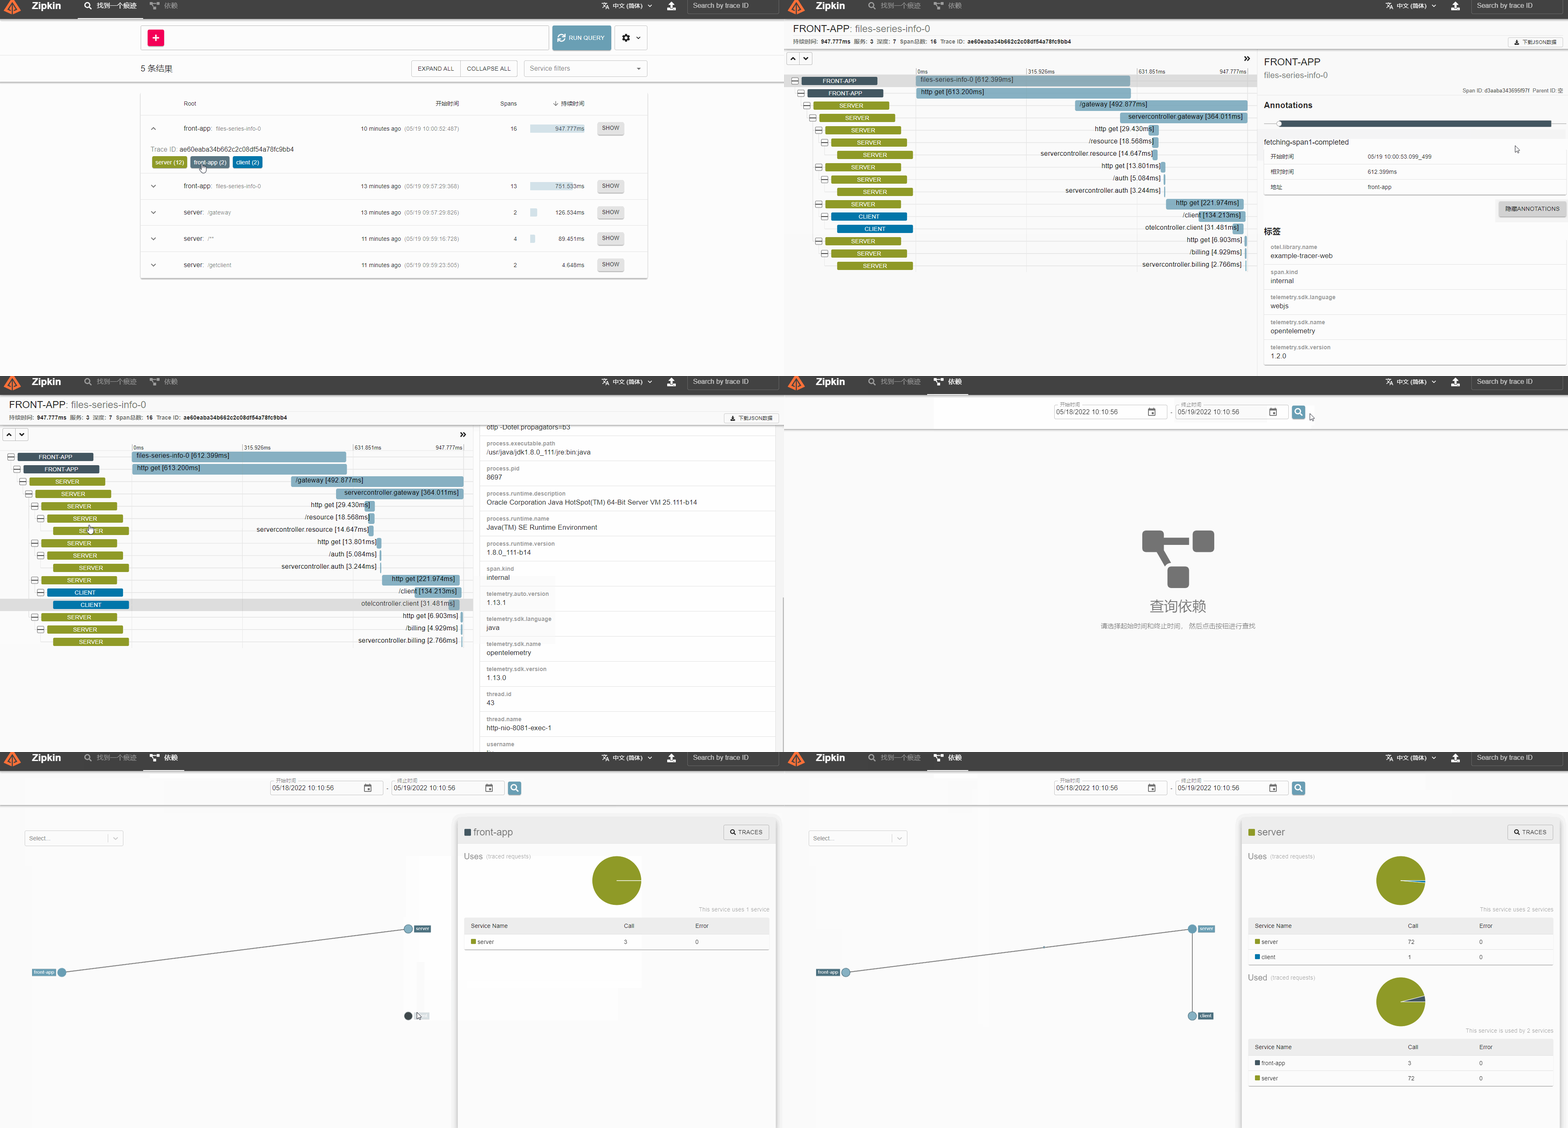
Jaeger, Zipkin Trace Display
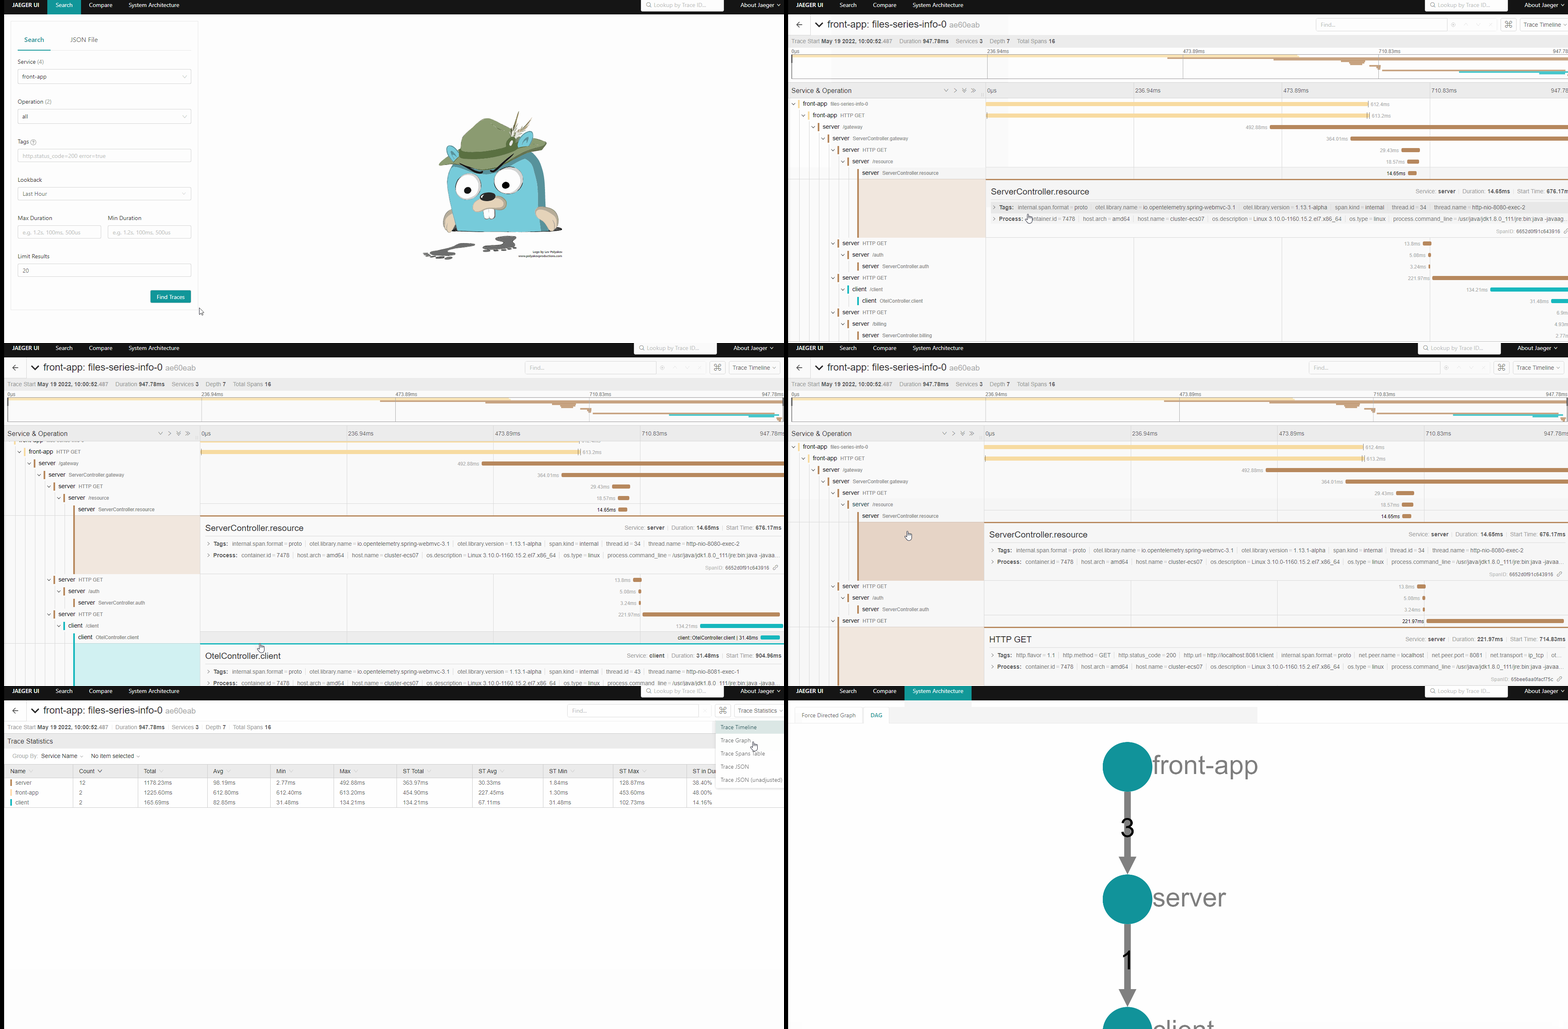
Next article will introduce how OpenTelemetry performs observability based on Grafana related components.