Guance VS ELK, EFK
Overview of ELK, EFK, and Guance
As software systems become increasingly complex, logs are typically generated by servers and output to different files, usually including system logs, application logs, and security logs. These logs are stored on different machines in a distributed manner. When a system failure occurs, engineers often need to log into each server and use Linux scripting tools such as grep, sed, and awk to search for the root cause in the logs. Without a log system, you first need to locate the server handling the request. If multiple instances are deployed on that server, you must go to the log directory of each application instance to find the log files. Each application instance may also have its own log rotation policy (e.g., generating a new file daily) and log compression and archiving policies. This whole process makes troubleshooting and quickly identifying the root cause quite difficult.
When deployed to the cloud, logging into each node to view the logs of each module is generally not feasible. Not only is it inefficient, but sometimes security requirements prevent engineers from directly accessing physical nodes. Furthermore, large-scale software systems today almost always use cluster deployment, meaning multiple identical PODs are started for each service, and each container generates its own logs. From the logs alone, you cannot tell which POD generated them, making it even more difficult to view distributed logs.
Therefore, if we can centrally manage these logs and provide centralized search capabilities, we can not only improve diagnostic efficiency but also gain a comprehensive understanding of the system status, avoiding the passive situation of "firefighting" after incidents.
ELK
So, what exactly is ELK? "ELK" is the acronym for three open-source projects: Elasticsearch, Logstash, and Kibana. Elasticsearch is a search and analytics engine. Logstash is a server-side data processing pipeline that can ingest data from multiple sources simultaneously, transform it, and then send it to a "repository" such as Elasticsearch. Kibana allows users to visualize data using graphs and charts in Elasticsearch.
Elasticsearch
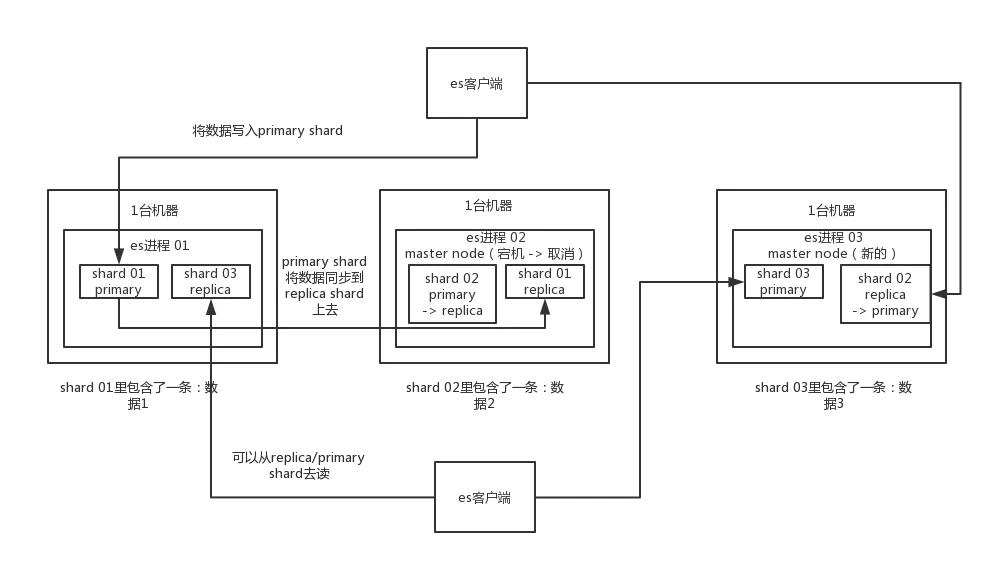
Elasticsearch is a JSON-based distributed search and analytics engine. It is accessible via a RESTful web service interface and uses schema-less JSON documents to store data. It is built on the Java programming language, enabling Elasticsearch to run on different platforms. It allows users to search very large amounts of data at high speed.
Key Features
- Distributed, real-time file storage where every field is indexed and searchable
- Distributed, real-time analytics search engine
- Can scale to hundreds of servers, handling PB-level structured or unstructured data
Logstash
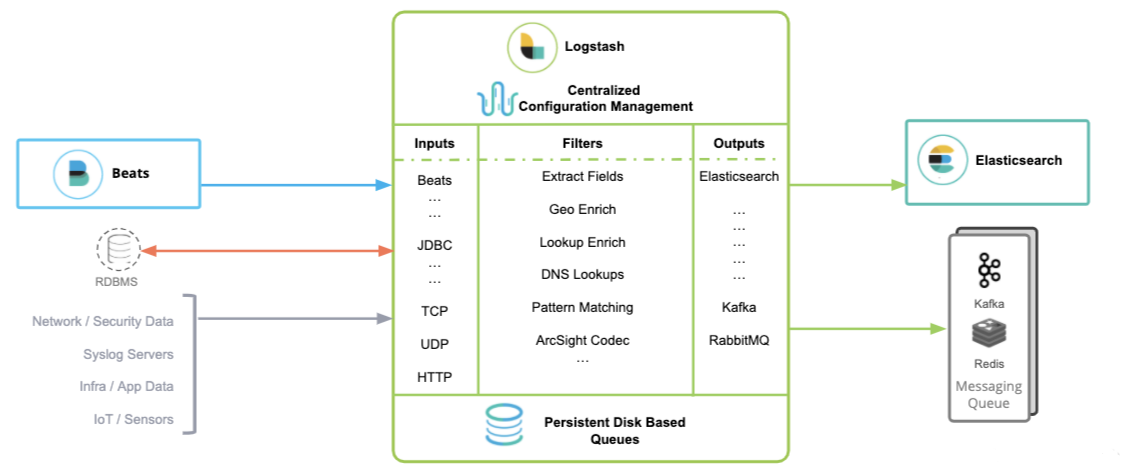
It is an open-source streaming ETL engine for data flows. It can build data flow pipelines within minutes, with horizontal scalability, resilience, adaptive buffering, a plugin ecosystem with over 200 integrations and processors, and monitoring and management of deployments using the Elastic Stack.
Key Features
- Can access almost any data
- Can integrate with multiple external applications
- Supports elastic scaling
Logstash Components
- Inputs: Inputs are mainly used to define rules for receiving data, such as collecting file content.
- Filters: Filters are mainly used to process the transmitted data, such as filtering data using Grok rules.
- Outputs: Outputs are mainly used to send the received data according to the defined output mode, such as outputting to Elasticsearch.
Kibana
Kibana is an open-source data analysis and visualization platform. It is a member of the Elastic Stack and is designed to work with Elasticsearch. You can use Kibana to search, view, and interact with data stored in Elasticsearch indices. You can easily perform diverse analysis and visualization of data using charts, tables, and maps.
Kibana makes big data easy to understand. Its simple, browser-based interface allows you to quickly create and share dynamic data dashboards to track real-time data changes in Elasticsearch.
EFK
EFK is not a single piece of software, but a solution. EFK is the acronym for three open-source software: Elasticsearch, Fluentd, and Kibana, or Elasticsearch, Filebeat, and Kibana. Among them, Elasticsearch is responsible for log analysis and storage, Fluentd and Filebeat are responsible for log collection, and Kibana is responsible for interface display. They work together seamlessly, efficiently meeting the needs of many use cases and are currently a mainstream log analysis system solution.
Fluentd
Fluentd is an open-source data collector designed for data streams, using JSON as the data format. It adopts a plug-in architecture with high scalability, high availability, and reliable information forwarding. In use, you can send information from various sources to Fluentd first, and then Fluentd forwards the information to different destinations (such as files, SaaS platforms, databases, or even another Fluentd) through different plugins based on configuration.
Key Features
- Easy to install
- Small footprint
- Semi-structured data logging
- Flexible plugin mechanism
- Reliable buffering
- Log forwarding
Fluentd Components
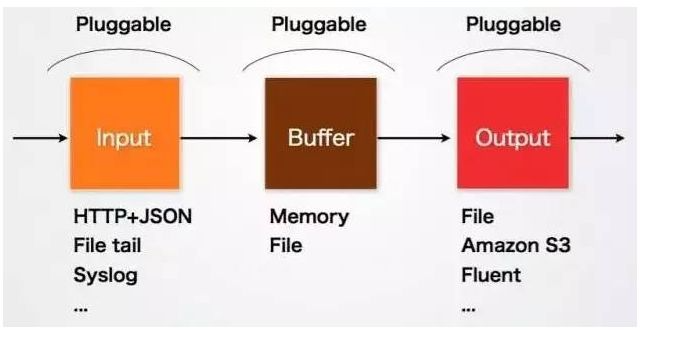
Fluentd's Input/Buffer/Output is very similar to Flume's Source/Channel/Sink.
- Input: Input is responsible for receiving data or actively fetching data. It supports syslog, HTTP, file tail, etc.
- Buffer: Buffer is responsible for the performance and reliability of data acquisition. Different types of buffers, such as file or memory, can be configured.
- Output: Output is responsible for outputting data to destinations such as files, AWS S3, or other Fluentd instances.
Filebeat
Filebeat is a lightweight log shipper implemented in Go and is part of the Elasticsearch stack. Essentially an agent, it can be installed on each node, read logs from the configured location, and report them to the appropriate destination.
Filebeat is highly reliable, ensuring at-least-once delivery of logs. It also addresses various issues in log collection, such as log resumption from breakpoints, file name changes, and log truncation.
Filebeat does not depend on Elasticsearch and can exist independently. You can use Filebeat alone for log shipping and collection. Filebeat has built-in common Output components, such as Kafka, Elasticsearch, and Redis. For debugging purposes, it can also output to console and file. You can use the existing Output components to ship logs. Of course, you can also customize Output components to have Filebeat forward logs to wherever you want.
Filebeat is actually part of elastic/beats, which also includes Heartbeat and Packetbeat. These beats are all implemented based on the libbeat framework.
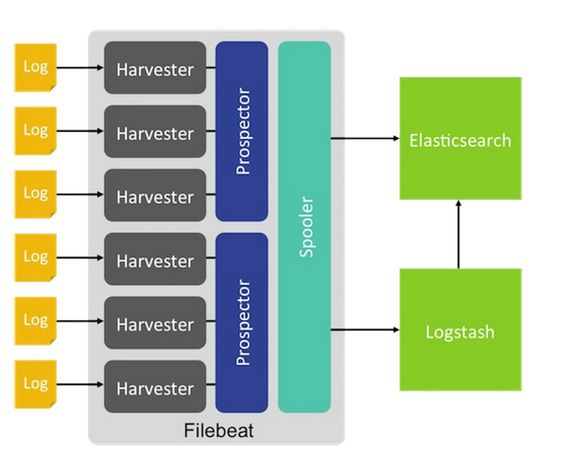
Filebeat Components
- Harvester: The main responsibility of the harvester is to read the content of a single file. It reads each file and sends the content to the output. A harvester is started for each file, and the harvester is responsible for opening and closing the file, meaning the file descriptor remains open during runtime. If the file is deleted or renamed while being read, Filebeat will continue reading the file.
- Prospector: The main responsibility of the prospector is to manage harvesters and find all file sources to read. If the input type is log, the prospector will find all files matching the path and start a harvester for each file. Each prospector runs in its own Go routine.
Note: Filebeat prospectors can only read local files. There is no functionality to connect to remote hosts to read stored files or logs. Because Filebeat's application scope is very limited, this document will not make extensive comparisons with Filebeat.
Guance
DataKit
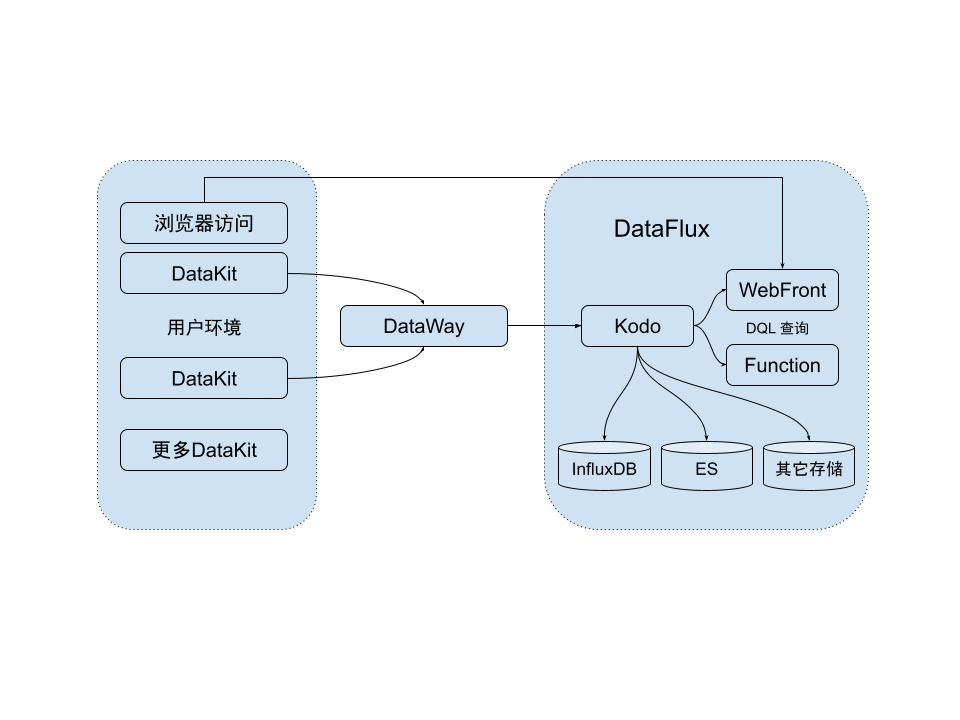
DataKit is a basic data collection tool running on the user's local machine. It is mainly used to collect various metrics, logs, and other data from system operations and aggregate them to Guance. In Guance, users can view and analyze their various metrics, logs, and other data. DataKit is a crucial data collection component in Guance. All data in Guance originates from DataKit.
- DataKit mainly collects various metrics through periodic collection, then sends the data to DataWay via HTTP(s) at regular intervals and in fixed quantities. Each DataKit is configured with a corresponding token to identify different users.
- After receiving the data, DataWay forwards it to Guance. The data sent to Guance includes an API signature.
- After receiving the valid data, Guance writes it to different storage systems based on the data type.
For collection-type data businesses, some data loss is generally acceptable (since the data is collected intermittently, the data during the intermittent period can be considered a form of data loss). The current data transmission chain provides the following loss protection:
- If DataKit fails to send data to DataWay due to network issues, DataKit will cache up to a maximum of one thousand data points. If the cached data exceeds this amount, the cache will be cleared.
- If DataWay fails to send data to Guance for some reason, or if the traffic is too high to send to Guance in time, DataWay will persist this data to disk. Later, when traffic decreases or the network recovers, this data will be sent to Guance. The delayed data does not affect timeliness, as the timestamps are attached to the cached data.
To protect the disk on DataWay, the maximum disk usage can also be configured to prevent filling up the storage of the node. DataWay will also discard data that exceeds the configured usage. However, this capacity is generally set to a relatively large value.
DataKit Components
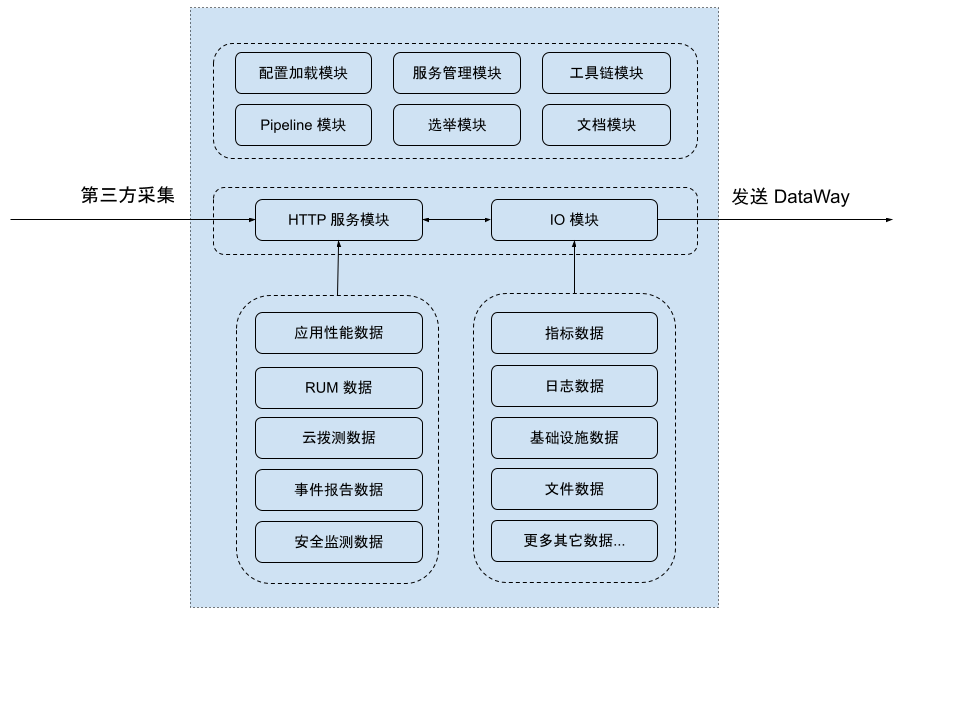
From top to bottom, DataKit's internal structure is mainly divided into three layers:
- Top Layer: Includes the program entry module and some common modules.
- Configuration Loading Module: Besides its own main configuration (i.e.,
conf.d/datakit.conf), the configurations for each collector are separate. If they were all together, the configuration file could become very large and difficult to edit. - Service Management Module: Mainly responsible for managing the entire DataKit service.
- Toolchain Module: As a client program, besides collecting data, DataKit provides many other peripheral functions, which are implemented in the toolchain module, such as viewing documentation, restarting services, updating, etc.
- Pipeline Module: In log processing, the Pipeline script (Grok syntax) is used to parse logs, transforming unstructured log data into structured data. It can also perform corresponding data processing on other non-log data.
- Election Module: When many DataKits are deployed, users can make all DataKit configurations identical and then deploy them to each DataKit through automated batch deployment. The significance of the election module is that in a cluster, certain data collection tasks (such as Kubernetes cluster metrics) should only be performed by one DataKit (otherwise, data would be duplicated and cause pressure on the collected party). When all DataKit configurations in the cluster are the same, the election module ensures that at any given time, only one DataKit performs the collection.
- Documentation Module: DataKit documentation is installed along with it. Users can access the document list on the http://localhost:9529/man page or browse documentation via the command line.
- Configuration Loading Module: Besides its own main configuration (i.e.,
- Transport Layer: Responsible for the input and output of almost all data.
- HTTP Service Module: DataKit supports third-party data ingestion, such as from Telegraf/Prometheus. More data sources can be added in the future. Currently, this data is ingested via HTTP.
- IO Module: After each collection cycle, each data collection plugin sends data to the IO module. The IO module encapsulates unified interfaces for data construction, processing, and sending, making it easy to integrate data collected by various collector plugins. Additionally, the IO module sends data to DataWay via HTTP(s) at a certain rhythm (regularly and in fixed quantities).
- Collection Layer: Responsible for collecting various data. Based on the collection type, it is divided into two categories:
- Active Collection: These collectors collect data at a configured fixed frequency, such as CPU, network traffic, and cloud synthetic tests.
- Passive Collection: These collectors typically collect data through external data input, such as RUM and Tracing. They generally run outside of DataKit and can use the data upload API provided by DataKit to standardize the data and then upload it to Guance.
Guance Platform
Based on its powerful data collection capabilities, "Guance" builds full-chain observability covering infrastructure, containers, middleware, databases, message queues, application traces, frontend access, system security, and network access performance. Based on Guance standard products, after users correctly configure DataKit collection, they can quickly build complete observability for their projects. At the same time, based on the Line Protocol and Guance scenario building capabilities, users can also customize and conveniently integrate the metrics they need to observe, achieving further observability.
"Guance" as a whole is a complete technical product for observability. It inherently has many technical thresholds. Compared to various open-source solutions, Guance has emphasized from the very beginning how to effectively reduce the user's learning cost for using the product and improve user-friendliness. Therefore, from the installation and deployment of DataKit to all its configurable capabilities, "Guance" strives to minimize the difficulty of configuration, conforming to the habits of most programmers and operations engineers, while improving the overall usability and professionalism of the UI, allowing users to quickly understand the product's features and value.
Platform Comparison
One of the original advantages of Logstash is that it is written in JRuby, so it can run on Windows.
Fluentd only recently supported Windows because it no longer depends on Linux-centric event libraries. Fluentd now supports Windows. You can also use the in_windows_eventlog plugin to track Windows event logs.
DataKit is the data collector officially provided by the Guance product. It comes with built-in scripts for multiple data source collection, supports multiple data ingestion methods, and supports Windows, Linux, and Mac operating systems, as well as ARM and X86 architectures. For log collection, it achieves full platform compatibility.
Logstash
Linux and Windows
Fluentd
Linux and Windows
DataKit
Full platform support, and supports client-side visual management of configurations, significantly reducing the learning cost of installation, deployment, and complex configurations.
Event Routing Comparison
For event routing configuration, Fluentd's approach is more declarative, while Logstash's approach is procedural. Therefore, developers trained in procedural programming might find Logstash's configuration easier to get started with. Additionally, Fluentd's tag-based routing allows for clear expression of complex routing. However, Guance, based on its mature product logic and powerful product components, can achieve an observability closed loop without relying on other products for event alerting or data browsing. This ensures data security and avoids complex configurations, providing an excellent user experience.
Logstash Event Routing
Logstash routes all data into a single stream and then uses if-then statements to send them to the desired destination. Below is an example of sending error events from production to PagerDuty:
Fluentd Event Routing
Fluentd relies on tags to route events. Each Fluentd event has a tag that tells Fluentd where to route it. If you want to send error events to PagerDuty in production, the configuration would be as follows:
<source>
  @type forward
</source>

<filter app.**>
  @type record_transformer
  <record>
    hostname "#{Socket.gethostname}"
  </record>
</filter>

<match app.**>
  @type file
  # ...
</match>
DataKit Proxy
As part of the powerful product components of Guance, DataKit directly reports data to the cloud-based Guance platform for observability analysis. There is no need to provide event routing to transmit data to other tools for analysis, caching, etc., as is required with Logstash and Fluentd. Of course, to ensure user data security and to handle scenarios where DataKit is deployed in an internal network environment without internet access and needs to use a proxy server to access the internet, DataKit's proxy configuration is very simple—just enable the proxy option. With simple configuration, users can experience rich product functionality.
Plugin Ecosystem Comparison
Logstash, Fluentd, and DataKit all have rich plugin ecosystems, covering many input systems (such as files and TCP/UDP) and filters (for splitting and filtering by fields).
Logstash Plugins
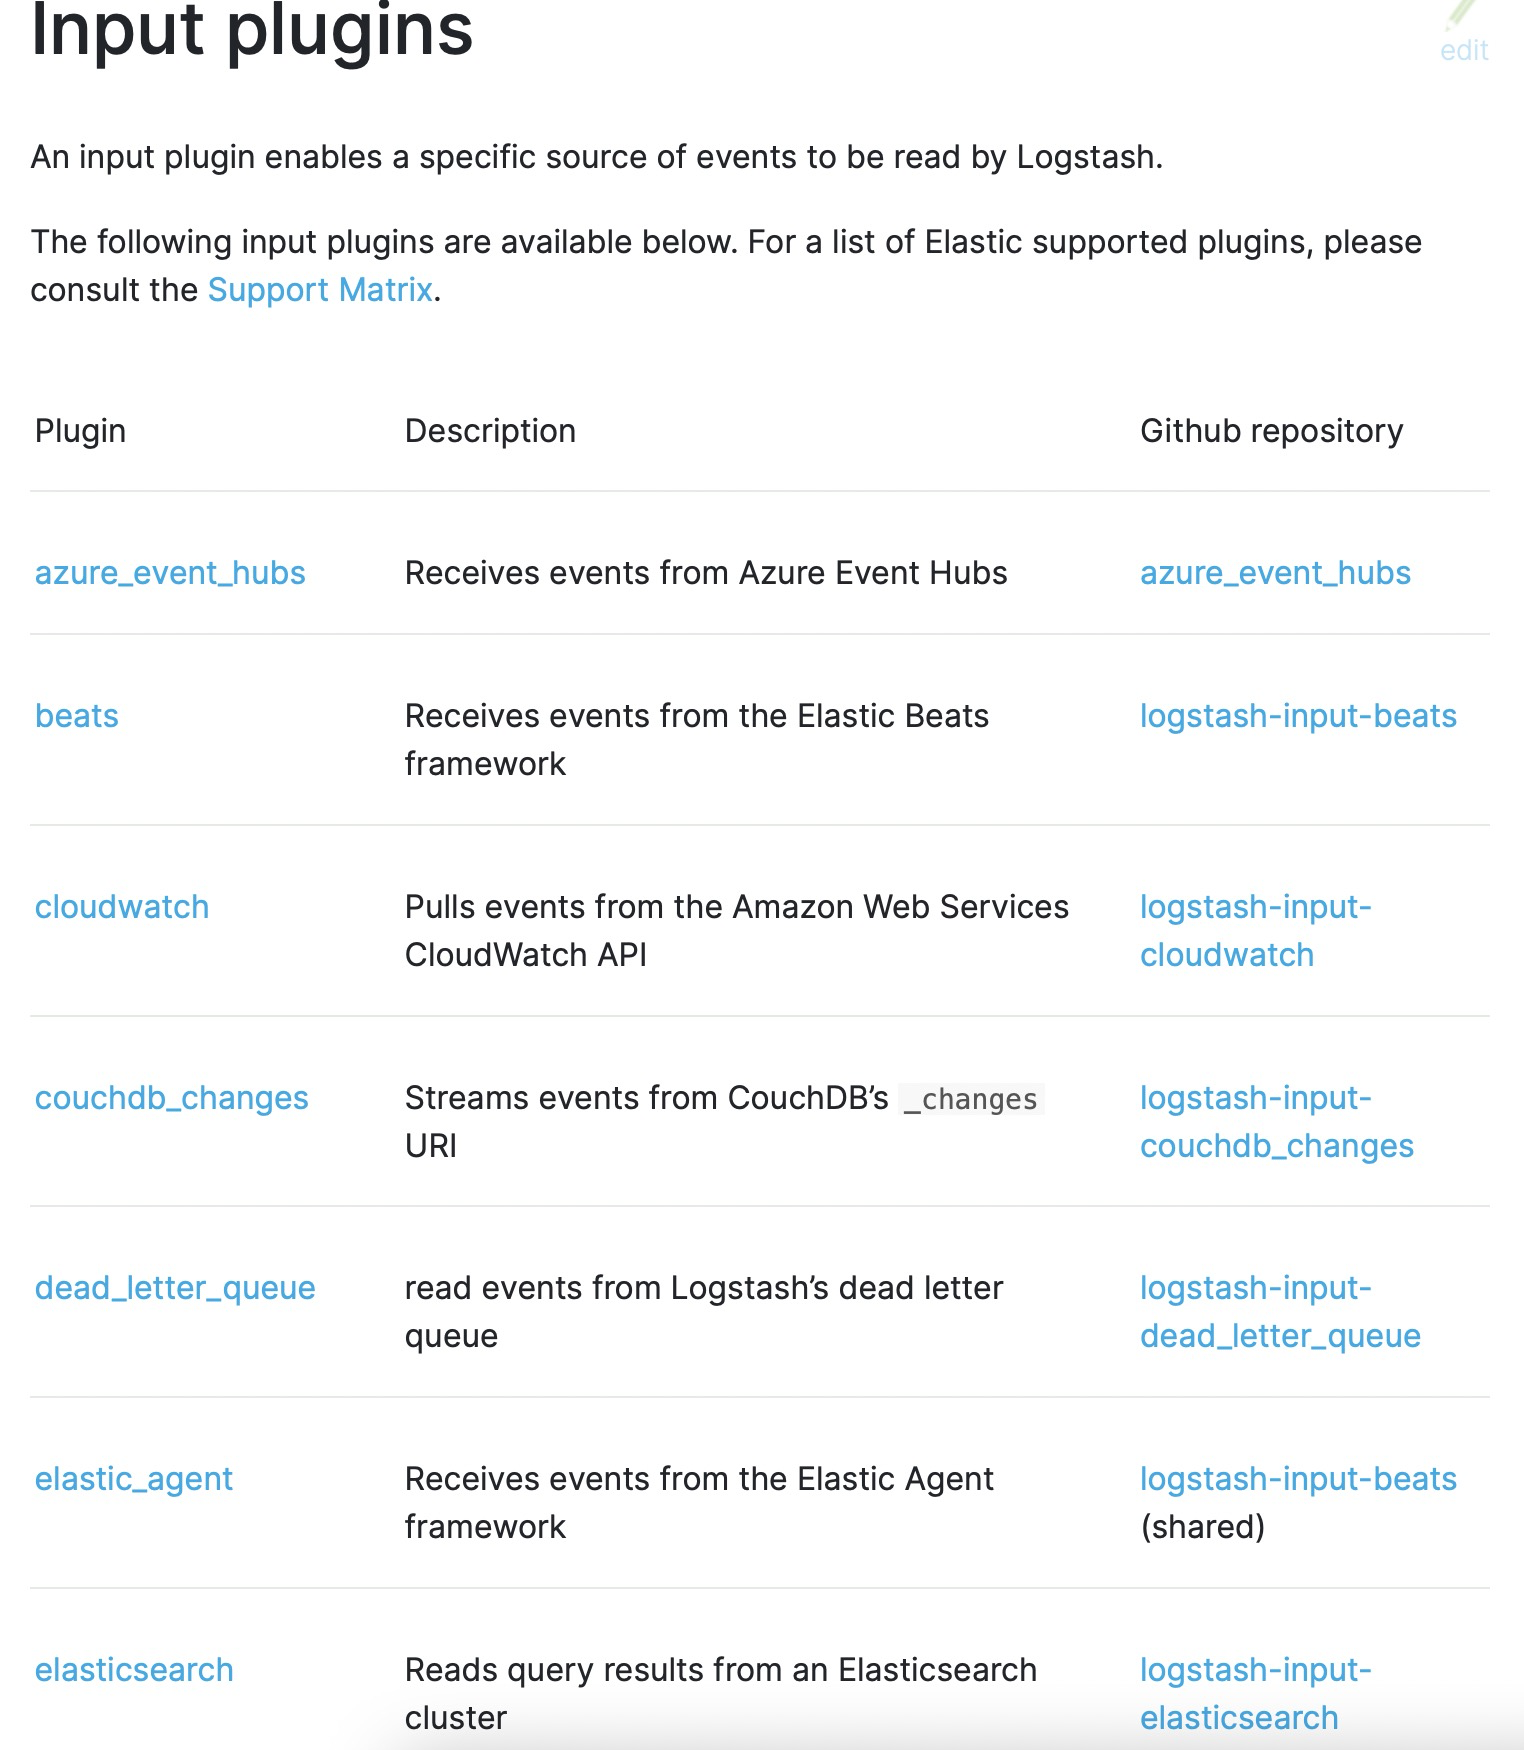
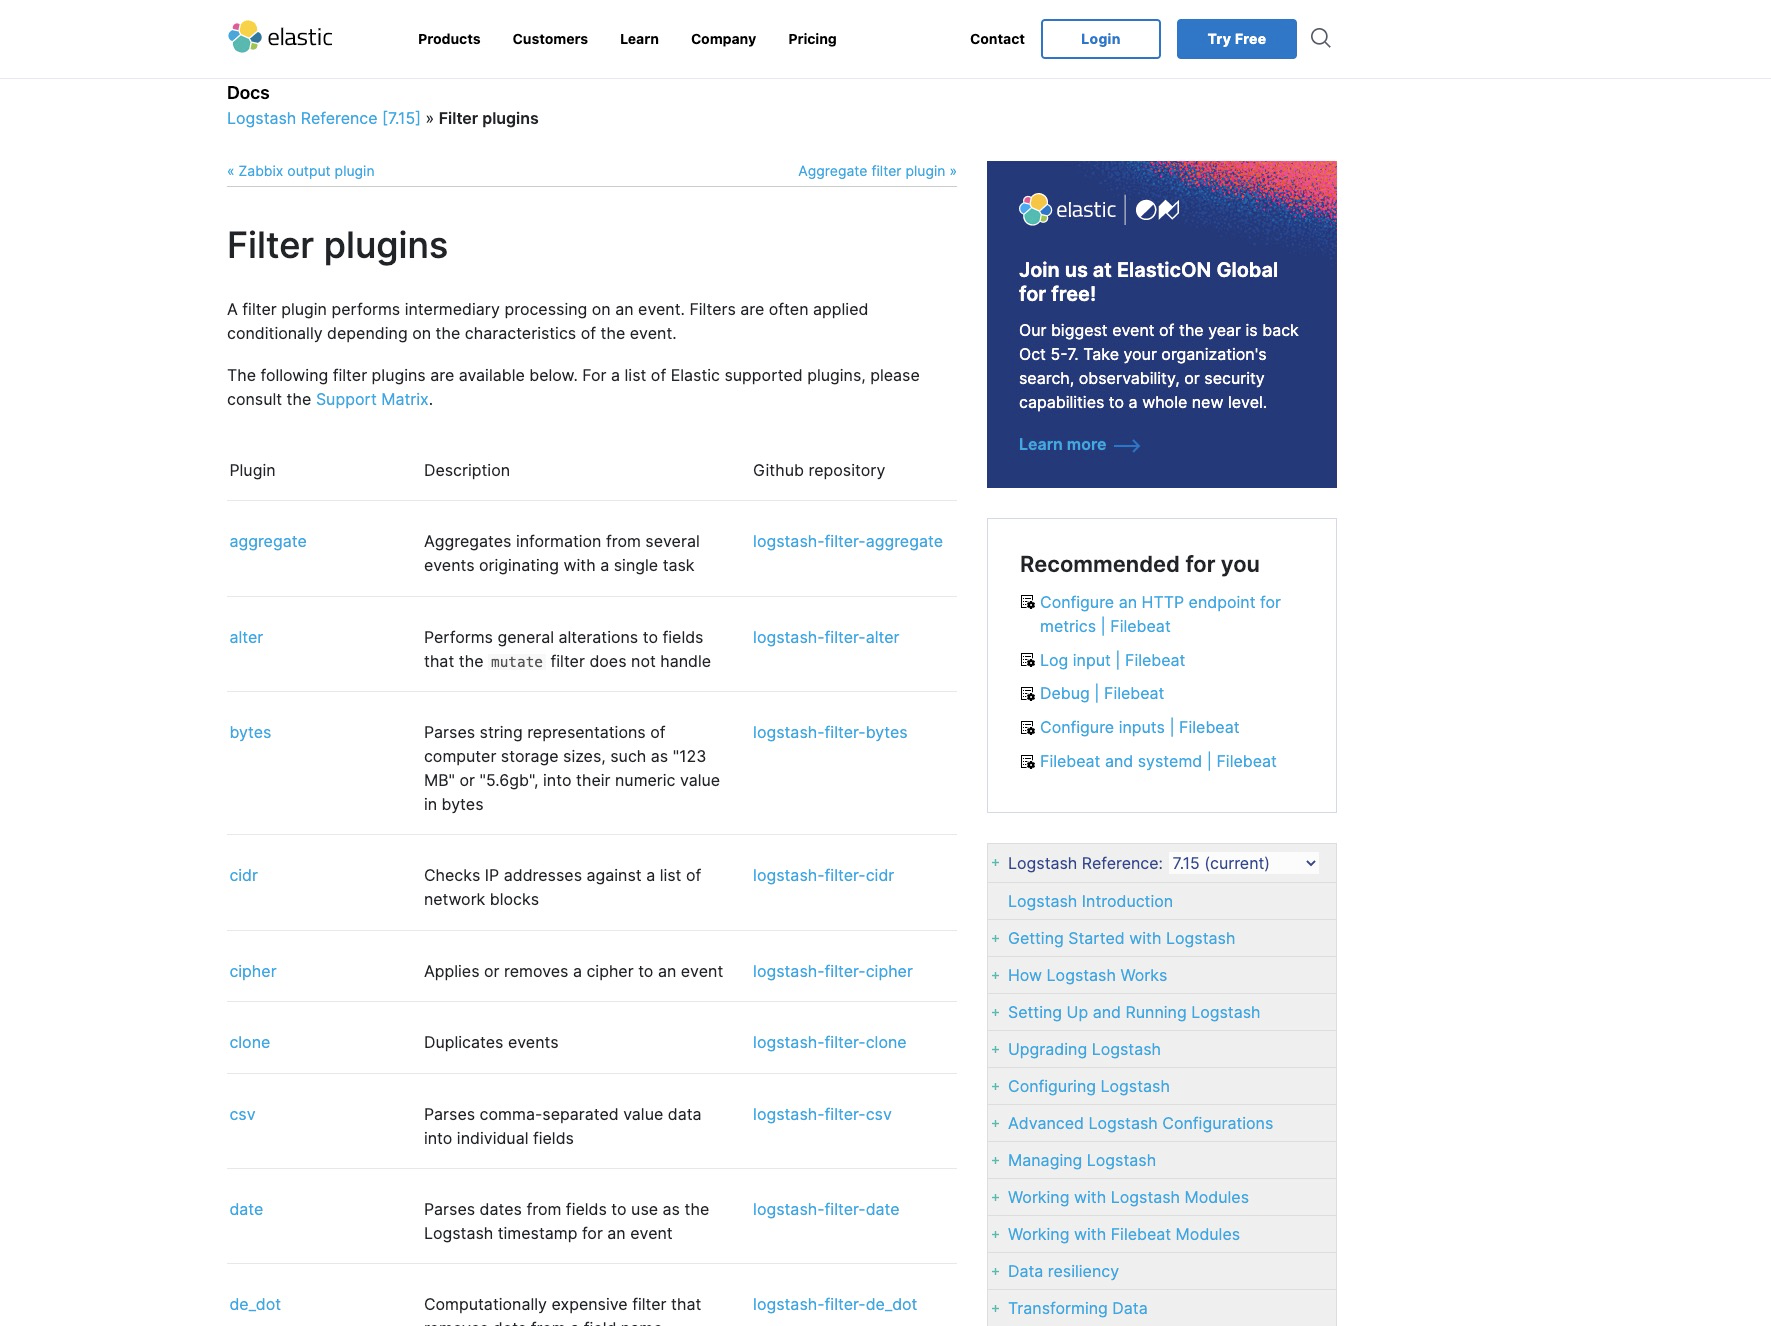
Logstash manages all its plugins under its GitHub repo. There are over 200 input, filter, and output plugins in total, maintained by the community and lacking official maintenance and hosting.
Fluentd Plugins
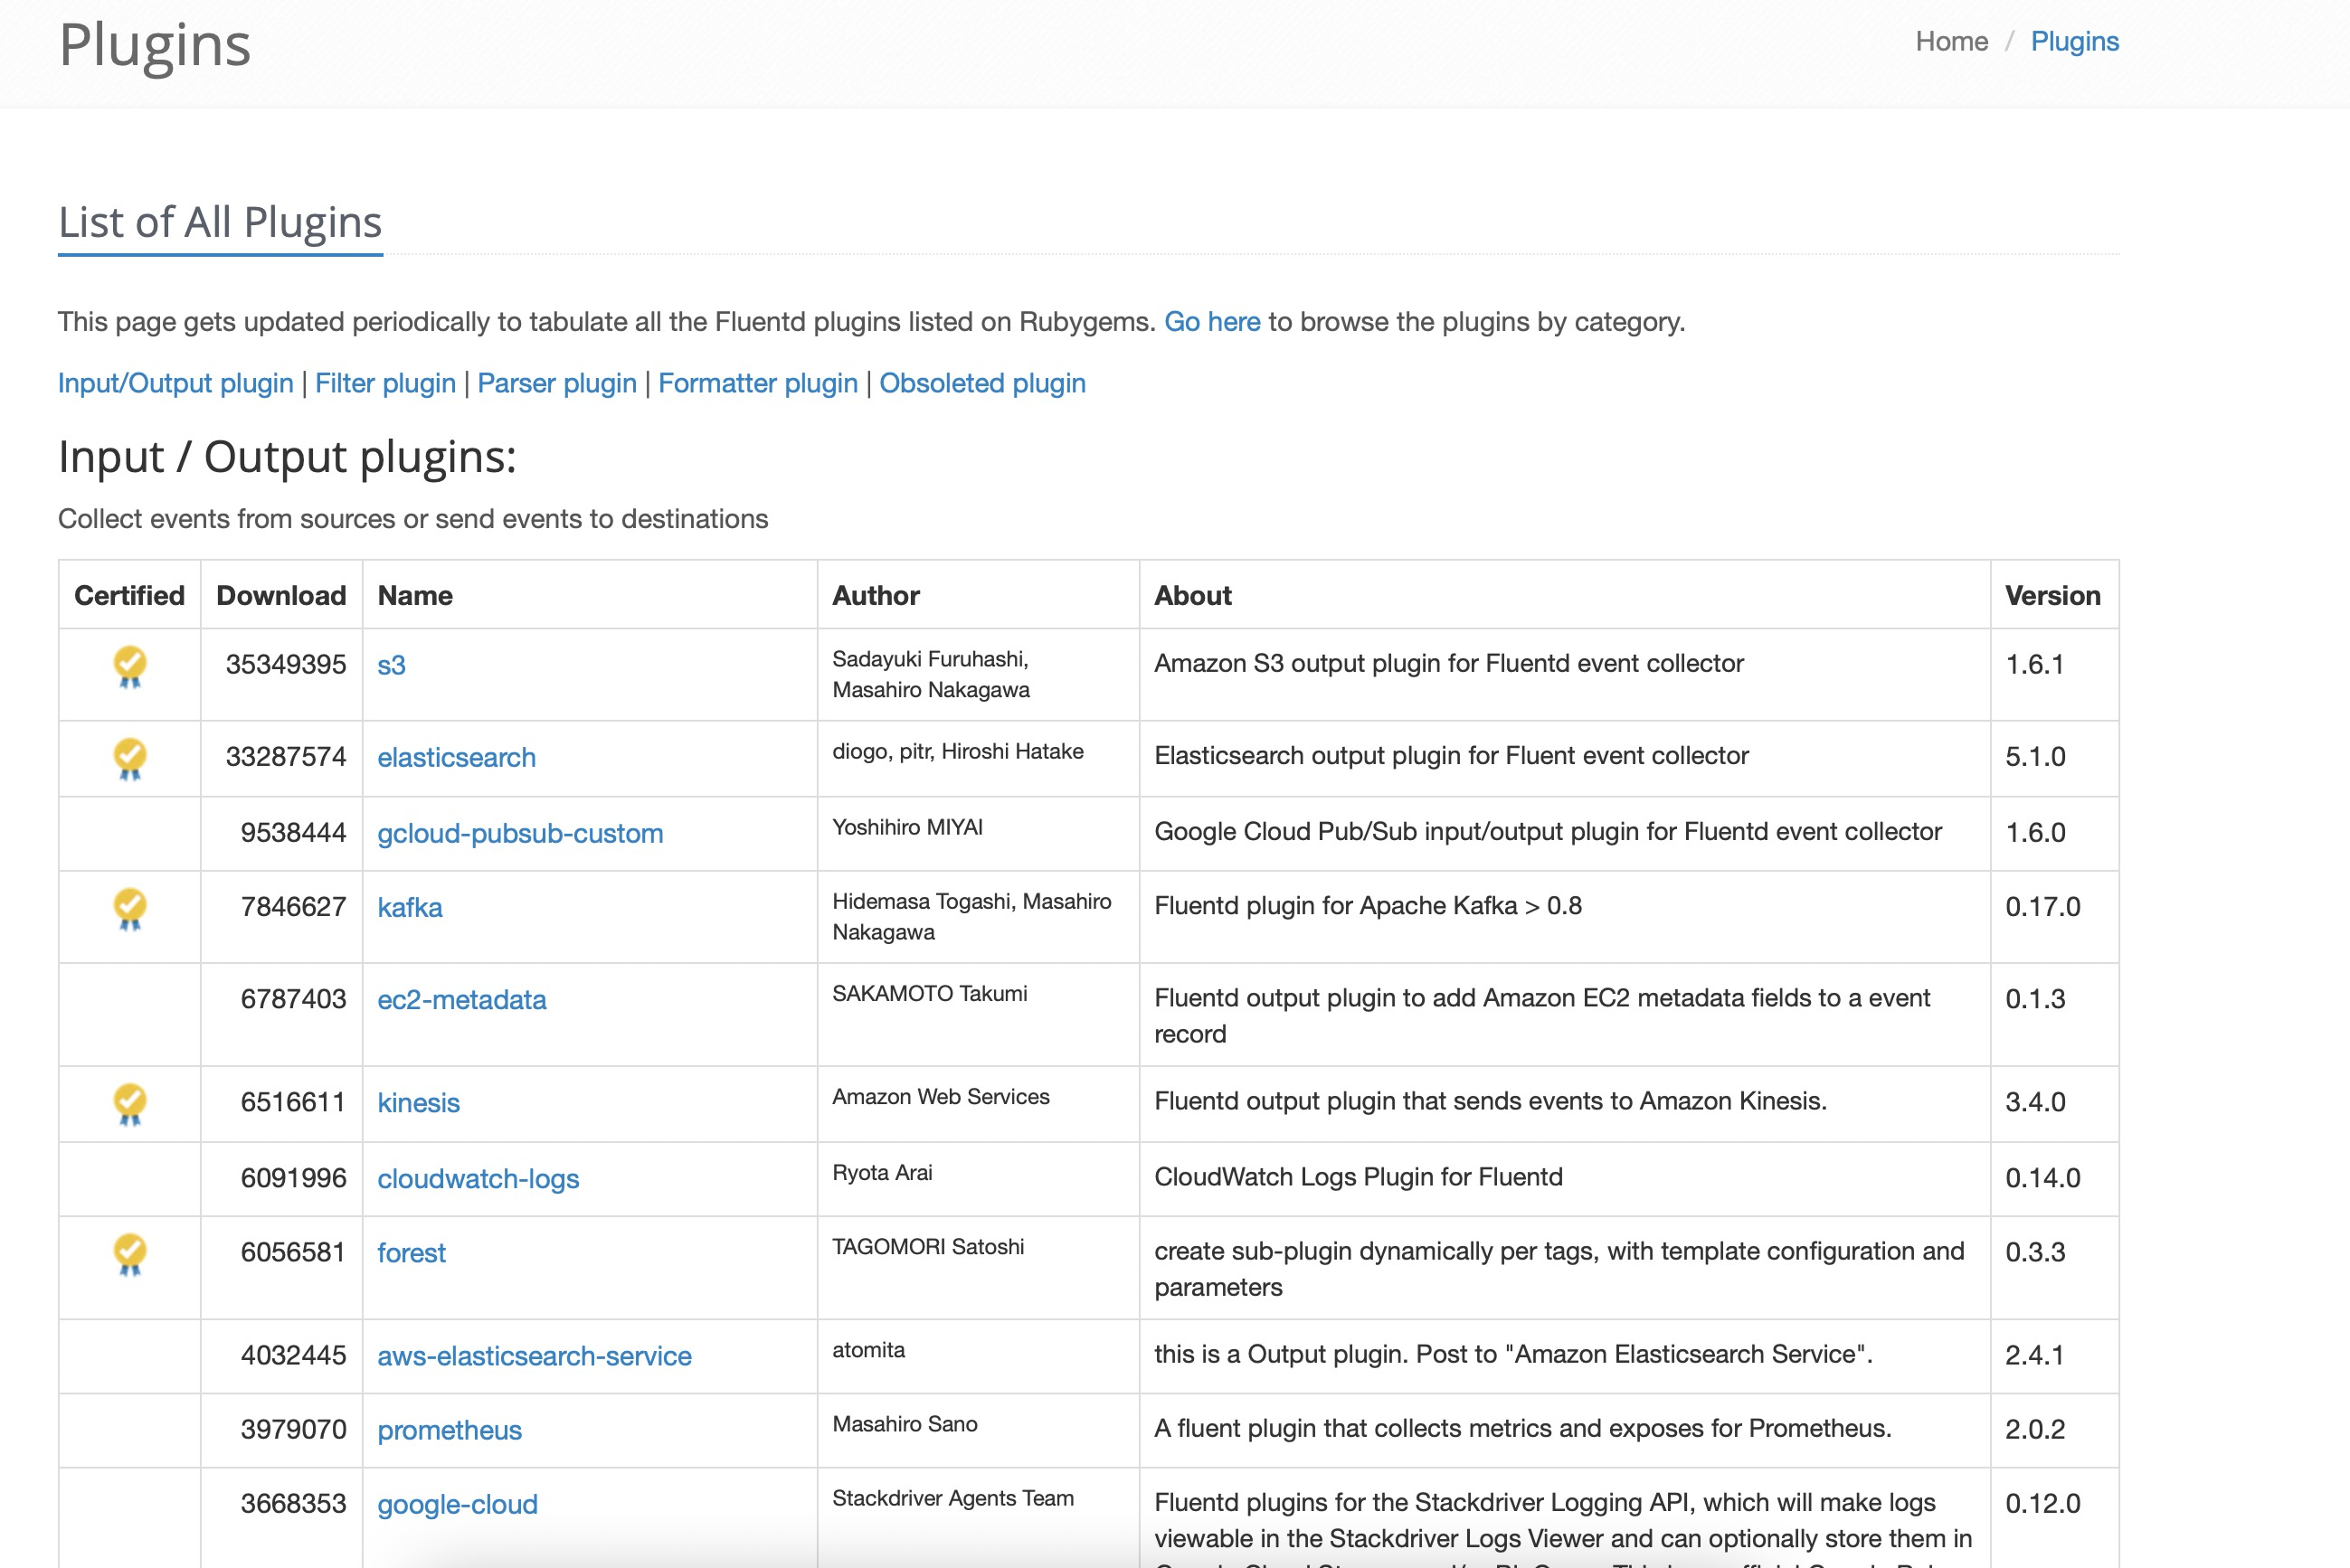
Fluentd includes 8 types of plugins—input, parser, filter, output, formatter, storage, service discovery, and buffer—totaling over 500 plugins. However, only 10 of these plugins are officially hosted; the rest are maintained by the community, lacking official maintenance, hosting, and technology stack support.
DataKit Plugins
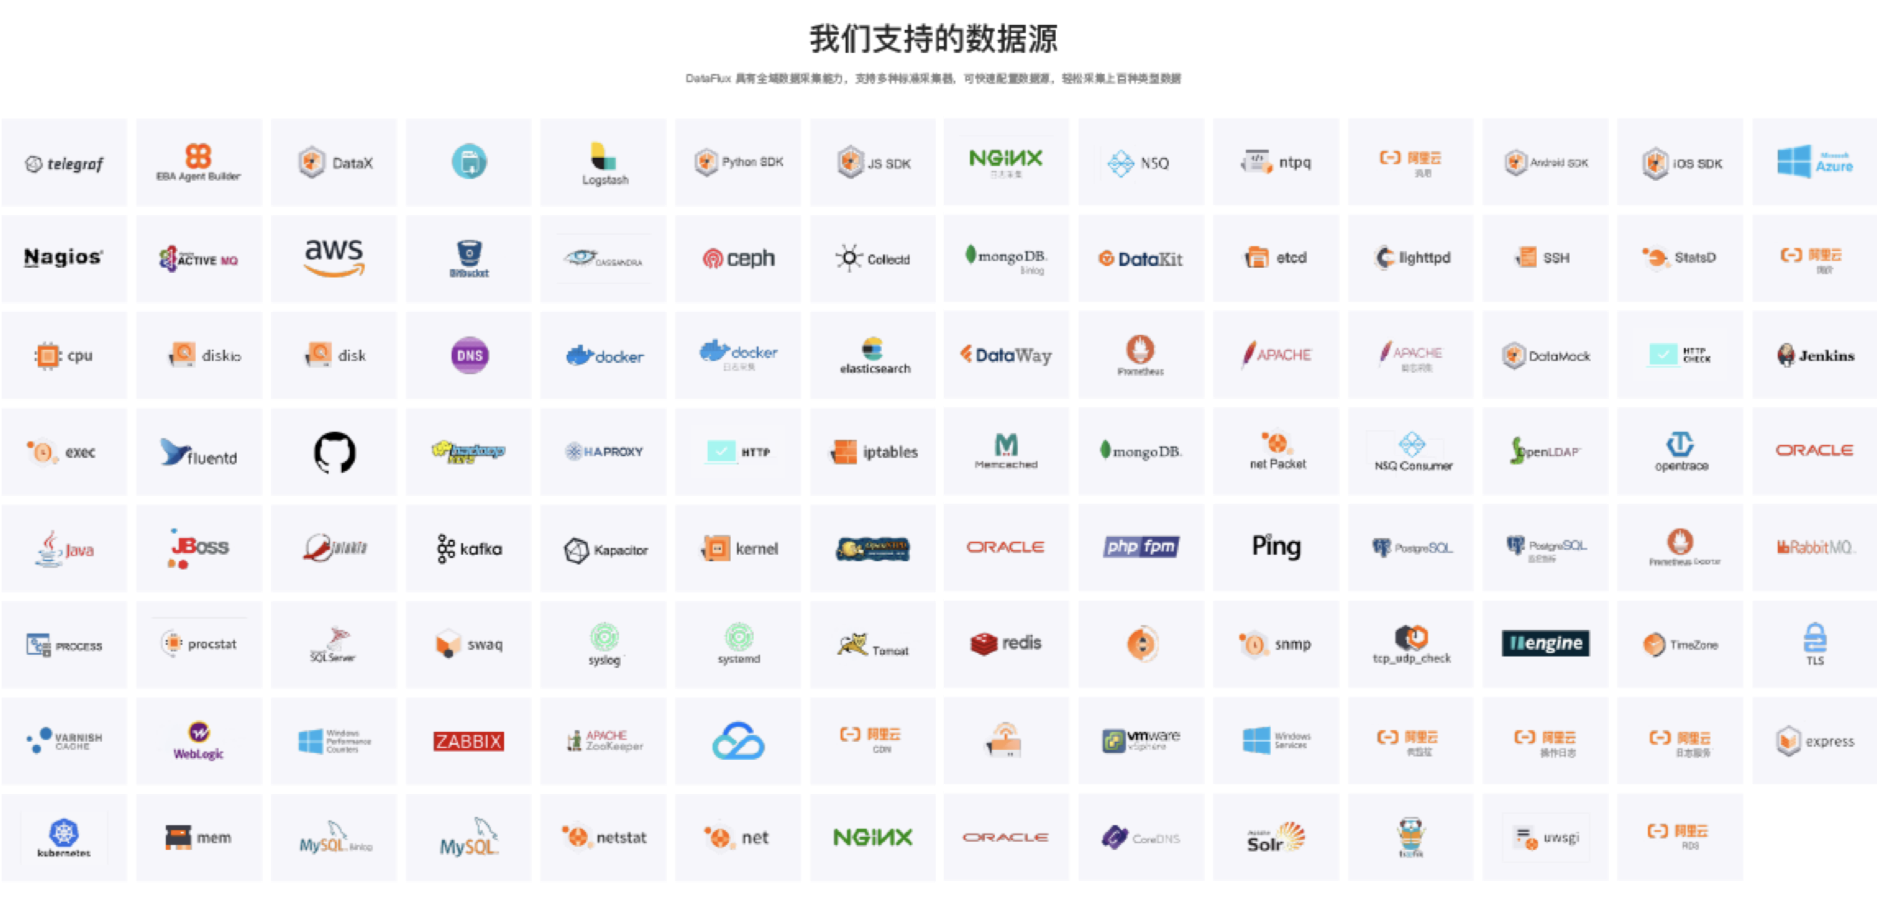
DataKit includes powerful built-in features—dynamic Grok syntax query debugging, fast data querying based on the proprietary DQL syntax, real-time input collection monitoring, edge computing capabilities, and visual client-based configuration and deployment of collection sources. It also supports over 200 officially maintained data source integrations and technology stack support, and is compatible with external data ingestion from Telegraf, Beats, Logstash, Fluentd, and more. User-friendly features include visual client management of plugins and agents, and real-time viewing of data collection status.
Queue Comparison
Logstash lacks a persistent internal message queue. Currently, Logstash has an in-memory queue that can hold 20 events (fixed size) and relies on external queues like Redis for persistence across restarts. Fluentd has a configurable buffering system that can be in-memory or on disk, but configuring its reliability can be complex. DataKit has a built-in caching mechanism that can achieve data caching by simply changing a few parameters based on the server configuration.
Logstash Queue
Due to Logstash's lack of a built-in persistent message queue, its built-in queue model is very simple and requires external queues like Redis to ensure persistence.
Fluentd Queue
Compared to Logstash, Fluentd has built-in reliability, but the configuration is more complex, leading to a higher learning cost for users.
DataKit Queue
DataKit has a built-in caching mechanism. When the server where DataKit is deployed fails to send data to DataWay due to network issues, DataKit will cache up to a maximum of one thousand data points by default to prevent data loss. The maximum cache size can also be controlled by modifying the DataKit configuration file. The configuration is simple and has a very low usage threshold, almost zero learning cost.
Log Parsing Comparison
Log analysis is a fundamental core technology in enterprises, used not only by security teams but also by IT R&D teams and business teams. From a security perspective, extracting logs for analysis is mainly to discover unknown security events and perform forensic analysis of known security events. Another important purpose is to meet regulatory compliance requirements at the national level. From an IT R&D perspective, non-security technical teams within the enterprise perform log analysis mainly to locate unknown issues and analyze known issues, focusing on system monitoring and APM (APM covers all monitoring items of concern to R&D teams). From a business perspective, business teams' requirements for log analysis are more focused on risk control, operational marketing, user profiling, and website profiling. Therefore, logs lying dormant on hard drives are worthless. Log analysis technology can realize the value of log information. The higher the degree of log value realization, the better it reflects the company's technical strength.
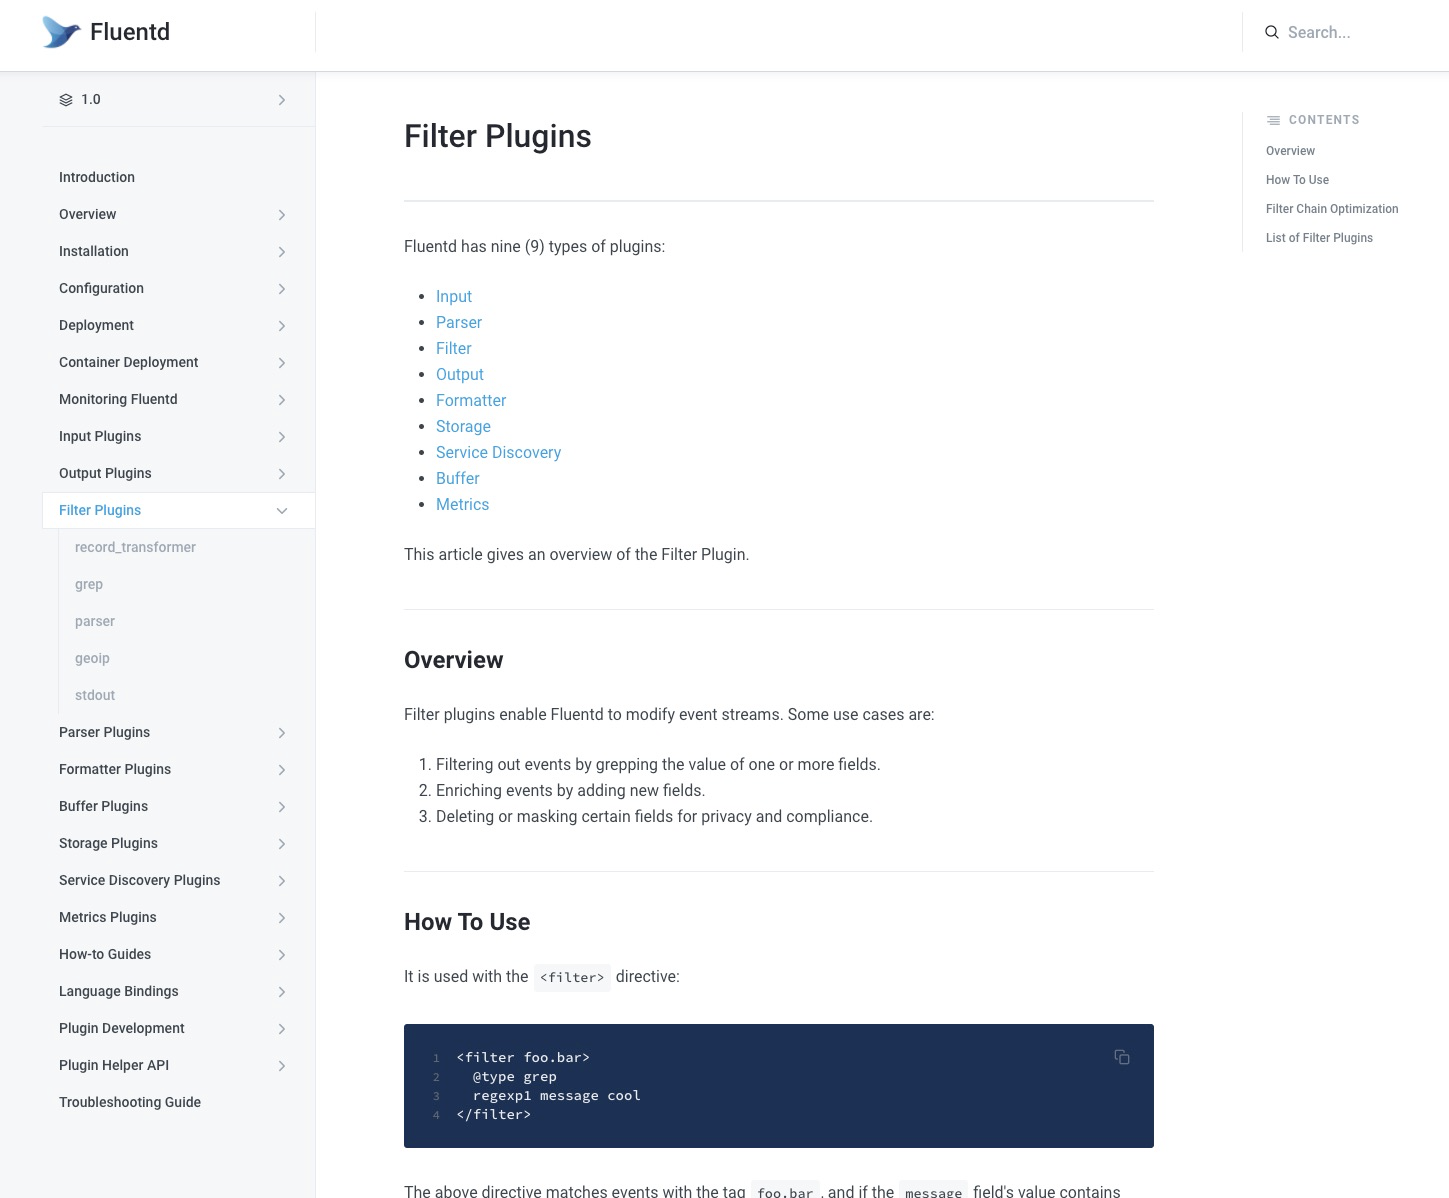
Commonly used Logstash includes Grok for parsing and constructing arbitrary text, mutate for performing regular transformations on event fields, drop for completely deleting events, clone for making copies of events, and geoip for adding geographical location information about IP addresses. Common Fluentd log parsing operations include filtering events by searching for values in one or more fields, enriching events by adding new fields, and deleting or masking certain fields for privacy and compliance. Fluentd has relatively fewer plugins, only five: record_transformer, filter_stdout, filter_grep, parser, and filter_geoip. DataKit log parsing includes Pipeline for parsing unstructured text data or extracting information from structured text (such as JSON), using glob rules to specify log files more conveniently, automatic discovery and file filtering, an easy-to-use interactive Grok matching tool to lower the barrier to using Grok, and support for a large number of script functions to make data formats more flexible.
Logstash Log Parsing
Grok is currently the best way in Logstash to parse unstructured log data into structured and queryable content. Logstash currently has 120 built-in Grok parsing templates. However, the Grok parsing templates managed by Logstash under its GitHub repo are maintained by the community, lacking official technical support. Users must explore Grok template performance tuning and many other business needs on their own.
Fluentd Log Parsing
Fluentd's log parsing approach is similar to Logstash, but the configuration is more flexible. However, it does not provide corresponding Grok parsing templates, only some configuration examples. Users still need to configure parsing functions based on documentation examples, which has a relatively high barrier to entry. For issues encountered during configuration, there is a lack of corresponding technical support, and users may need to rely on Google searches to resolve them.
In a sample server environment, using the Nginx access log as an example, one log entry of 365 bytes is structured into 14 fields:
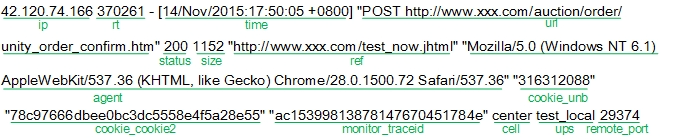
In the following tests, different loads will be simulated by repeatedly writing this log to a file. The time field of each log entry takes the current system time, while the other 13 fields remain the same.
Compared to real-world scenarios, there is no difference in log parsing in the simulation. One difference is that a higher data compression rate reduces network write traffic.
Logstash
Logstash version 7.1.0, using Grok to parse logs and writing to Kafka (built-in plugin, with gzip compression enabled).
Log parsing configuration:
grok {
patterns_dir=> "/home/admin/workspace/survey/logstash/patterns"

match=>{ "message"=>"%{IPORHOST:ip} %{USERNAME:rt} -
\"%{WORD:method} %{DATA:url}\" %{NUMBER:status} %{NUMBER:size} \"%{DATA:ref}\" \"%{DATA:agent}\" \"%{DATA:cookie_unb}\" \"%{DATA:cookie_cookie2}\" \"%{DATA:monitor_traceid}\" %{WORD:cell} %{WORD:ups} %{BASE10NUM:remote_port}" }

remove_field=>[ "message"]
}
| Write TPS | Write Throughput (KB/s) | CPU Usage (%) | Memory Usage (MB) |
|---|---|---|---|
| 500 | 178.89 | 25.3 | 432 |
| 1000 | 346.65 | 46.9 | 476 |
| 5000 | 1882.23 | 231.1 | 489 |
| 10000 | 3564.45 | 511.2 | 512 |
Fluentd
td-agent version 4.1.0, using regular expressions to parse logs and write to Kafka (third-party plugin fluent-plugin-kafka, with gzip compression enabled).
Log parsing configuration:
<source>
type tail
format /^(? <ip>\S+)\s(?<rt>\d+)\s-\s\[(?<time>[^\]]*)\]\s"(?<url>[^\"]+)"\s(?<status>\d+)\s(?<size>\d+)\s"(?<ref>[^\"]+)"\s"(?<agent>[^\"]+)"\s"(?<cookie_unb>\d+)"\s"(?<cookie_cookie2>\w+)"\s"(?
<monitor_traceid>\w+)"\s(?<cell>\w+)\s(?<ups>\w+)\s(?<remote_port>\d+).*$/
time_format %d/%b/%Y:%H:%M:%S %z
path /home/admin/workspace/temp/mock_log/access.log
pos_file /home/admin/workspace/temp/mock_log/nginx_access.pos
tag nginx.access
</source>
| Write TPS | Write Throughput (KB/s) | CPU Usage (%) | Memory Usage (MB) |
|---|---|---|---|
| 500 | 174.272 | 13.8 | 58 |
| 1000 | 336.85 | 24.4 | 61 |
| 5000 | 1771.43 | 95.3 | 103 |
| 10000 | 3522.45 | 140.2 | 140 |
DataKit
DataKit-1.1.8-rc3, using Pipeline to parse unstructured text data.
# access log
grok(_, "%{NOTSPACE:ip} %{NOTSPACE:rt} - "%{NOTSPACE:method} %{NOTSPACE:url}\" %{NOTSPACE:status} %{NOTSPACE:size} \"%{NOTSPACE:ref}\" \"%{NOTSPACE:agent}\" \"%{NOTSPACE:cookie_unb}\" \"%{NOTSPACE:cookie_cookie2}\" \"%{NOTSPACE:monitor_traceid}\" %{NOTSPACE:cell} %{NOTSPACE:ups} %{NOTSPACE:remote_port}")

cast(status_code, "int")
cast(bytes, "int")

default_time(time)
| Write TPS | Write Throughput (KB/s) | CPU Usage (%) | Memory Usage (MB) |
|---|---|---|---|
| 500 | 178.24 | 8.5 | 41 |
| 1000 | 356.45 | 13.8 | 45 |
| 5000 | 1782.23 | 71.1 | 76 |
| 10000 | 3522.45 | 101.2 | 88 |
Log Collection Architecture Comparison
ELK Architecture
Architecture 1
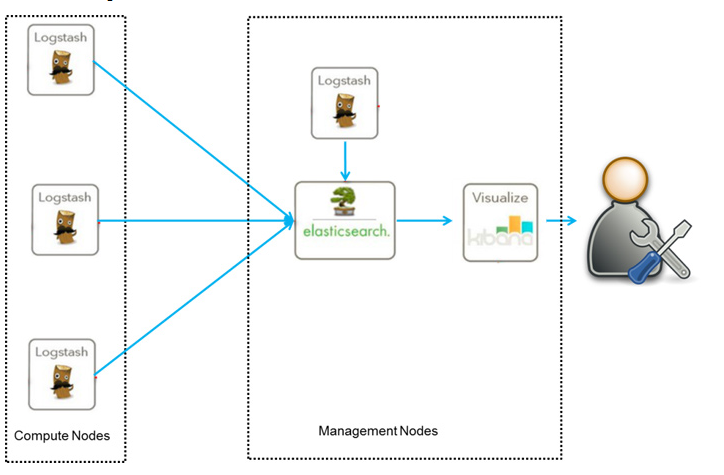
This is the simplest ELK architecture. The advantage is that it is easy to set up and get started. The disadvantage is that Logstash consumes significant resources, using high CPU and memory. There is also no message queue cache, posing a risk of data loss. Users need to be proficient enough in Logstash, Elasticsearch, and Kibana to use them skillfully and solve various complex business problems. Additionally, the maintainers of the Logstash cluster and Elasticsearch cluster must be sufficiently proficient in cluster performance optimization and resource management to ensure the business runs normally.
In this architecture, Logstash is deployed on each node to collect logs and data, analyze and filter them, and then send them to Elasticsearch on a remote server for storage. Elasticsearch stores the data in shards (compressed) and provides various APIs for user querying and operation. Users can also more intuitively query logs and generate reports from data by configuring the Kibana web interface.
Architecture 2
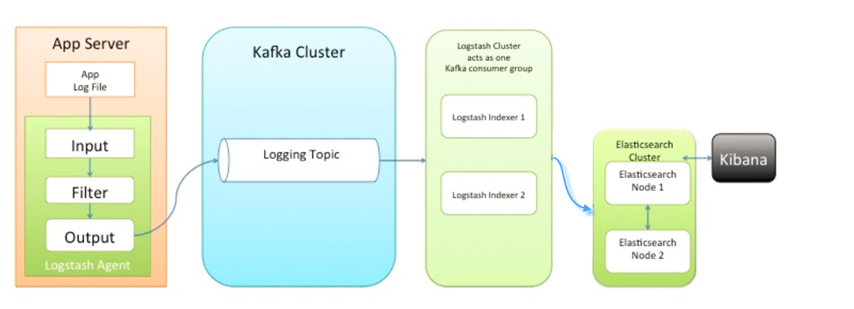
This is a relatively mature ELK architecture. The advantage is the introduction of Kafka. Even if the remote Logstash cluster stops running due to a failure, data will be stored first, thus avoiding data loss. The disadvantage is that the setup is complex, the technology stack is complex and relatively difficult to learn quickly, and Logstash consumes significant resources, using high CPU and memory. An additional Kafka cluster needs to be maintained, and in large-scale scenarios, an additional Zookeeper cluster may be needed. Users need to be proficient enough in Logstash, Elasticsearch, Kafka, and Kibana to use them skillfully and solve various complex business problems. The maintainers of the Logstash, Kafka, and Elasticsearch clusters must also be sufficiently proficient in cluster performance optimization and resource management to ensure normal business operations.
This architecture introduces a message queue mechanism. The Logstash agent on each node first passes data/logs to Kafka (or Redis), which then indirectly passes the messages or data in the queue to Logstash. Logstash filters and analyzes the data and then passes it to Elasticsearch for storage. Finally, Kibana presents the logs and data to the user. Because Kafka (or Redis) is introduced, even if the remote Logstash server stops running due to a failure, the data will be stored first, thus avoiding data loss.
EFK Architecture
Architecture 1
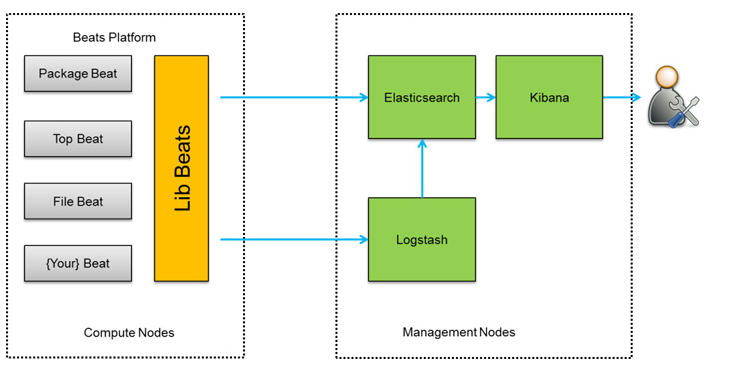
This is a more flexible EFK architecture. The advantages are greater flexibility, lower resource consumption compared to Logstash, and stronger scalability. The disadvantage is that sending logs to a Logstash cluster for centralized processing requires a large Logstash cluster to provide computing power. Users need to be proficient enough in Logstash, Elasticsearch, and Kibana to use them skillfully and solve various complex business problems. The maintainers of the Logstash and Elasticsearch clusters must also be sufficiently proficient in cluster performance optimization and resource management to ensure normal business operations.
This architecture replaces the Logstash collector with Filebeat, and Logstash and Elasticsearch clusters can be configured to support log data monitoring and querying for large cluster systems.
Architecture 2
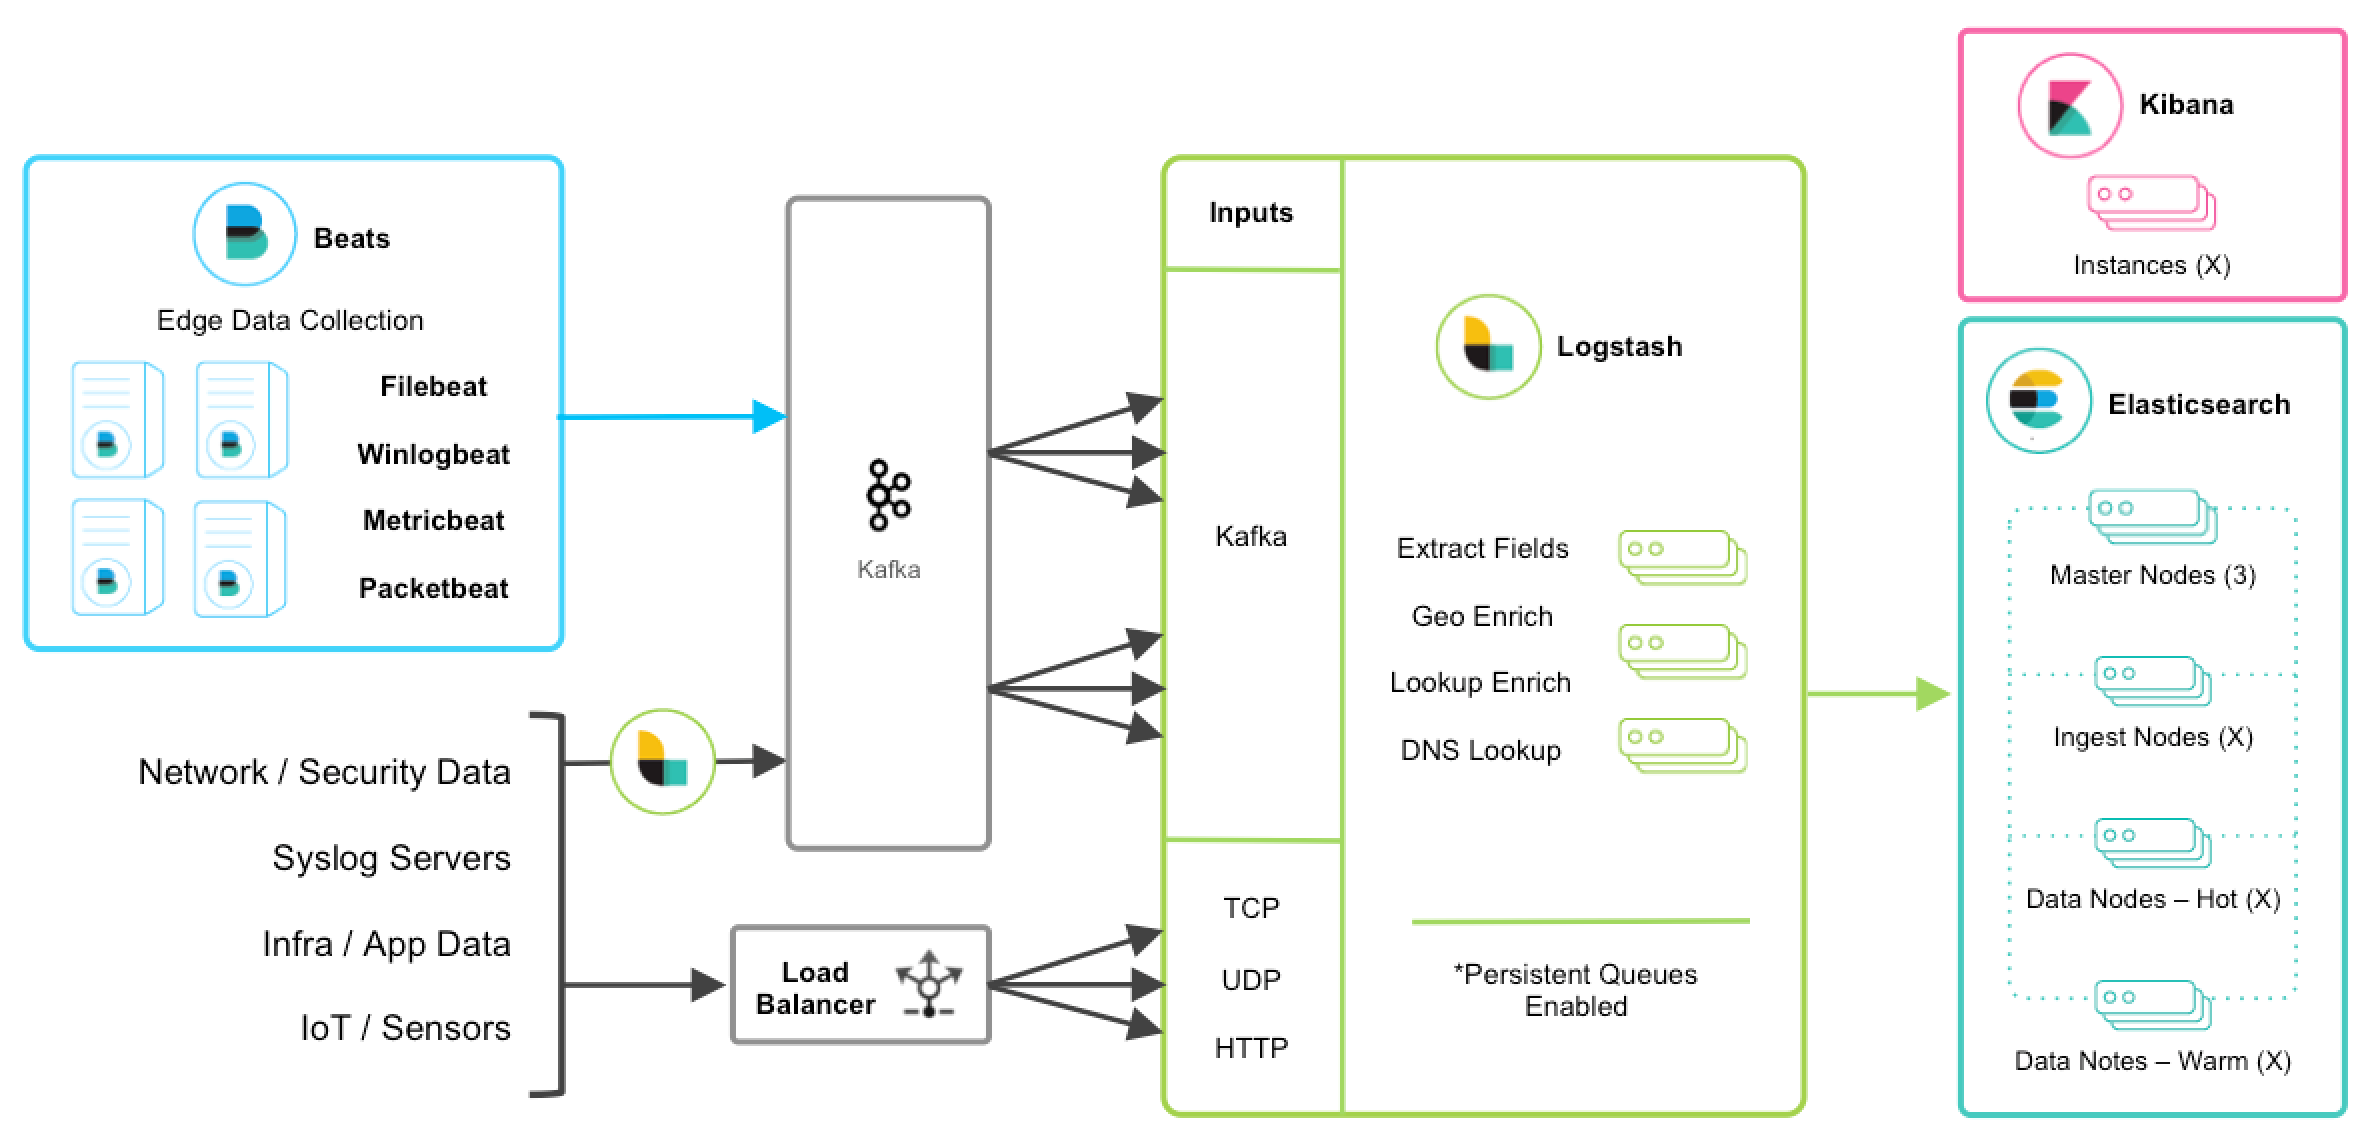
Based on ELK, this architecture uses Filebeat as the log collection agent. The advantage is that if Logstash were used as the log collection agent as in the ELK architecture, every server would need a Java environment because Logstash is based on Java. Filebeat, on the other hand, requires no dependencies; you can install it, modify the configuration file, and start the service. The disadvantage is that the technology stack is complex and relatively difficult to learn quickly. Logstash consumes significant resources, using high CPU and memory. An additional Kafka cluster needs to be maintained, and in large-scale scenarios, an additional Zookeeper cluster may be needed. Users need to be proficient enough in Filebeat, Logstash, Elasticsearch, Kafka, and Kibana to use them skillfully and solve various complex business problems. The maintainers of the Logstash, Kafka, and Elasticsearch clusters must also be sufficiently proficient in cluster performance optimization and resource management to ensure normal business operations.
In this architecture, when the collector collects log files, you need to define a field in the Filebeat input, such as log_topic, to classify log files from specified paths into one category. In the Output, you specify the output to Kafka. Kafka acts as a message queue, receiving all logs collected from Filebeat clients. It then classifies and forwards different types of logs (e.g., nginx, php, system). In Kafka, you create different topics based on the log types defined in the input. Logstash receives messages from the Kafka message queue, and based on the different Kafka topics, it writes the logs to Elasticsearch. Kibana matches the indices in Elasticsearch, allowing for log analysis, search, and chart display (though you need to design the charts yourself).
Architecture 3
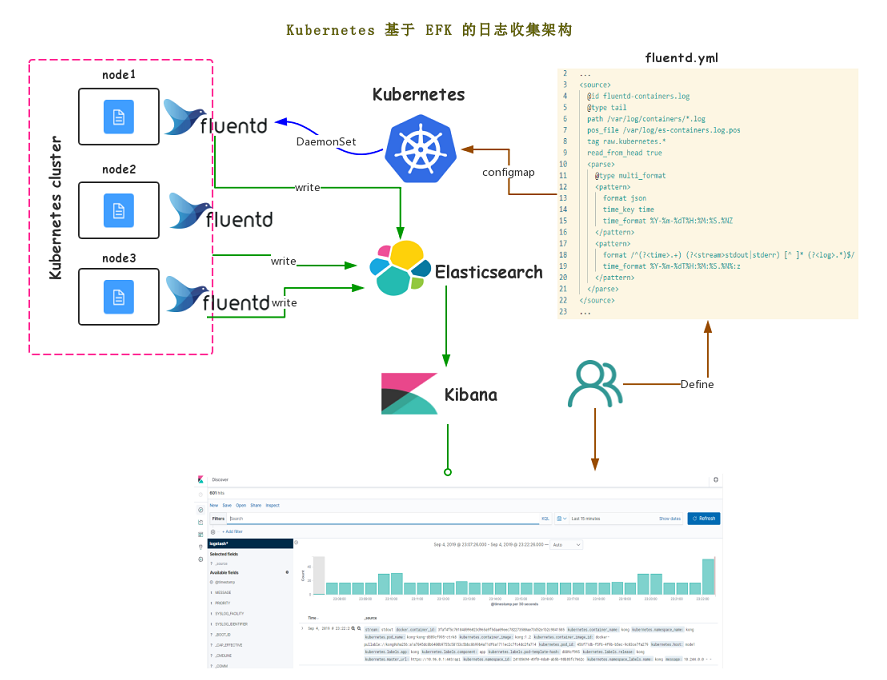
Uses Fluentd as the log collection agent. The advantage is that Fluentd consumes far fewer resources than a Logstash cluster, making the architecture simpler and more flexible. The disadvantage is that Fluentd configuration is relatively complex, with a higher barrier to entry, making it difficult to learn quickly. The configuration files are also relatively complex and cumbersome to modify. Users need to be proficient enough in Fluentd, Elasticsearch, and Kibana to use them skillfully and solve various complex business problems. The maintainers of the Elasticsearch cluster must also be sufficiently proficient in cluster performance optimization and resource management to ensure normal business operations.
In this architecture, Fluentd collects program logs, stores them in an Elasticsearch cluster, and then Kibana connects to Elasticsearch to enable log querying.
Guance Architecture
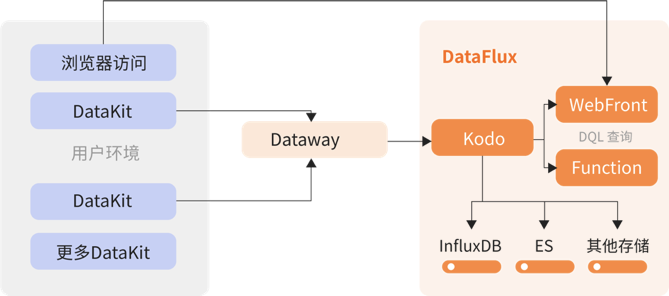
DataKit, as the basic data collection tool, is mainly used to collect various metrics, logs, and other data from system operations. It aggregates them to Guance via DataWay. In Guance, users can view and analyze their various metrics, logs, and other data. DataKit is a crucial data collection component in Guance. All data in Guance originates from DataKit.
DataKit deployment and configuration are extremely simple and clear, and can be managed through a visual client. DataKit can collect not only log data but also APM data, infrastructure, containers, middleware, network performance, and more. DataKit does not need to rely on components like Elasticsearch or Kafka, as Logstash and Fluentd do, to supplement business functions. Guance completely eliminates these concerns, allowing users to truly focus only on their business optimization. DataKit does not require users to master a vast technology stack and incur high learning costs. With simple configuration, it can be used together with Guance to solve various complex business problems. The overall O&M cost of ELK and EFK is enormous. The Elasticsearch cluster alone requires significant expenses. Additionally, considering hot/cold data tiering to save costs can be a headache. Using Guance eliminates these concerns, allowing you to focus all your attention on the business.
Hardware Cost Comparison
Price is a factor of universal concern. We will use cloud services to compare the costs of ELK, EFK, and Guance.
ELK Cost
The basic components of Elastic are open source. The main cost comes from hardware. We estimate the cost based on different architectures collecting logs from 10 servers, each generating 1 GB of logs per day.
LogStash Cluster + Kafka Cluster + ElasticSearch Cluster + Kibana
- LogStash Cluster
| Billing Item | Value | Unit Price | Cost (CNY) |
|---|---|---|---|
| Server | 1 x 2 vCPUs, 4 GB RAM | Monthly subscription: 216.7 CNY/month | 216.7 |
| Storage | 50 GB | ESSD: 0.5 CNY/GB | 25 |
| Total | 241.7 |
- Kafka Cluster
| Billing Item | Value | Unit Price | Cost (CNY) |
|---|---|---|---|
| Server | 3 x 4 vCPUs, 16 GB RAM | Monthly subscription: 788 CNY/month | 2364 |
| Storage | 200 GB | ESSD: 0.5 CNY/GB | 300 |
| Total | 2664 |
- ElasticSearch Cluster
| Billing Item | Value | Unit Price | Cost (CNY) |
|---|---|---|---|
| Server | 3 x 2 vCPUs, 8 GB RAM | Monthly subscription: 383 CNY/month | 1149 |
| Storage | 500 GB | ESSD: 0.5 CNY/GB | 750 |
| Total | 1899 |
- Kibana Node
| Billing Item | Value | Unit Price | Cost (CNY) |
|---|---|---|---|
| Server | 1 x 1 vCPU, 2 GB RAM | Monthly subscription: 104 CNY/month | 104 |
| Storage | 50 GB | ESSD: 0.5 CNY/GB | 25 |
| Total | 129 |
Based on the storage and server configuration for a small-scale business, the total monthly cost for LogStash + Kafka + ElasticSearch + Kibana is 5175.4 CNY.
For a simple architecture without the Kafka cluster, LogStash + ElasticSearch + Kibana would cost a total of 2511.4 CNY per month.
EFK Cost
The basic components of Elastic are open source. The main cost comes from hardware. We estimate the cost based on different architectures collecting logs from 10 servers, each generating 1 GB of logs per day.
Fluentd + ElasticSearch Cluster + Kibana
- Fluentd
Fluentd does not need to be deployed as a separate cluster, so its cost is not considered. Only ElasticSearch + Kibana costs are calculated.
- ElasticSearch Cluster
| Billing Item | Value | Unit Price | Cost (CNY) |
|---|---|---|---|
| Server | 3 x 2 vCPUs, 8 GB RAM | Monthly subscription: 383 CNY/month | 1149 |
| Storage | 500 GB | ESSD: 0.5 CNY/GB | 750 |
| Total | 1899 |
- Kibana Node
| Billing Item | Value | Unit Price | Cost (CNY) |
|---|---|---|---|
| Server | 1 x 1 vCPU, 2 GB RAM | Monthly subscription: 104 CNY/month | 104 |
| Storage | 50 GB | ESSD: 0.5 CNY/GB | 25 |
| Total | 129 |
Similarly, based on the same business scale, the total monthly cost for Fluentd + ElasticSearch + Kibana is 2028 CNY.
Guance Cost
Guance itself does not charge a product fee; it charges only based on storage usage. Pricing is based on the number of DataKit collectors, the volume of log data, the volume of backup log data, the number of daily task triggers, the time series count per single DataKit, the number of daily RUM sessions, and the number of APM traces. We also calculate the cost based on collecting logs from 10 servers, each generating 1 GB of logs per day.
| Billing Item / Plan | Free Plan | Agile Plan |
|---|---|---|
| Number of DataKits | Unlimited | 5 CNY/day |
| Time Series | Total time series <500 | 单台Datakit时间线<500,datakit费用=datakit数量 × 基础单价 If the time series per single DataKit > 500, the number of DataKits is calculated using the following formula: - Number of DataKits = Total time series in the current workspace / 500 (round up) - DataKit cost = Number of DataKits × Base unit price |
| Log Data Volume | 2 million entries | 0.5 CNY/day (per 1 million entries) |
| Backup Log Data Volume | N/A | 0.2 CNY/day (per 1 million entries) |
| Trace Count | 10,000 | 1 CNY/day (per 1 million entries) |
| Session Count / PV Count | 100 Sessions | 1 CNY/day (per 100 Sessions or 1,000 PVs) Note: The actual cost is based on the lower of the two dimensions (Sessions or PVs). |
| Synthetic API Test Calls | 5 | 1 CNY/day (per 1,000 calls) Note: Statistics exclude API test data generated by self-hosted nodes. |
| Synthetic Browser Test Calls | 15 CNY/day (per 1,000 calls) Note: Statistics exclude Browser test data generated by self-hosted nodes. |
|
| Task Trigger Count | 5,000 | 1 CNY/day (per 10,000 triggers) |
| SMS Sends | N/A | 0.1 CNY/day (per SMS) |
DataKit is installed on 10 servers. Log collection is 1 GB per server per day, assuming 4 KB per log entry.
| Billing Item | Value | Unit Price | Cost (CNY) |
|---|---|---|---|
| Server | 10 DataKits | Monthly subscription: 150 CNY/month | 1500 |
| Storage | 1 GB per day | 0.5 CNY/day (per 1 million entries) | 325 |
| Total | 1825 |
Based on the same business scale, the total monthly cost for Guance is 1825 CNY.
O&M Cost Comparison
When it comes to O&M costs, we all know that proper maintenance is essential to ensure cluster integrity. Let's analyze the cost differences between the different solutions.
ELK O&M Cost
Since the basic components of Elastic are open source, you need to build and manage the clusters yourself. For a complex ELK architecture, this may include a Logstash cluster, a Kafka cluster, an Elasticsearch cluster, and a Kibana node. First, if the user's business log volume is large and the computation logic is complex, the requirements for the scale and configuration of the Logstash, Kafka, and Elasticsearch clusters are very high. Second, the skill requirements for O&M personnel vary with cluster scale. Large-scale clusters can encounter various issues, and maximizing resource utilization requires sufficient experience in performance tuning. Finally, a comprehensive technology stack is indispensable for O&M personnel.
EFK O&M Cost
Like ELK, EFK is also based on open-source components and requires users to build and manage the clusters themselves. One advantage over ELK is that EFK uses Fluentd as the collector, which can eliminate the Logstash cluster and consumes fewer resources. However, it still requires dynamic scaling of the Elasticsearch cluster based on business scale. It also faces the same challenges of high skill requirements for O&M personnel for large-scale clusters and difficult optimization. Fluentd configuration is also more difficult than Logstash, relying solely on the O&M personnel's experience. If the scripts are not optimized properly, log parsing can negatively impact the existing business on the server. To ensure the stable operation of the online business, the requirements for O&M personnel may be even higher.
Guance O&M Cost
Guance is a SaaS-based observability platform. For users, they only need to deploy a DataKit on the servers where they want to collect data. Enabling the visual management feature allows remote visual configuration and management of the collection end. The Guance platform provides optimal log parsing templates to help users achieve maximum performance utilization with minimal server pressure. With simple configuration, business logs can be parsed well, allowing users to focus more on business optimization and expansion without investing effort in optimizing the collection end and log parsing clusters. Furthermore, Guance provides complete online observability functionality covering infrastructure, containers, middleware, databases, message queues, application traces, frontend access, system security, and network access performance. Users can build their own observability scenarios based on business needs without having to study or modify immature open-source products. This truly achieves zero O&M cost, allowing users to focus on business development.
Learning Cost Comparison
For building or using a log analysis system, the learning cost is an indispensable part. To use it well, you must first learn it well. Let's look at the difficulty of getting started with different solutions.
ELK Learning Cost
Since the Elastic components are open source and require users to build clusters themselves, first, to use the ELK stack for log analysis and processing, learning about the ELK environment setup and component configuration is essential. For example, you need to establish an understanding of Elasticsearch, master Elasticsearch basics, master Elasticsearch index operations, and plan the Elasticsearch cluster properly. You also need to perform performance tuning on the open-source versions of Logstash and Elasticsearch.
EFK Learning Cost
Like ELK, EFK also requires learning these same topics. Moreover, Fluentd configuration is more flexible than Logstash, resulting in a higher learning cost. Performance optimization also becomes more dependent on experience. Compared to Logstash, which provides 120+ Grok templates, Fluentd requires users to refer to documentation and do more learning before they can truly use it effectively.
Guance Learning Cost
For Guance, users only need to deploy DataKit in their environment for data collection. The official documentation provides configuration references and usage guides for almost all data collection needs (currently covering 200+ technology stacks). If users want to perform log analysis, business observability, or distributed tracing, they only need to learn how to use the corresponding modules of the Guance platform and enable the corresponding DataKit collection items. This avoids the need to build and manage open-source clusters for log analysis and other requirements, which requires learning a multitude of technologies. This allows users to spend more effort on handling business problems rather than spending so much time learning various technologies just to keep open-source clusters running.
User Experience Comparison
Comparing the user experience of the products is also important. How does the perception differ when implementing the same functionality?
ELK User Experience
To use ELK for log analysis, you first need to build Logstash, Kafka, Elasticsearch clusters, and a Kibana display node. Second, to achieve data collection and parsing for certain components, you need to check if any of the existing 120+ parsing templates can be used. If not, you may need to go through some testing to implement data collection and parsing. When you find that performance consumption is too high during collection or parsing is too slow, debugging becomes a tedious process. At the same time, if log volume increases, you face the need to optimize Elasticsearch query indices and frequently scale the cluster. Finally, to display a certain business metric, you need to learn Kibana's KQL for data querying and display. To further perform real-time tracking and alerting of data, you may need to rely on other open-source components to meet the requirements. In the process from requirement identification to resolution, more than 80% of the time is spent dealing with various issues of the open-source components, leaving only a small portion of time for actual business analysis and optimization.
EFK User Experience
Using EFK for log analysis similarly involves building an Elasticsearch cluster and a Kibana display node. For Fluentd's more flexible configuration, users may need more time to configure and debug to successfully collect and parse data. Again, using the Elasticsearch cluster means you cannot avoid optimizing Elasticsearch indices and scaling the cluster. Finally, you need to learn Kibana for data querying and display. Similarly, in the process from requirement identification to resolution, users spend more than 80% of their time dealing with various issues of the open-source components, leaving only a small portion of time for actual business analysis and optimization.
Guance User Experience
Using Guance for log analysis and other requirements is very user-friendly. First, the installation and configuration of Guance's data collection agent, DataKit, is very simple—just one command. Second, for users' component log or data collection needs, Guance supports over 200 mainstream technology stacks, providing comprehensive support from infrastructure, containers, middleware, databases, message queues, application traces, frontend access, system security, and network access performance. It has a complete documentation system, so all user needs can be met by consulting the documentation. Additionally, the DataKit collector provides a visual client to help reduce user difficulty. Furthermore, the Guance platform provides a large number of official scenario views to help users better observe the health of their own business.
Guance builds full-chain observability covering infrastructure, containers, middleware, databases, message queues, application traces, frontend access, system security, and network access performance. Based on Guance standard products, after users correctly configure DataKit, they can quickly build complete observability for their projects. At the same time, based on the Line Protocol and Guance scenario building capabilities, users can also customize and conveniently integrate the metrics they need to observe, achieving further observability.
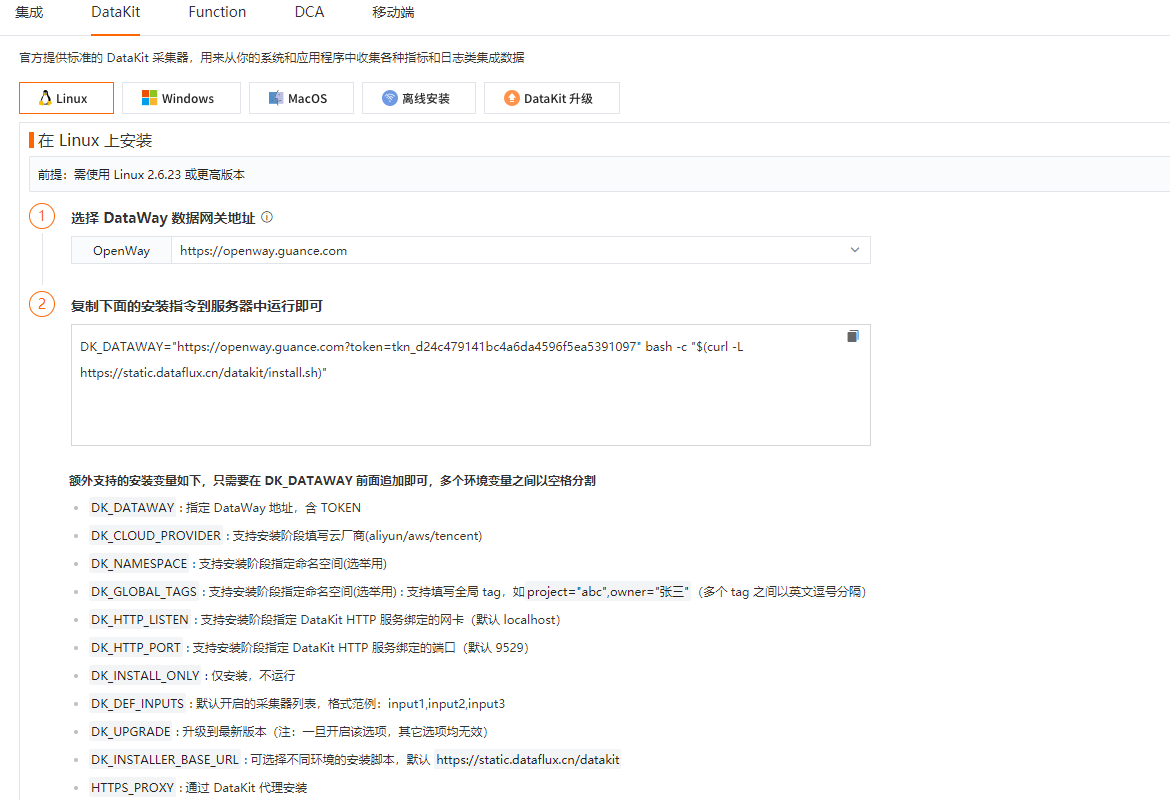
Simple DataKit Installation
Just one command to install DataKit.
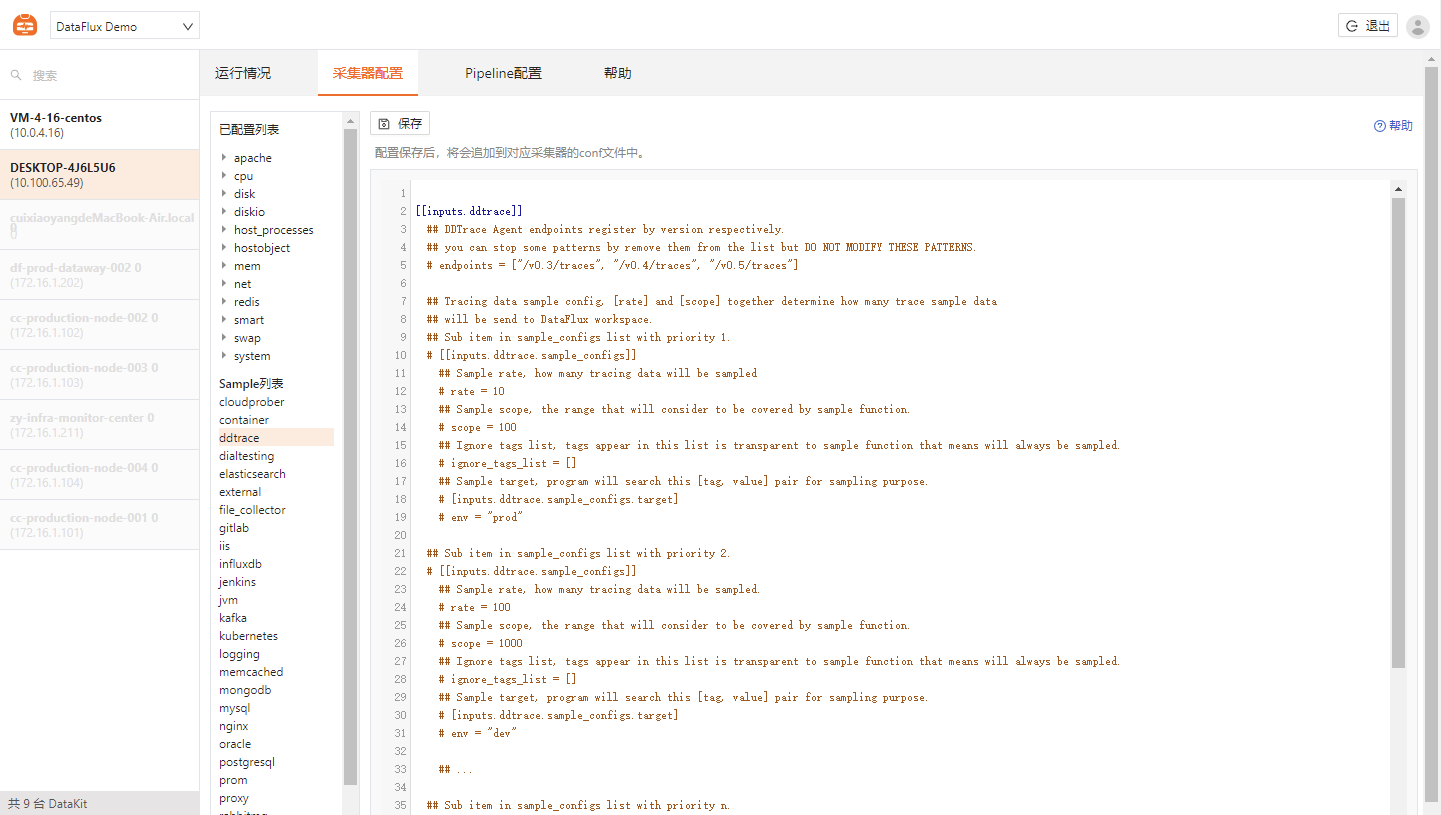
Convenient Collection Item Management
After enabling access to the DataKit client, you can modify collection items in the DataKit client. It also comes with a large number of built-in templates. Users only need to enable the corresponding configuration based on what they want to collect to complete data collection.
Rich Official Component Support
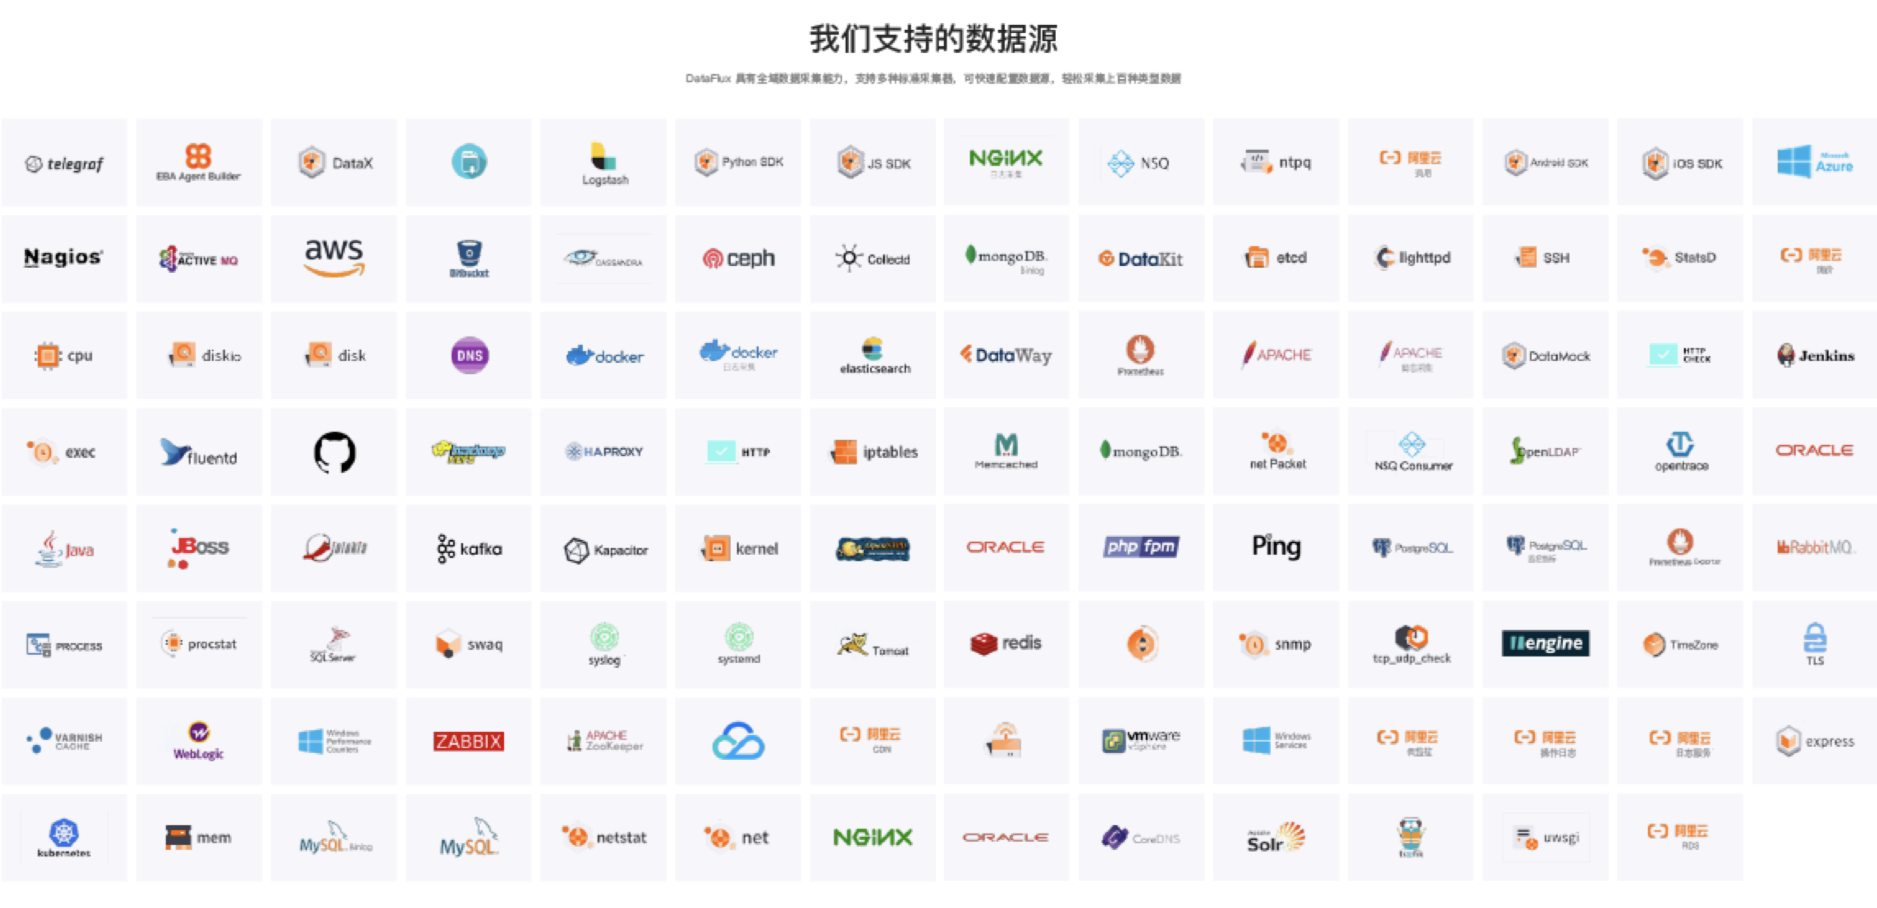
DataKit includes powerful built-in features—dynamic Grok syntax query debugging, fast data querying based on the proprietary DQL syntax, real-time input collection monitoring, edge computing capabilities, and visual client-based configuration and deployment of collection sources. It also supports over 200 officially maintained data source integrations and technology stack support, and is compatible with external data ingestion from Telegraf, Beats, Logstash, Fluentd, and more.
More Powerful Product Capabilities
Guance builds full-chain observability covering infrastructure, containers, middleware, databases, message queues, application traces, logs, system security, and network access performance. Based on Guance standard products, after users correctly configure DataKit, they can quickly build complete observability for their projects. Additionally, features like anomaly detection libraries for multiple technology stacks give users more options for complex business problems.