Best Practices for Full-Process Observability of E-commerce Orders
Introduction
To meet the demands of rapid iteration and surging traffic, e-commerce systems often use microservices for development and deployment. A performance bottleneck in a single microservice can directly impact the customer's shopping experience, especially when payment anomalies or order cancellations occur. In such cases, we need to observe the entire chain of events related to an order, tallying up real-time paid orders, abnormal orders, and canceled orders. These metrics are very helpful in analyzing business bottlenecks. This best practice is based on a distributed e-commerce platform built with Java, using Guance to observe the number of successfully paid orders and analyze the reasons for unsuccessful payments from an order perspective.
Prerequisites
Install Datakit
Data Integration
The method of integrating order data into Guance is through logs, where microservices output log files to cloud servers. On this cloud server, install DataKit and enable log collection by specifying the path to the log files. To parse out the order ID, buyer, and order status from the log file, you need to write a Pipeline script that splits these fields.
Enable Input
- Enable ddtrace
- Write Pipeline Script
Here %{DATA:username} represents the buyer, %{DATA:order_no} is the order ID, and %{DATA:order_status} is the order status.
#2021-12-22 10:09:53.443 [http-nio-7001-exec-7] INFO  c.d.s.b.s.i.OrderServiceImpl - [createOrder,164] - ecs009-book-order 7547183777837932733 2227975860088333788 test d6a3337d-ff82-4b00-9b4d-c07fb00c0cfb - User:test has placed an order, Order ID: d6a3337d-ff82-4b00-9b4d-c07fb00c0cfb


grok(_, "%{TIMESTAMP_ISO8601:time} %{NOTSPACE:thread_name} %{LOGLEVEL:status}%{SPACE}%{NOTSPACE:class_name} - \\[%{NOTSPACE:method_name},%{NUMBER:line}\\] - %{DATA:service1} %{DATA:trace_id} %{DATA:span_id} %{DATA:username} %{DATA:order_no} %{DATA:order_status} - %{GREEDYDATA:msg}")

default_time(time)
- Enable Logging Plugin, Copy Sample File
[[inputs.logging]]
  ## required
  logfiles = [
    "/usr/local/df-demo/book-shop/logs/order/log.log"
  ]

  ## glob filter
  ignore = [""]

  ## your logging source, if it's empty, use 'default'
  source = "log_book_order"

  ## add service tag, if it's empty, use $source.

  service = "book-store"

  ## grok pipeline script path
  pipeline = "log_book_order.p"

  ## optional statuses:
  ##   "emerg","alert","critical","error","warning","info","debug","OK"
  ignore_status = []

  ## optional encodings:
  ##    "utf-8", "utf-16le", "utf-16le", "gbk", "gb18030" or ""
  character_encoding = ""

  ## The pattern should be a regexp. Note the use of '''this regexp'''
  ## regexp link: https://golang.org/pkg/regexp/syntax/#hdr-Syntax
  multiline_match = '''^\d{4}-\d{2}-\d{2}'''

  ## removes ANSI escape codes from text strings
  remove_ansi_escape_codes = false

  [inputs.logging.tags]
    app = "book-shop"
  # some_tag = "some_value"
  # more_tag = "some_other_value"
- Restart DataKit
Integrating E-commerce Data
Project Source Code: book-store.
Using the log split by the Pipeline, since these logs are generated by microservices, you need to output the buyer, order ID, and order status to the logs. In this example, the logging tool used is Logback. To output business data via Logback, you need to use the MDC mechanism, which involves putting the buyer, order ID, and order status into MDC before logging, and then outputting them in the PATTERN section of logback-spring.xml. For this example, you need to modify the bookstore-order-service microservice code.
- Create Slices
Create slices, adding userName, orderNo, and orderStatus to MDC, and removing them after the request ends.
@Component
@Aspect
public class LogAop {
    private static final String USER_NAME = "userName";
    private static final String ORDER_NO = "orderNo";
    private static final String ORDER_STATUS = "orderStatus";

    @Pointcut("execution(public * com.devd.spring.bookstoreorderservice.controller..*.*(..))")
    public void controllerCall() {
    }

    @Before("controllerCall()")
    public void logInfoBefore(JoinPoint jp) throws UnsupportedEncodingException {
        MDC.put(USER_NAME, "");
        MDC.put(ORDER_NO, "");
        MDC.put(ORDER_STATUS, "");
    }

    @AfterReturning(returning = "req", pointcut = "controllerCall()")
    public void logInfoAfter(JoinPoint jp, Object req) throws Exception {
        MDC.remove(USER_NAME);
        MDC.remove(ORDER_NO);
        MDC.remove(ORDER_STATUS);
    }

}
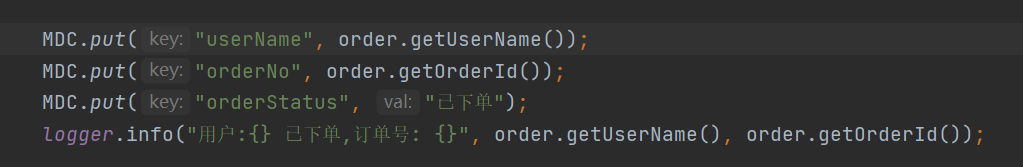
- Write Order Data to Logs
Output logs after successful order placement.
- Configure logback-spring.xml
<property name="CONSOLE_LOG_PATTERN" value="%d{yyyy-MM-dd HH:mm:ss.SSS} [%thread] %-5level %logger{20} - [%method,%line] - %X{dd.service} %X{dd.trace_id} %X{dd.span_id} %X{userName} %X{orderNo} %X{orderStatus} - %msg%n" />
Packaging and Deployment
- Frontend packaging, generates build directory
- Backend packaging, generates:
bookstore-account-service-0.0.1-SNAPSHOT.jar,
bookstore-payment-service-0.0.1-SNAPSHOT.jar,
bookstore-api-gateway-service-0.0.1-SNAPSHOT.jar,
bookstore-billing-service-0.0.1-SNAPSHOT.jar,
bookstore-catalog-service-0.0.1-SNAPSHOT.jar,
bookstore-eureka-discovery-service-0.0.1-SNAPSHOT.jar,
bookstore-order-service-0.0.1-SNAPSHOT.jar
Enable RUM
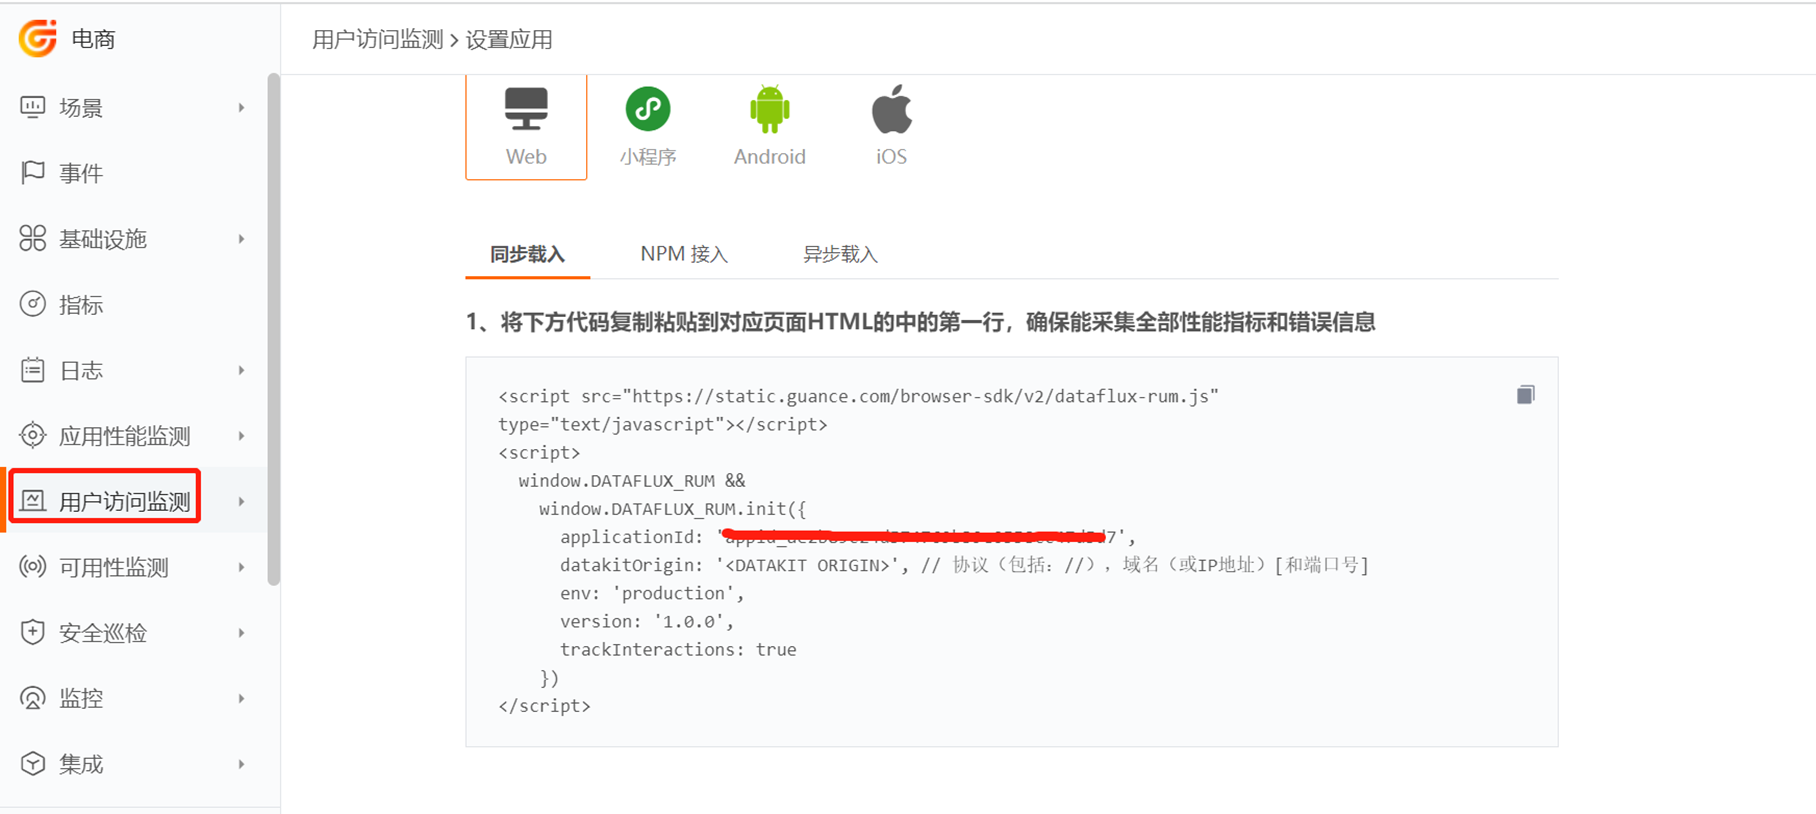
- Login to Guance
Click 【User Analysis】- 【Create】 enter book-shop, choose Web, copy the js.
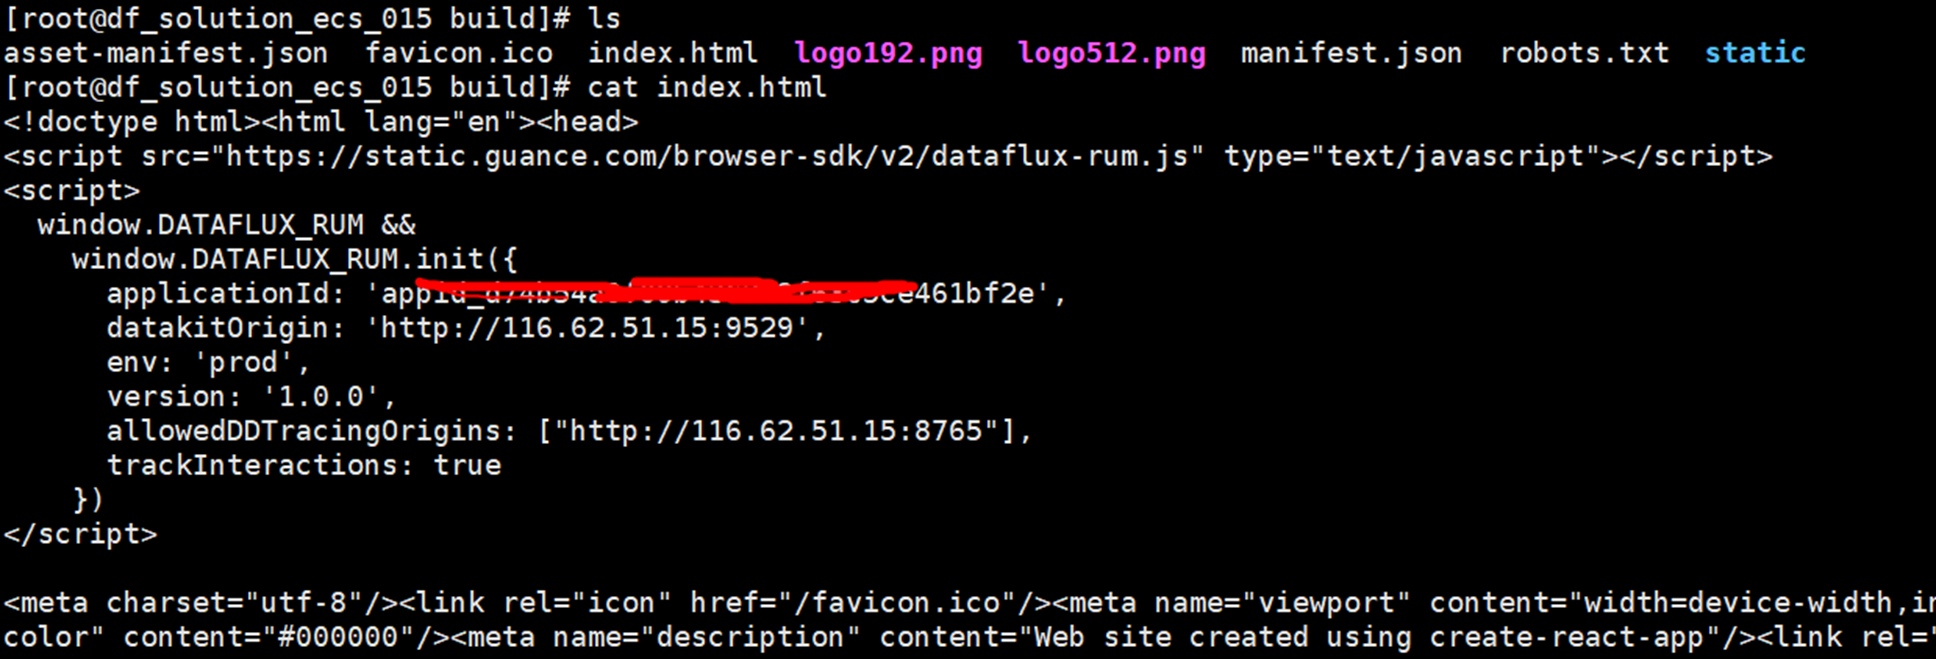
- Copy build Directory to Server
Open index.html, paste the copied js into the head, and modify the datakitOrigin value to the DataKit address deployed on the current cloud server, and set allowedDDtracingOrgins to the Gateway address.
- Install Nginx, Deploy Web Project
server {
        listen       80;
        location / {
            proxy_set_header   Host    $host:$server_port;
            proxy_set_header   X-Real-IP   $remote_addr;
            proxy_set_header   X-Forwarded-For  $proxy_add_x_forwarded_for;
                  root   /usr/local/df-demo/book-shop/build;
            index  index.html index.htm;
        }
}
Enable APM
Guance collects Trace data using: /usr/local/datakit/data/dd-java-agent.jar.
java -jar bookstore-eureka-discovery-service-0.0.1-SNAPSHOT.jar


java  -javaagent:/usr/local/datakit/data/dd-java-agent.jar \
 -Ddd.service.name=book-gateway \
 -Ddd.env=dev  \
 -Ddd.agent.port=9529   \
 -jar bookstore-api-gateway-service-0.0.1-SNAPSHOT.jar


java  -javaagent:/usr/local/datakit/data/dd-java-agent.jar \
 -Ddd.service.name=book-account \
 -Ddd.env=dev  \
 -Ddd.agent.port=9529   \
 -jar bookstore-account-service-0.0.1-SNAPSHOT.jar

java  -javaagent:/usr/local/datakit/data/dd-java-agent.jar \
 -Ddd.service.name=book-order \
 -Ddd.env=dev  \
 -Ddd.agent.port=9529   \
 -jar bookstore-order-service-0.0.1-SNAPSHOT.jar


java  -javaagent:/usr/local/datakit/data/dd-java-agent.jar \
 -Ddd.service.name=book-billing \
 -Ddd.env=dev  \
 -Ddd.agent.port=9529   \
 -jar bookstore-billing-service-0.0.1-SNAPSHOT.jar


java  -javaagent:/usr/local/datakit/data/dd-java-agent.jar \
 -Ddd.service.name=book-payment \
 -Ddd.env=dev  \
 -Ddd.agent.port=9529   \
 -jar bookstore-payment-service-0.0.1-SNAPSHOT.jar


java  -javaagent:/usr/local/datakit/data/dd-java-agent.jar \
 -Ddd.service.name=book-catalog \
 -Ddd.env=dev  \
 -Ddd.agent.port=9529   \
 -jar bookstore-catalog-service-0.0.1-SNAPSHOT.jar
Order Monitoring View
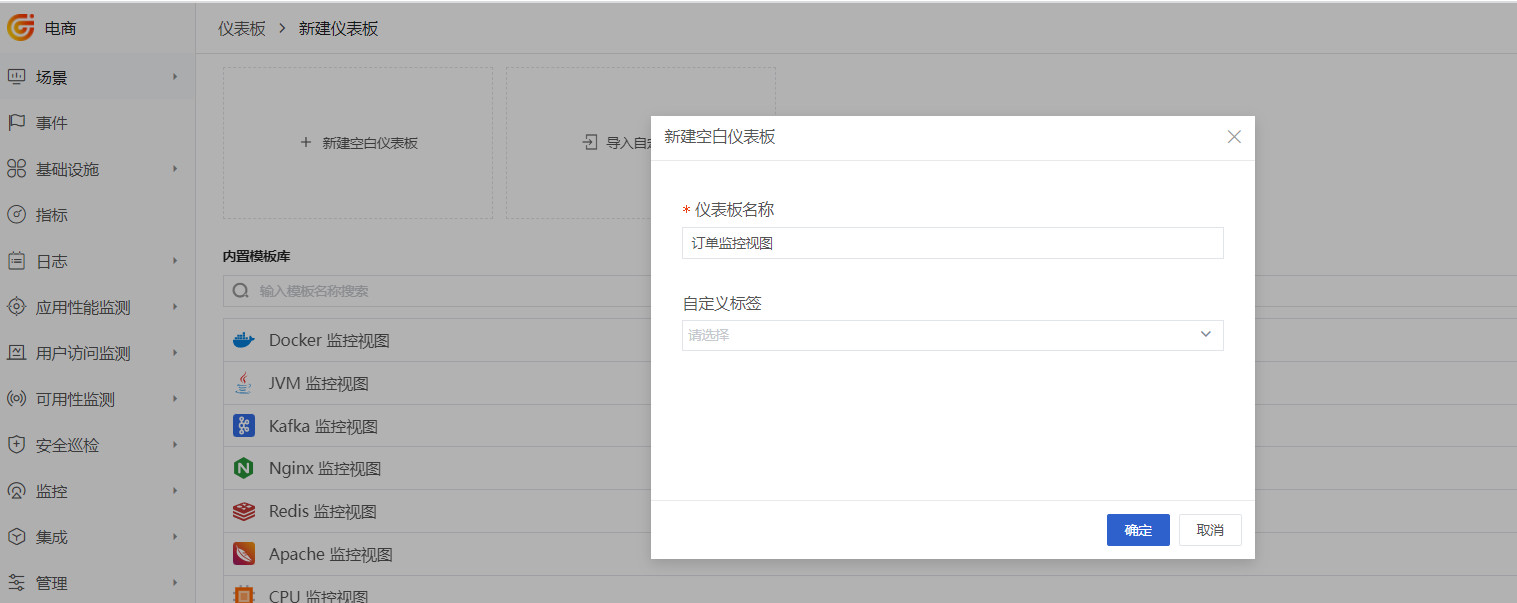
Login to Guance, 【Use Cases】-> 【Create Dashboard】-> 【Create Blank Dashboard】, input “Order Monitoring View”, click 【Confirm】.
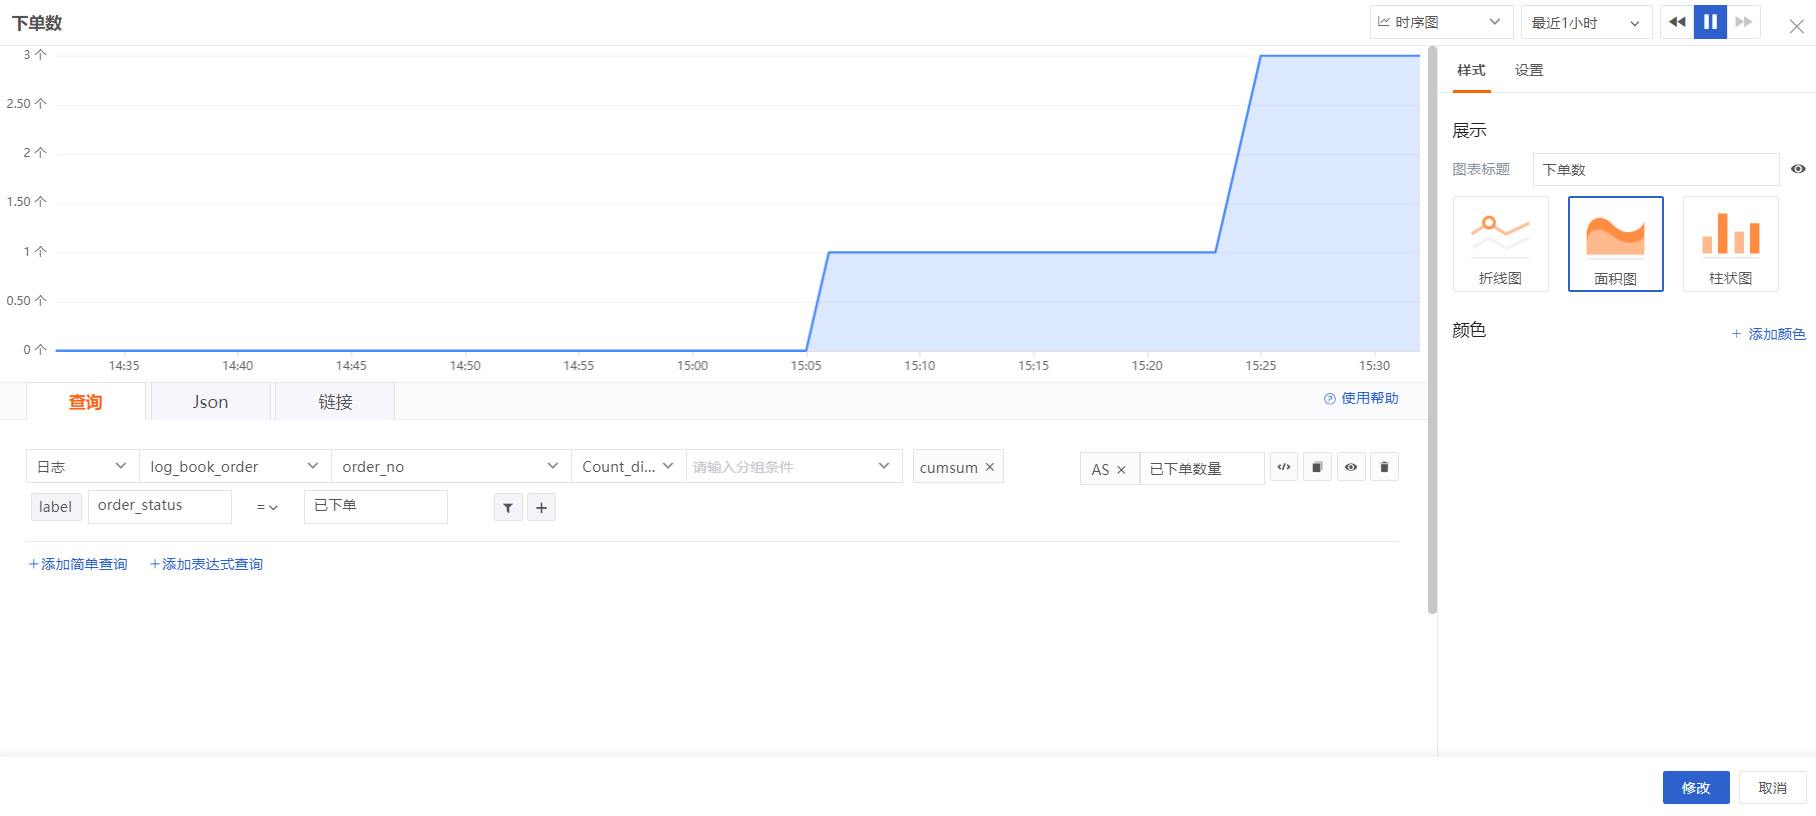
Click the dashboard created in the previous step, click 【Edit】, drag a “Time Series Chart”, title the chart as “Number of Orders Placed”. In the time series chart, select “Logs”, then select log_book_order. log_book_order is the source value in log_book_order.conf, then select order_no, and choose “Count_distinct_by” as the sorting method. Select “order_status” as the filtering condition, and set its value to “Placed”. This time series chart counts the number of placed orders. Finally, click “+” -> Conversion Function -> cumsum, converting the number of orders within a unit of time into cumulative totals.
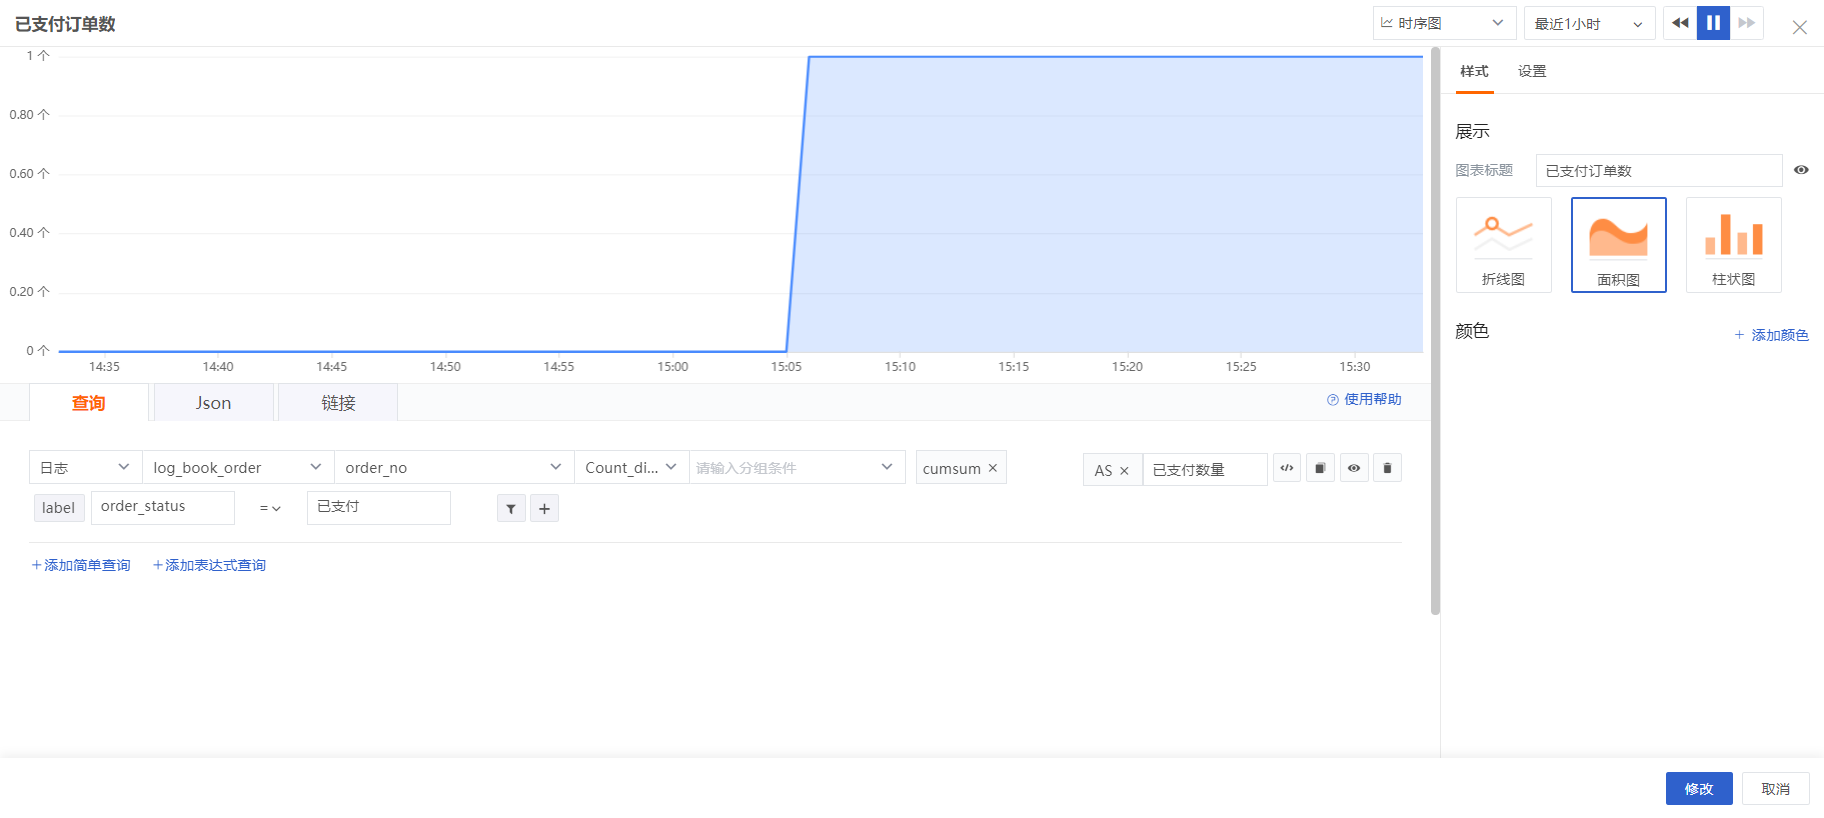
Drag a “Time Series Chart”, title the chart as “Number of Paid Orders”. In the time series chart, select “Logs”, then select log_book_order. log_book_order is the source value in log_book_order.conf, then select order_no, and choose “Count_distinct_by” as the sorting method. Select “order_status” as the filtering condition, and set its value to “Paid”. This time series chart counts the number of paid orders. Finally, click “+” -> Conversion Function -> Cumsum, converting the number of orders within a unit of time into cumulative totals.
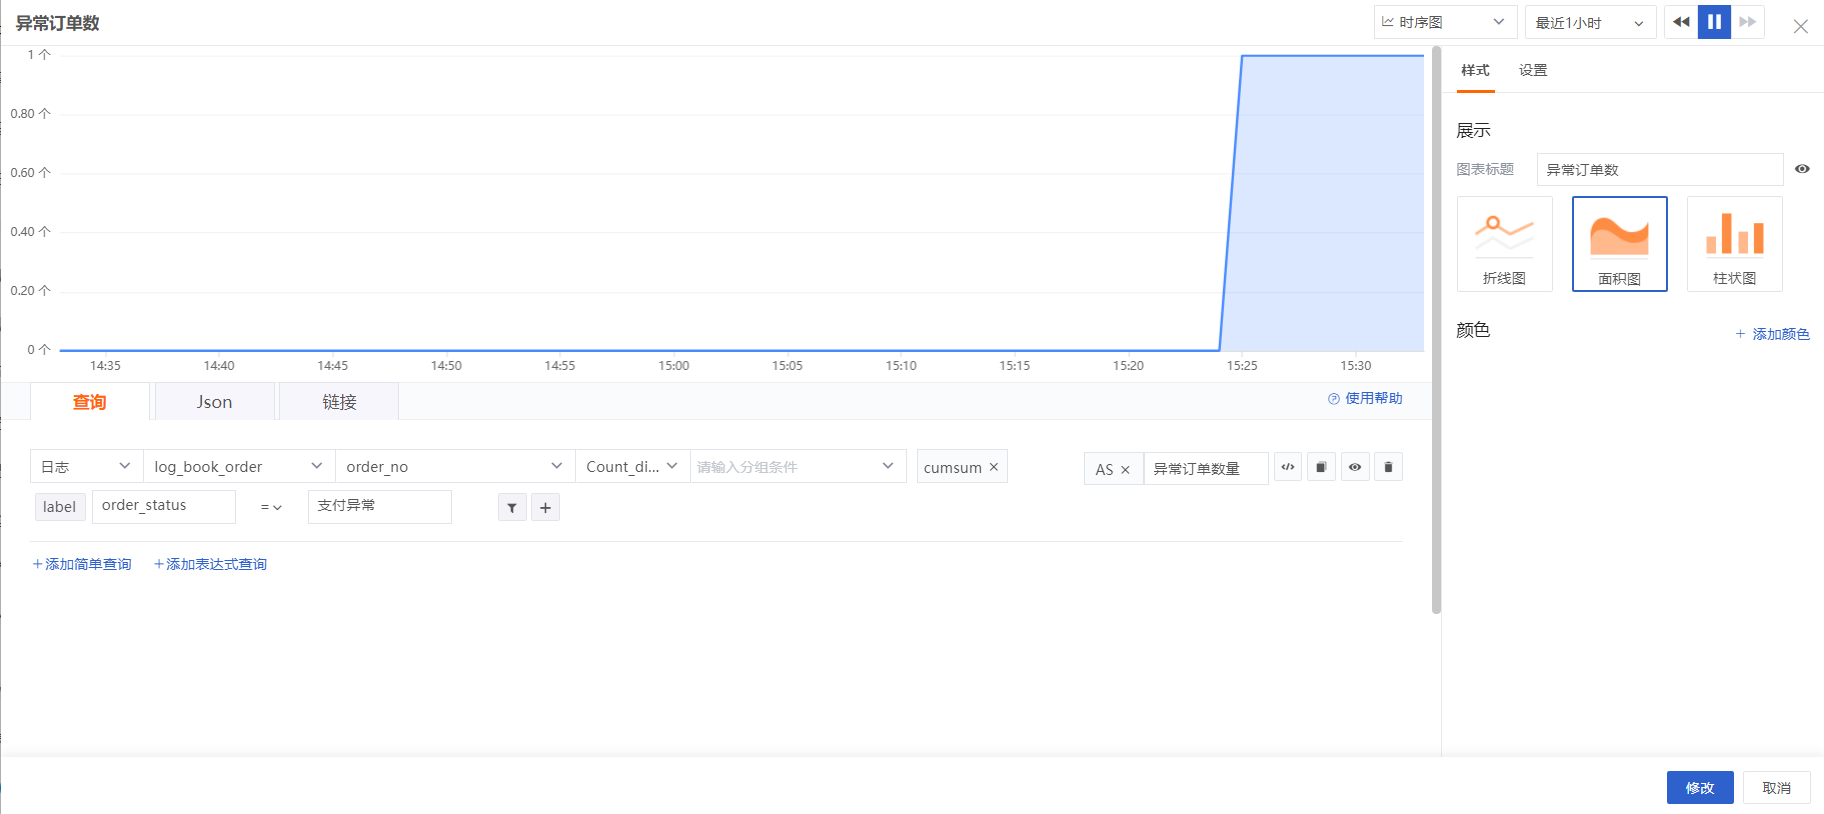
Drag a “Time Series Chart”, title the chart as “Number of Abnormal Orders”. In the time series chart, select “Logs”, then select log_book_order. log_book_order is the source value in log_book_order.conf, then select order_no, and choose “Count_distinct_by” as the sorting method. Select “order_status” as the filtering condition, and set its value to “Payment Anomaly”. This time series chart counts the number of orders with payment anomalies. Finally, click “+” -> Conversion Function -> Cumsum, converting the number of orders within a unit of time into cumulative totals.