Log Pipeline User Guide
Pipeline supports text parsing of log data in different formats. By writing Pipeline scripts, you can extract structured logs that meet your requirements and use the extracted fields as attributes. With attribute fields, you can quickly filter relevant logs and perform data correlation analysis, helping you quickly locate and resolve issues.
Guance provides an official Pipeline script library with multiple built-in log parsing Pipelines. It also supports creating custom Pipeline scripts. The following sections describe how to use the custom Pipeline feature.
Prerequisites
- You need to create a Guance account and install DataKit on your host;
- Enable the Log Collector and turn on the Pipeline feature in the configuration file;
Custom Pipeline Script Files
Step 1: Enable the Log Collector (Using DataKit Logs as an Example)
After installing DataKit on the host, navigate to the /usr/local/datakit/conf.d/log directory, copy logging.conf.sample and rename it to logging.conf. Edit logging.conf to configure the path where DataKit logs are stored and the log source. For example:
logfiles = ["/var/log/datakit/log"]source = "datakit"
Note: In the Log Collector, the Pipeline feature is enabled by default. You can leave Pipeline = "" empty without specifying a Pipeline script name; the system automatically matches the script file with the same name as the source. If the log source and the Pipeline file name do not match, configure Pipeline = "xxxxxx.p" in the Log Collector.
[[inputs.logging]]
  ## required
  logfiles = [
    "/var/log/datakit/log",
  ]
  # only two protocols are supported:TCP and UDP
  # sockets = [
  #      "tcp://0.0.0.0:9530",
  #      "udp://0.0.0.0:9531",
  # ]
  ## glob filteer
  ignore = [""]

  ## your logging source, if it's empty, use 'default'
  source = "datakit"

  ## add service tag, if it's empty, use $source.
  service = ""

  ## grok pipeline script name
  ## If no specific pipeline is specified, the script with the same name as the source is matched automatically
  pipeline = ""
After completing the configuration, restart DataKit with the command datakit --restart to apply the changes.
Step 2: Determine the Fields to Extract Based on the Collected Logs
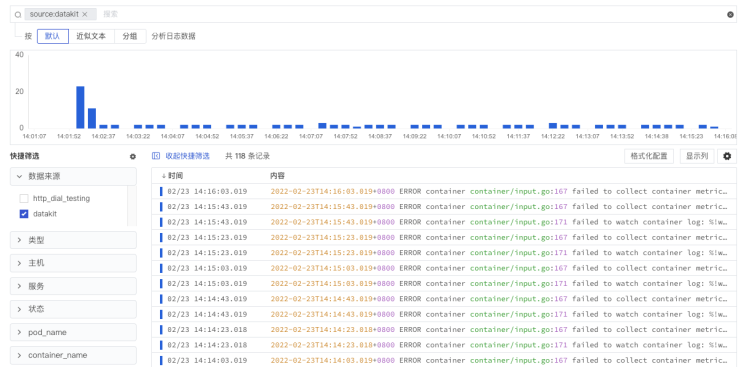
After enabling the Log Collector, you can view the collected DataKit logs in the Guance workspace. Observe and analyze the DataKit logs to determine the fields to extract, such as the log timestamp, log level, log module, module content, and log message.
Step 3: Create a Custom Pipeline
In the Guance workspace, go to Logs > Pipelines and click Create Pipeline to create a new Pipeline file.
Filter Logs
Select "datakit" as the log source. A Pipeline with the same name as the selected log source is generated automatically.
Define Parsing Rules
Define the parsing rules for the logs. Multiple script functions are supported. The editing area displays Source by default. You can switch to Flowchart to view the branch and loop processing relationships, or switch to Step Mode to read the script step by step. All three modes share the same script. Click Function Library to view function descriptions and syntax formats.
In Flowchart or Step Mode, click a node to modify its parameters or node source code, then click Apply to sync the changes to the full script. You can also insert, delete, move nodes up or down, or drag to reorder them within the same code block. For specific operations and usage limits, see Edit Parsing Rules.
In this example, based on the log observations, you can write a Pipeline script file. Use the add_pattern() script function to define custom patterns first, then reference these custom patterns in Grok to parse the logs. The example below uses rename and default_time to optimize the extracted fields.
add_pattern('_dklog_date', '%{YEAR}-%{MONTHNUM}-%{MONTHDAY}T%{HOUR}:%{MINUTE}:%{SECOND}%{INT}')
add_pattern('_dklog_level', '(DEBUG|INFO|WARN|ERROR|FATAL)')
add_pattern('_dklog_mod', '%{WORD}')
add_pattern('_dklog_source_file', '(/?[\\w_%!$@:.,-]?/?)(\\S+)?')
add_pattern('_dklog_msg', '%{GREEDYDATA}')

grok(_, '%{_dklog_date:log_time}%{SPACE}%{_dklog_level:level}%{SPACE}%{_dklog_mod:module}%{SPACE}%{_dklog_source_file:code}%{SPACE}%{_dklog_msg:msg}')
rename("time", log_time) # rename log_time to time
default_time(time)       # use the time field as the timestamp of the output data
For more Pipeline parsing rules, see the document Text Data Processing (Pipeline).
Log Sample Testing
After writing the script rules, manually enter logs in Test Samples or click Fetch Sample with One Click. Log samples support three formats: Message Only, All Fields (JSON), and All Fields (Line Protocol).
Click Add Sample to add up to 3 samples and switch between them using tabs. Click Start Test to run all non-empty samples. The results are displayed per sample in a separate overlay on the right side of the editing area. You can close the overlay and reopen it via View Results, or enlarge, copy, or pin it and drag it around.
After modifying the script or samples, the previous results are marked as Pending Re-test. Run the test again to confirm the current parsing results. See Test Samples and View Test Results for more operations.
Note:
- Log sample testing is optional;
- After a custom Pipeline is saved, the log sample testing data is saved along with it;
- JSON samples must be valid objects. All samples are validated before testing and saving, including tabs that are not currently selected.
Step 4: Save the Pipeline File
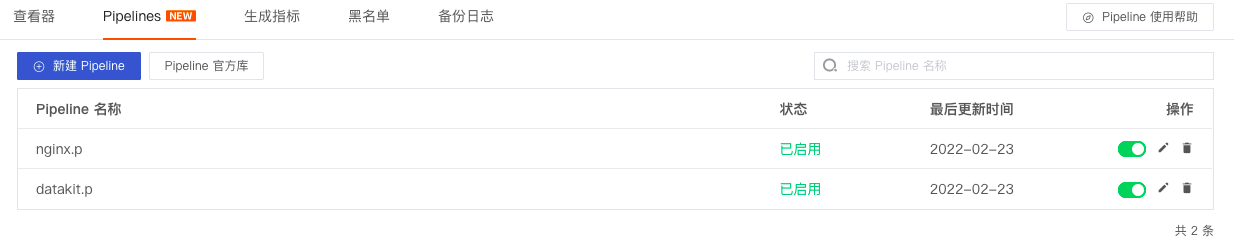
After completing all required configurations, save the Pipeline file. You can then view the custom Pipeline file in the Log Pipelines list.

Pipeline files created in the Guance workspace are uniformly stored in the /usr/local/datakit/Pipeline_remote directory.

Note: DataKit has two Pipeline directories and automatically matches Pipeline files in these directories.
Pipeline: the directory of Pipeline files in the official library;Pipeline_remote: the directory of custom Pipeline files in the Guance workspace;- If Pipeline files with the same name exist in both directories, DataKit gives priority to the Pipeline file in
Pipeline_remote.
Step 5: View the Extracted Fields in Guance
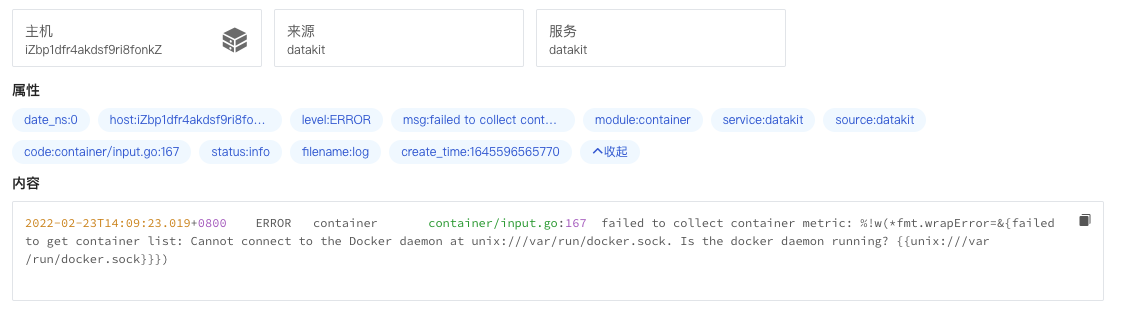
In the logs section of the Guance workspace, select a datakit log. On the log details page, you can see the fields and field values under "Attributes". These are the fields and values displayed after log parsing. For example:
code: container/input.go:167level: ERRORmodule: container
Clone Pipeline Script Files from the Official Library
Step 1: Enable the Nginx Collector
After installing DataKit on the host, navigate to the /usr/local/datakit/conf.d/nginx directory, copy nginx.conf.sample and rename it to nginx.conf. Edit nginx.conf to configure the path where Nginx logs are stored and enable the Pipeline. For example:
files = ["/var/log/nginx/access.log","/var/log/nginx/error.log"]Pipeline = "nginx.p"(You can leave the quotes""empty without specifying a Pipeline script name; DataKit automatically matches the script file with the same name as the source.)
Note: After Pipeline is enabled, DataKit automatically matches the Pipeline script file based on the log source. If the log source and the Pipeline file name do not match, configure it in the collector. For example, if the log source is nginx and the Pipeline file name is nginx1.p, configure Pipeline = "nginx1.p".
[[inputs.nginx]]
        url = "http://localhost/server_status"
        # ##(optional) collection interval, default is 30s
        # interval = "30s"
        use_vts = false
        ## Optional TLS Config
        # tls_ca = "/xxx/ca.pem"
        # tls_cert = "/xxx/cert.cer"
        # tls_key = "/xxx/key.key"
        ## Use TLS but skip chain & host verification
        insecure_skip_verify = false
        # HTTP response timeout (default: 5s)
        response_timeout = "20s"

        [inputs.nginx.log]
                files = ["/var/log/nginx/access.log","/var/log/nginx/error.log"]
        #       # grok pipeline script path
                pipeline = "nginx.p"
        [inputs.nginx.tags]
        # some_tag = "some_value"
        # more_tag = "some_other_value"
        # ...
After completing the configuration, restart DataKit with the command datakit --restart to apply the changes.
For more Nginx collector configurations, see Nginx.
Step 2: Determine the Fields to Extract Based on the Collected Logs
After enabling the Nginx collector, configuring the log file path, and enabling Pipeline, you can view the collected Nginx logs in the Guance workspace. In the log details, you can view the field attributes extracted by the Pipeline file. Observe and analyze the logs to determine whether the extracted fields need to be optimized.

Step 3: Clone and Customize an Official Library Pipeline
In the Guance workspace, go to Logs > Pipelines and click Pipeline Official Library. Select the nginx.p Pipeline file to view and clone.
- Select "nginx" in Filter Logs;
- Optimize the parsing rules in Define Parsing Rules;
- Enter Nginx log data in Test Samples, click Start Test, and verify the parsing results of each sample in the results overlay.
Note:
- The Pipeline official library includes multiple log sample testing datasets. Before cloning, you can select the log sample testing dataset that fits your needs;
- After saving changes to a cloned Pipeline, the log sample testing data is saved along with it.
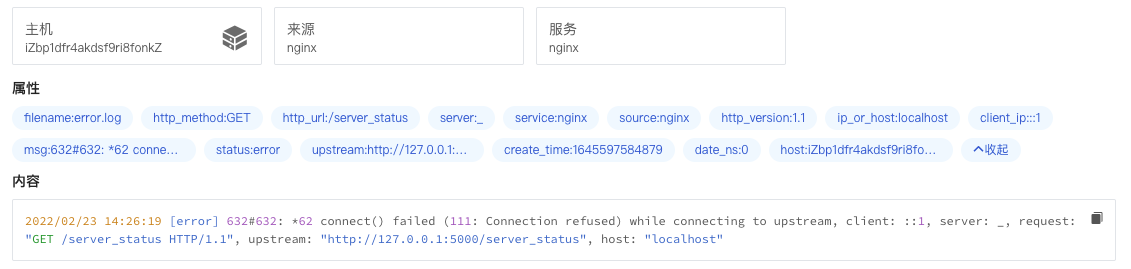
2022/02/23 14:26:19 [error] 632#632: *62 connect() failed (111: Connection refused) while connecting to upstream, client: ::1, server: _, request: "GET /server_status HTTP/1.1", upstream: "http://127.0.0.1:5000/server_status", host: "localhost"
Step 4: Save the Pipeline File
After completing all required configurations, save the Pipeline file. You can then view the custom Pipeline file in the Log Pipelines list.
Pipeline files created in the Guance workspace are uniformly stored in the /usr/local/datakit/Pipeline_remote directory.

Note: DataKit has two Pipeline directories and automatically matches Pipeline files in these directories.
Pipeline: the directory of Pipeline files in the official library;Pipeline_remote: the directory of custom Pipeline files in the Guance workspace;- If Pipeline files with the same name exist in both directories, DataKit gives priority to the Pipeline file in
Pipeline_remote.
Step 5: View the Extracted Fields in Guance
In the logs section of the Guance workspace, select an nginx log. On the log details page, you can see the fields and field values under "Attributes". These are the fields and values displayed after log parsing. For example:
http_method: GEThttp_url: /server_statushttp_version: 1.1
Further Reading
This concludes the log Pipeline user guide for Guance workspaces. For more information about Pipeline, log collection, and log parsing, refer to the following documentation: