Generate Metrics
- Version: 1.0.7-7-g251eead
- Release Date: 2023-04-06 11:17:57
- Supported OS: windows/amd64, windows/386, linux/arm, linux/arm64, linux/386, linux/amd64
Guance supports generating new metric data based on existing data in the current workspace, allowing you to design and implement custom technical metrics as needed.
Warning
- Creating or editing generate metrics rules requires the "Generate Metrics Configuration Management" action permission. For more details, see the Permission List.
- After metrics are generated, they are stored according to the current default data storage policy and billed based on the number of time series produced.
- If no data is reported during the generation period, the metrics cannot be queried or analyzed in the workspace, such as in "Metrics Analysis", "Charts", or the "DQL Query Tool".
Create / Clone Rules
Go to Security Check > Generate Metrics page.
- Click Create Rule to start creating a new generate metrics rule.
- Click the icon to clone an existing rule.
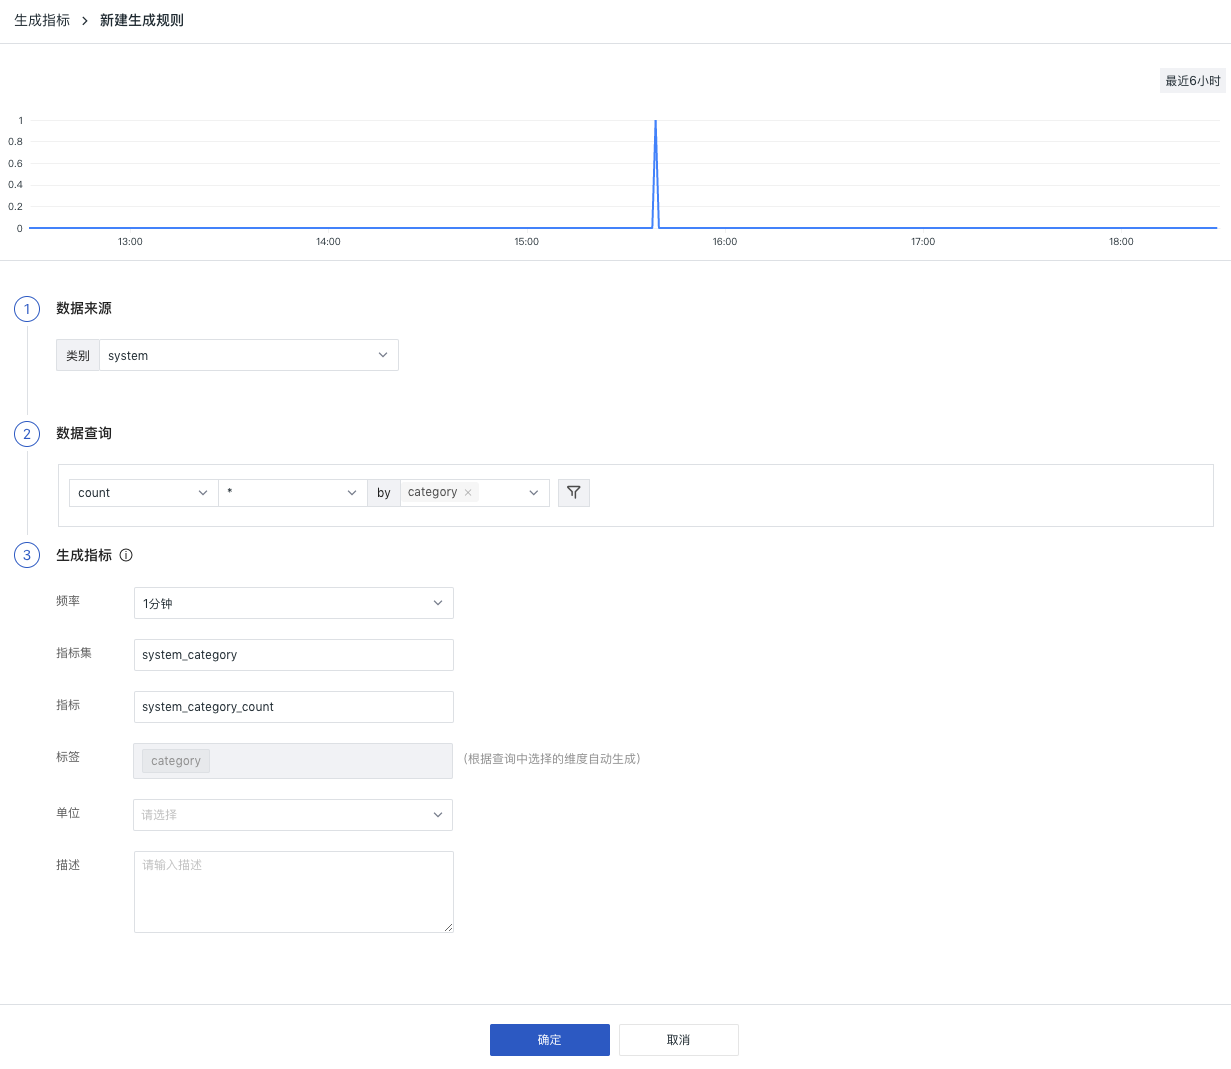
Step 1: Data Source. Select data sources from all available or a single category in the current workspace.
- Category: After the Security Check collector is enabled, categories include
network,storage,database,system,webserver,Kubernetes. Note: "*" means all.
Step 2: Data Query. Based on the selected category, choose an aggregation method and query statistics for different dimensions.
- Aggregation Methods: See the table below.
| Aggregation Method | Description |
|---|---|
| count | Count of records |
| avg | Average value (requires selecting an aggregation field) |
| max | Maximum value (requires selecting an aggregation field) |
| min | Minimum value (requires selecting an aggregation field) |
| P75 | 75th percentile value (requires selecting an aggregation field) |
| P95 | 95th percentile value (requires selecting an aggregation field) |
| P99 | 99th percentile value (requires selecting an aggregation field) |
- Dimensions: Aggregate data by the selected objects, generating a statistic for each selected object in the data request.
- Filters: Add one or more filter conditions to existing tag data, and combine conditions on the same row with "and" or "or".
Step 3: Generate Metrics. Configure how the metrics are generated and their results, including the generation frequency, the name of the new metric, and the measurement name.
- Frequency: The execution interval for generating metrics. Default is 1 minute, meaning new metric data is generated every minute. The frequency also determines the aggregation window: if you select 1 minute, aggregation happens every minute, and the time range for each aggregation is also 1 minute.
- Time Range: Based on the selected frequency as the interval. The chart default query is 6 hours, meaning the data statistics display effect for the last 6 hours. When the frequency is set to >=1 hour, the query time range is fixed to 7 days.
- Measurement: Set the name of the measurement where the metric will be stored.
- Metric: Set the metric name. Metric names must not be duplicated. You can add multiple metrics.
- Tags: Automatically generated based on the dimensions selected in the query.
- Unit: Optional. Set the unit for the metric. After setting the unit, it can be applied in chart queries.
- Description: Optional. Set the description for the metric. After setting the description, it can be applied in chart queries.
Step 4: Complete the rule configuration and click Confirm to finalize the generate metrics rule and start data collection.
Operation Instructions
All added rules are displayed on the Generate Metrics page. Users can perform actions such as Enable/Disable, Open in Metrics Analysis, Open in Metrics Management, Edit, and Delete.

Edit Rules
On the Generate Metrics page, you can view all created generate metrics rules and edit them.
Note: Because the data source and aggregation expression determine the data type, some rules do not support editing or modification.

Enable/Disable Rules
On the Generate Metrics page, you can change the rule status. When a rule is disabled, corresponding data stops being written to the measurement. Data writing resumes when the rule is re-enabled.
Delete Rules
On the Generate Metrics page, you can delete unnecessary rules. After deletion, the measurement is not removed, but data writing stops.
Batch Operations
You can perform batch operations on specific rules, including enabling, disabling, and deleting rules.
View Metrics
View in Metrics Analysis
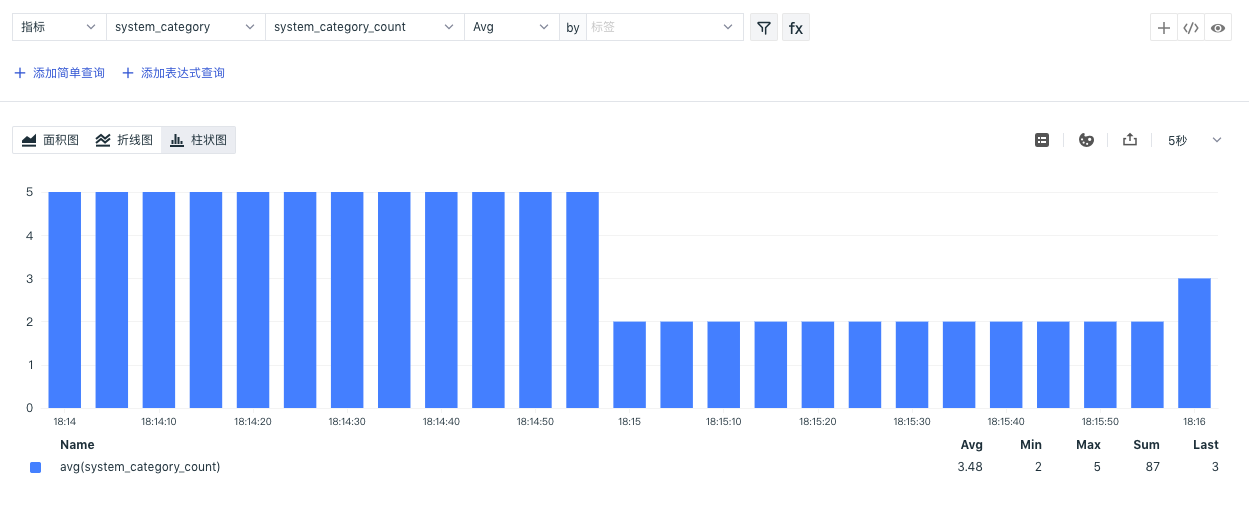
On the Generate Metrics page, click the Open in Metrics Analysis button next to a rule to jump to the Metrics Analysis page for querying and analysis.
View in Metrics Management
On the Generate Metrics page, click the Open in Metrics Management button next to a rule to jump to the Metrics Management page to view metrics and tags, and edit metric units and descriptions.

More Scenario Applications
Use in Chart Queries
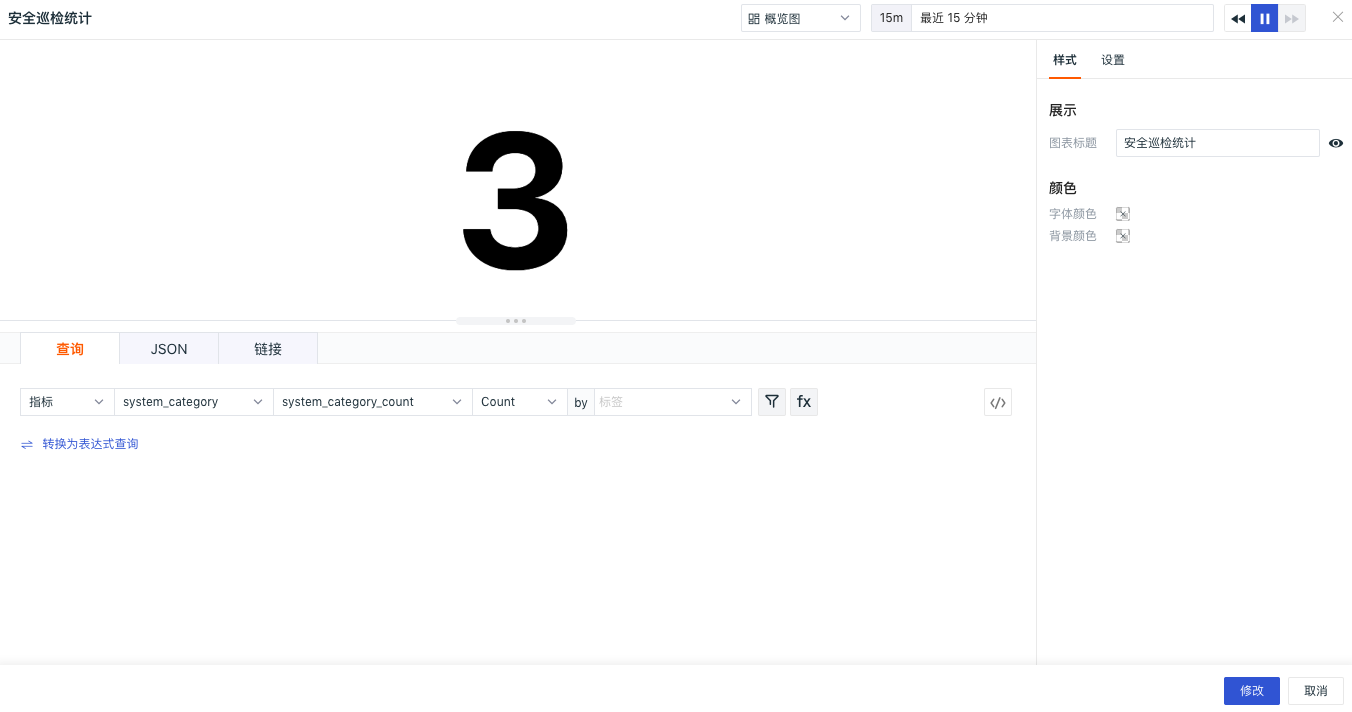
After metrics are generated, you can go to Scenes > Dashboard > Create Dashboard to query and analyze metric data in visual charts.
Use in the DQL Query Tool
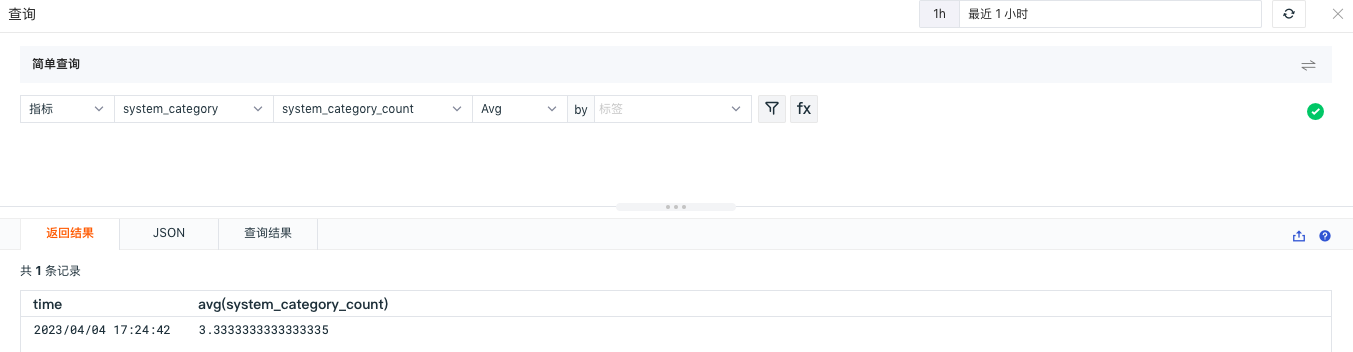
After metrics are generated, you can go to Shortcut > DQL Query to query and analyze metric data.