Best Practices for Performance Observability in Large-Scale Microservice Projects
Author: Liu Rui
Background
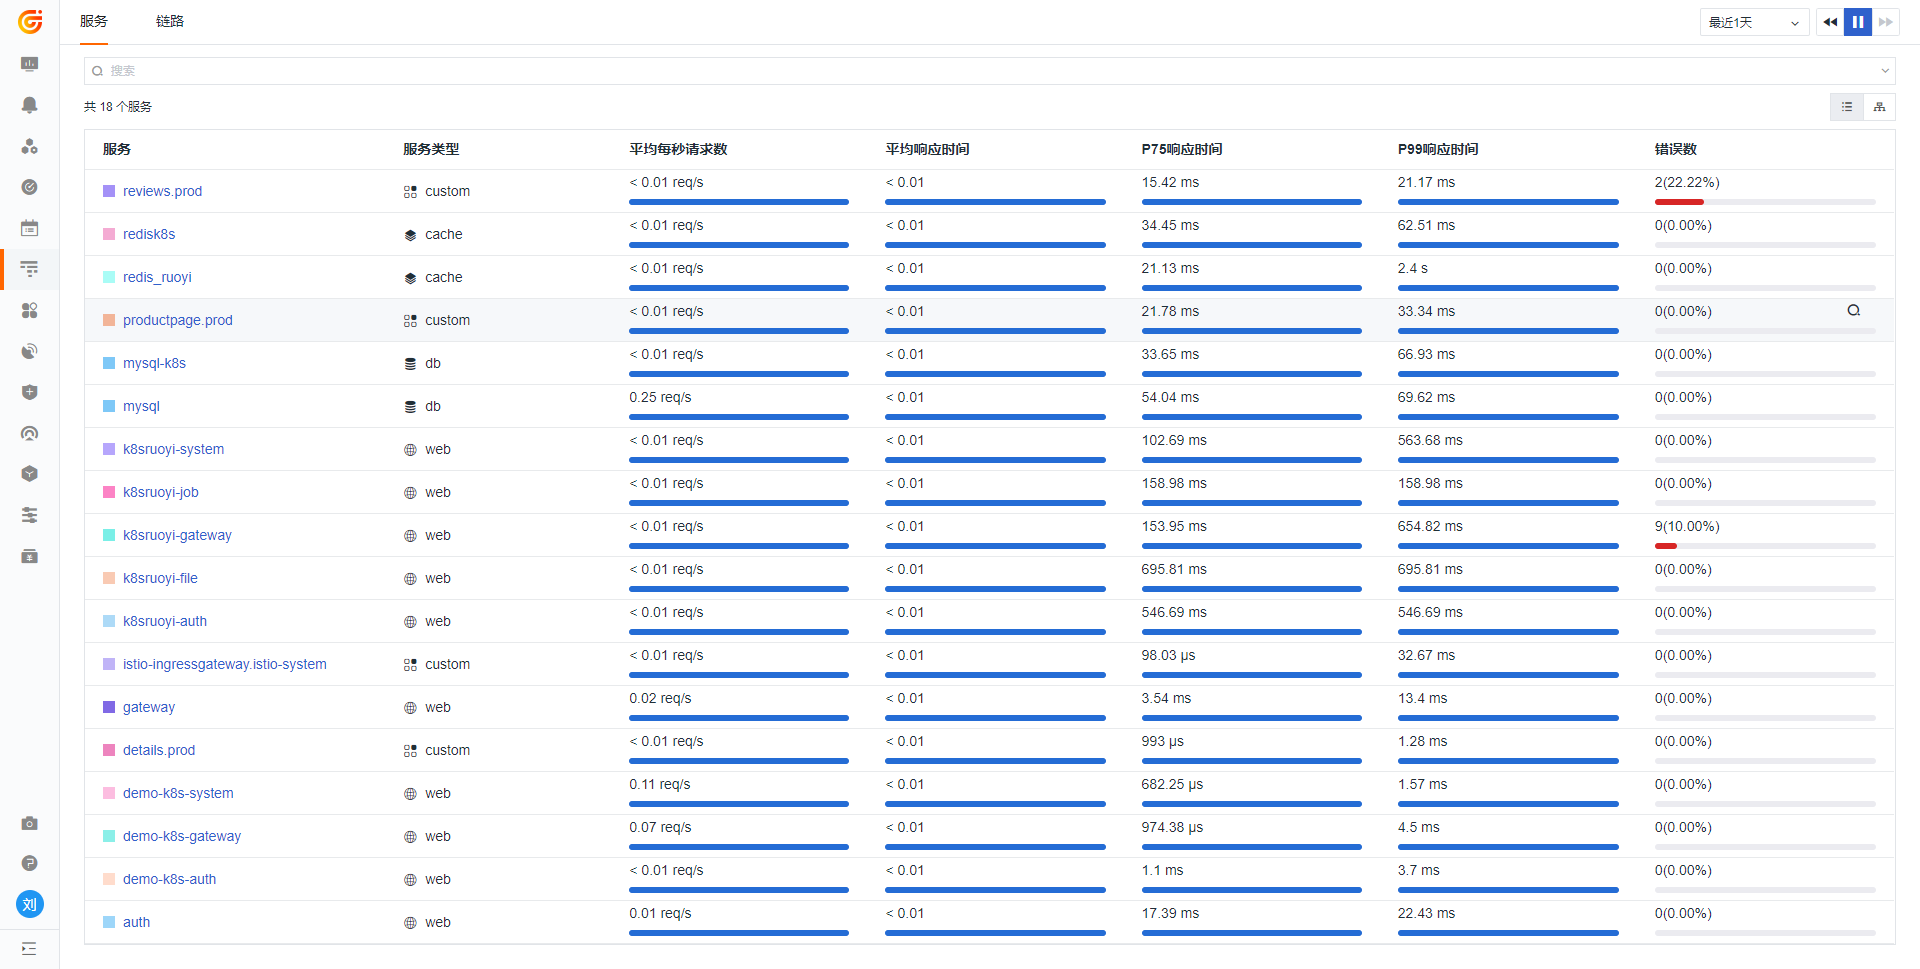
When you integrate more and more systems into Guance, the APM list is filled with all the APM services collected. Browsing through these services to find the ones you want can be overwhelming.
At this point, you might wonder if there is a view, similar to RUM, that can provide an overview of APM, allowing you to quickly check the status of each project: How many API calls were made in the current project? How many failed? What are the top 10 APIs with the highest latency? And so on.
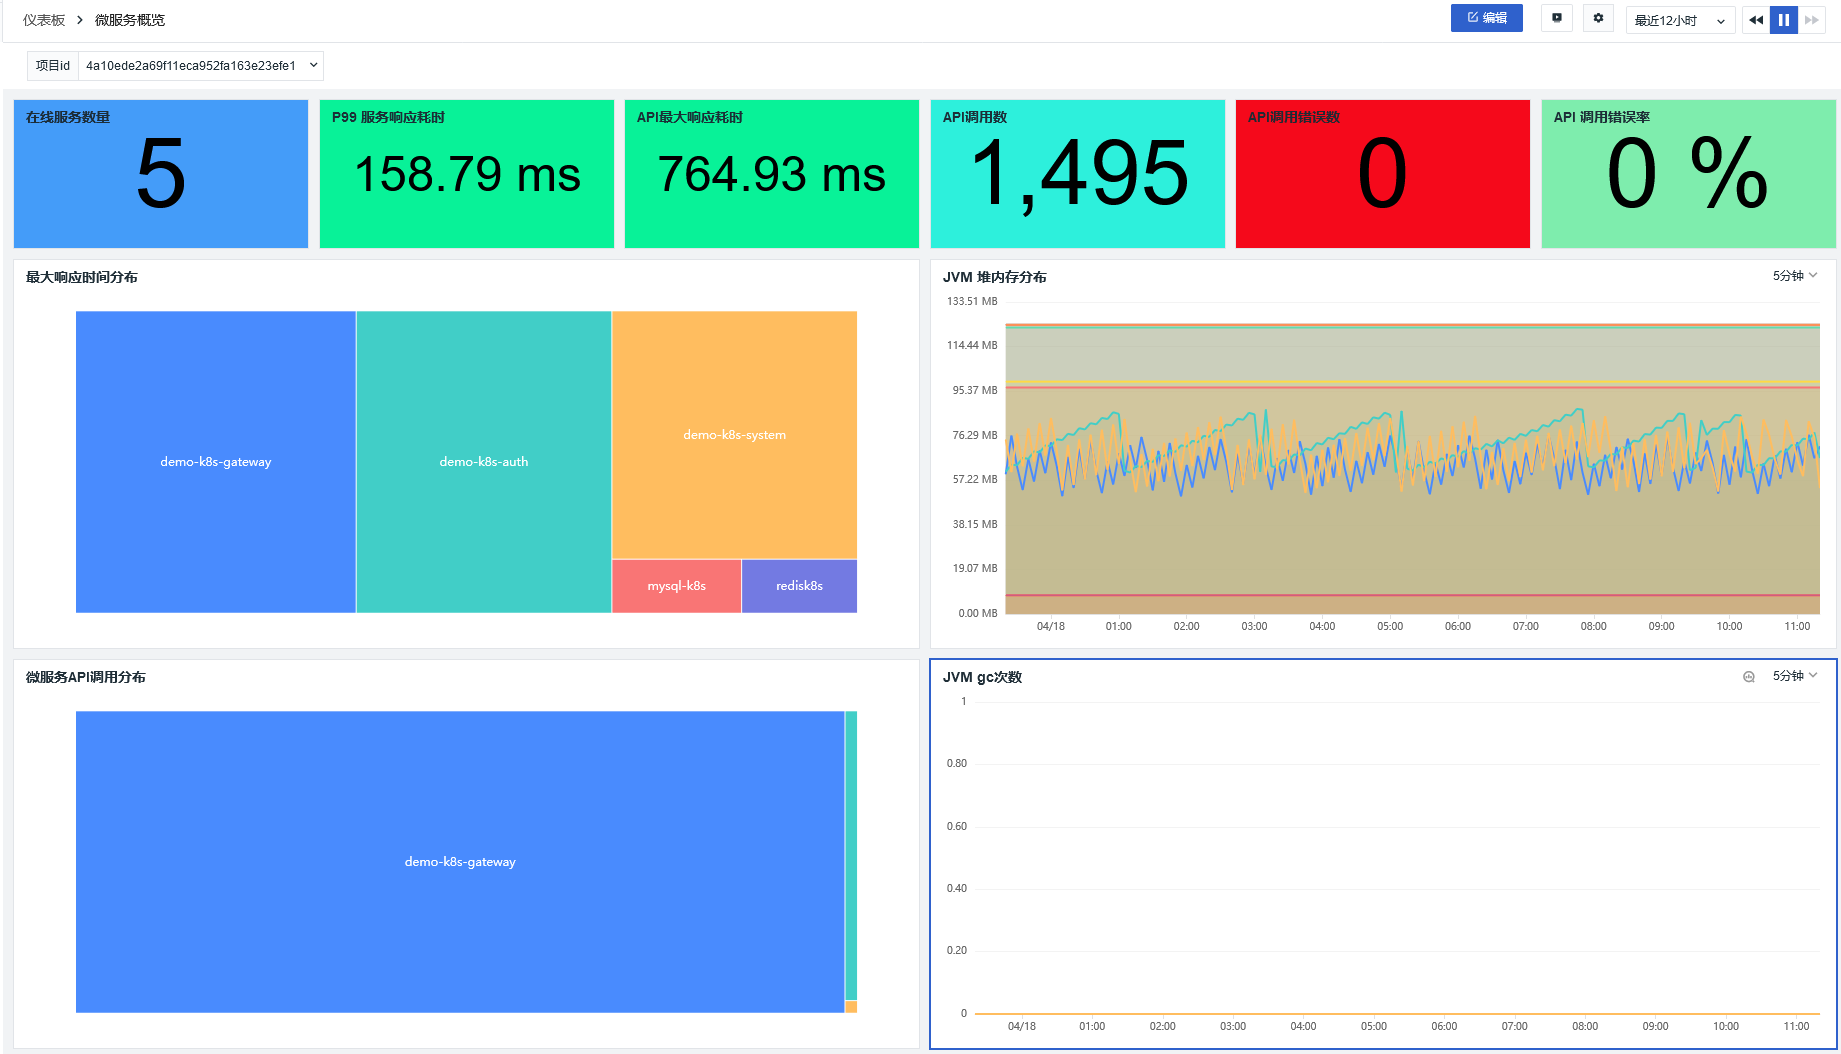
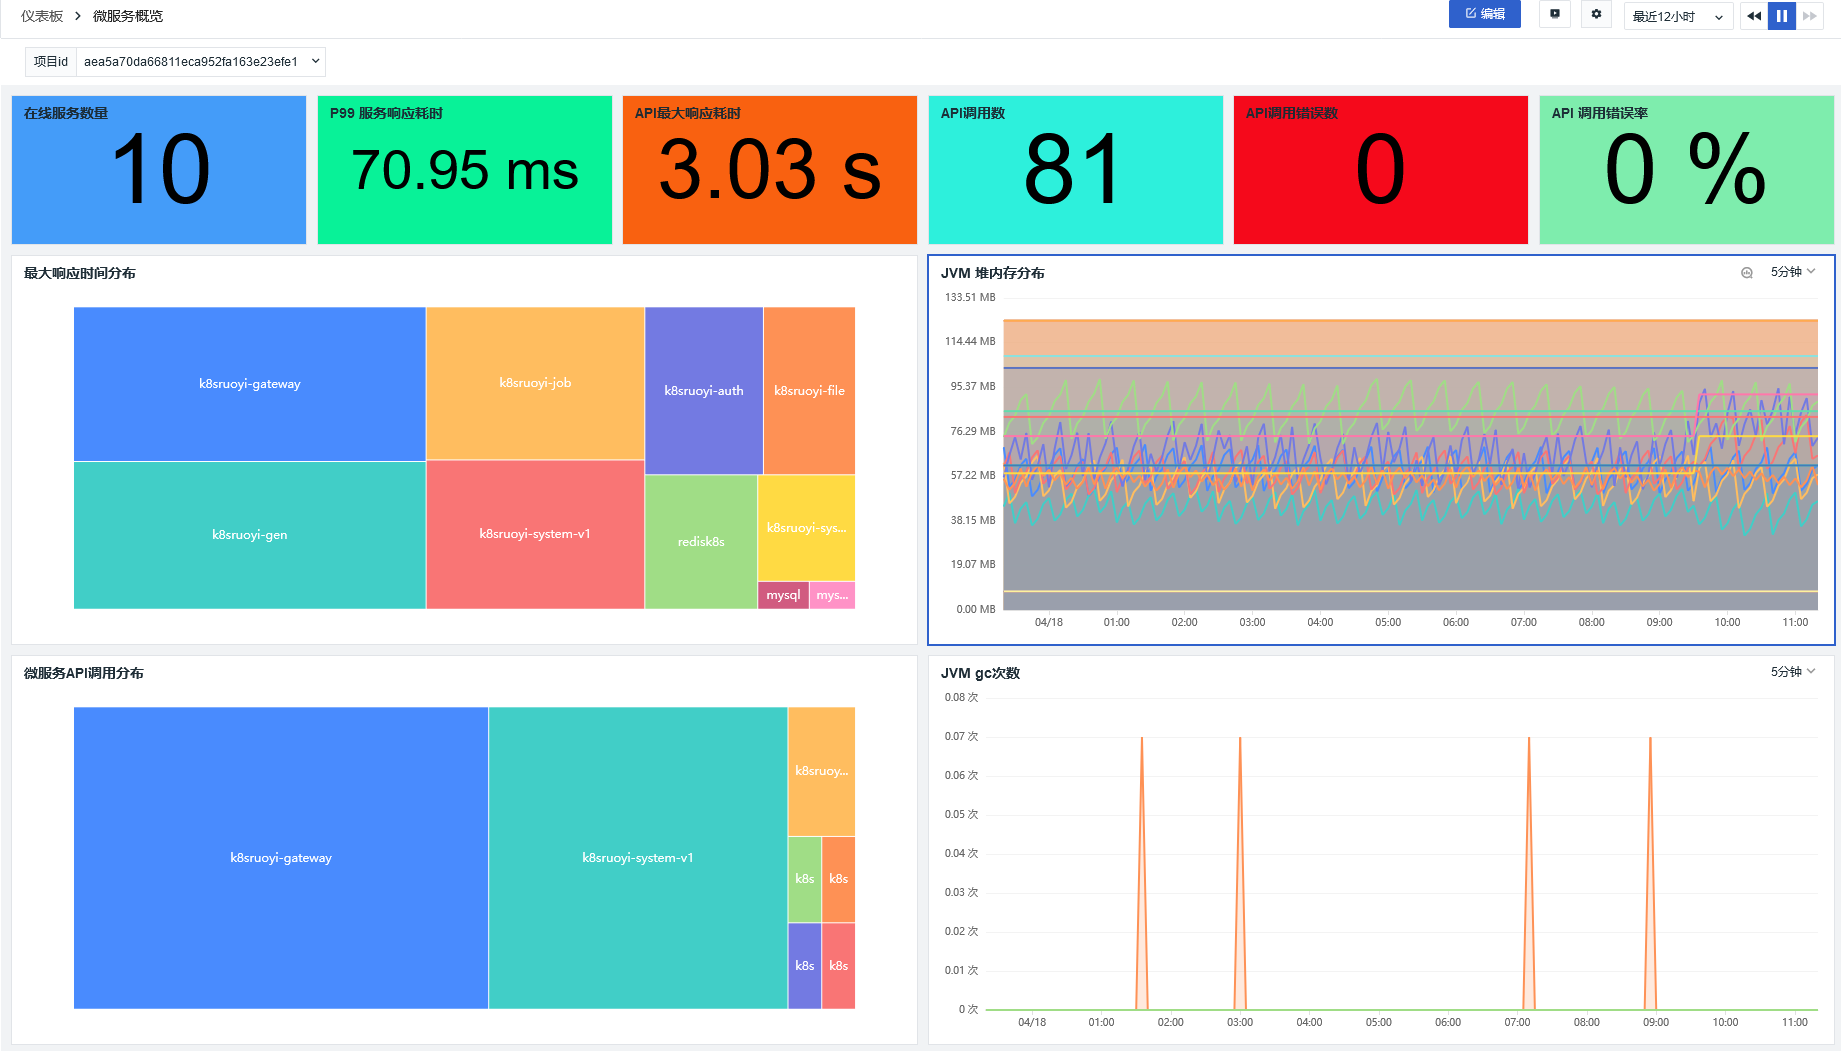
Guance has powerful extensibility for views, enabling you to build project-specific views according to your needs. Suppose you have two Java SpringCloud microservice projects, each with multiple microservices. Through Guance views, you can achieve the following effects for reference:
- Project A:
- Project B:
Prerequisites
-
You have already integrated APM of your applications into Guance
-
Your applications are deployed on K8s (the steps for non-K8s environments are essentially the same, except you don't modify YAML files)
-
You have multiple projects (e.g., Project A, Project B); a single project also supports this approach
-
APM is based on ddtrace
APM Trace Collection Optimization
To achieve the above view effects, you need to make minor adjustments to your application and DataKit configuration.
The idea to achieve the above views is:
-
Add a tag (span tag) when the application (microservice) starts, with the key
app_idand the value being a projectId (you can generate a 32-bit projectId using UUID). -
Prepare two
app_id, namely4a10ede2a69f11eca952fa163e23efe1(Project A) andaea5a70da66811eca952fa163e23efe1(Project B).
Optimize Microservice Application YAML
Assume your application is deployed on K8s.
- Partial configuration of the YAML for microservices related to Project A:
        - name: APP_ID
          value: "4a10ede2a69f11eca952fa163e23efe1"
        - name: JAVA_OPTS
          value: |-
            -javaagent:/usr/dd-java-agent/agent/dd-java-agent.jar -Ddd.service.name=demo-k8s-auth -Ddd.tags=container_host:$(POD_NAME),app_id:$(APP_ID) -Ddd.service.mapping=redis:redisk8s -Ddd.env=dev -Ddd.agent.port=9529
- Partial configuration of the YAML for microservices related to Project B:
        - name: APP_ID
          value: "aea5a70da66811eca952fa163e23efe1"
        - name: JAVA_OPTS
          value: |-
            -javaagent:/usr/dd-java-agent/agent/dd-java-agent.jar -Ddd.service.name=k8sruoyi-auth -Ddd.tags=container_host:$(POD_NAME),app_id:$(APP_ID) -Ddd.service.mapping=redis:redisk8s -Ddd.env=$(SPRING_BOOT_PROFILE) -Ddd.agent.port=9529
Optimize DataKit YAML
Add ddtrace.conf to ConfigMap
    ddtrace.conf: |-
        [[inputs.ddtrace]]
          endpoints = ["/v0.3/traces", "/v0.4/traces", "/v0.5/traces"]
          customer_tags = ["app_id"]
Here a customer_tags tag is defined, and you configure your tag here.
Also, you need to add a mountPath:
        - mountPath: /usr/local/datakit/conf.d/ddtrace/ddtrace.conf
          name: datakit-conf
          subPath: ddtrace.conf
Disable Traces Related to Nacos Registry
If your application uses a registry, such as Nacos, note that the registry has heartbeat detection. Each heartbeat generates a trace, and these traces waste resources when uploading data in production. If you want to ignore registry-related traces, you can do the following:
(You can skip this step if you don't mind.)
    ddtrace.conf: |-
        [[inputs.ddtrace]]
          endpoints = ["/v0.3/traces", "/v0.4/traces", "/v0.5/traces"]
          customer_tags = ["app_id"]
            [inputs.ddtrace.close_resource]
               "*" = ["PUT /nacos/*","GET /nacos/*","POST /nacos/*"]
Nacos registry heartbeat reporting mainly uses three URLs, which are filtered here using regular expressions:
,GET /nacos/v1/ns/instance/list,PUT /nacos/v1/ns/instance/beat,POST /nacos/v1/cs/configs/listener.
Restart DataKit and the applications. The optimization configuration is now complete. Go ahead and check the results.
More Documentation
<RUM-APM-LOG Correlation Analysis for Kubernetes Applications>