OpenTelemetry Observability
Problems to Solve When Building Observability
How to correlate the frontend and backend in distributed tracing?
How to associate logs and metrics with traces?
-
OpenTelemetry provides SDKs for different languages. The frontend trace is mainly implemented via
opentelemetry-js, while the backend has implementations in languages such as Java, Go, and Python. These languages uniformly report their trace information to the OpenTelemetry Collector (hereinafter referred to asotel-collector). -
Taking Java as an example, the OpenTelemetry Java agent (hereinafter referred to as "Agent") is injected into the application via
javaagent. After the application generates trace information, the traceId and spanId can be passed to the log as parameters by setting the Mapped Diagnostic Context (MDC). This way, the log output will carry the traceId and spanId.
The Mapped Diagnostic Context (MDC) is
a tool that distinguishes interleaved log output from different sources. — log4j MDC documentation
It contains thread-local context information that is later copied into every log event captured by the logging library.
The OTel Java Agent injects several pieces of information about the current span into the MDC copy of each log record:
trace_id- the current trace ID (same asSpan.current().getSpanContext().getTraceId());span_id- the current span ID (same asSpan.current().getSpanContext().getSpanId());trace_flags- the current trace flags, formatted according to the W3C trace flags format (same asSpan.current().getSpanContext().getTraceFlags().asHex()).
These three pieces of information can be included in the log statements generated by the logging library by specifying them in the pattern/format.
Tip: For Spring Boot configurations using Logback, you can add MDC to the log line by overriding only logging.pattern.level:
logging.pattern.level = trace_id=%mdc{trace_id} span_id=%mdc{span_id} trace_flags=%mdc{trace_flags} %5p
In this way, any service or tool that parses application logs can correlate traces/spans with log statements.
- OpenTelemetry also supports metric collection. Metrics are output to the corresponding exporter (e.g., Prometheus) via the OTel Collector, and then displayed through Grafana. The OTLP exporter supports metric output. The correlation between metrics, logs, and traces can be achieved through the
server.nametag.
OpenTelemetry's original intention is to unify the data format. This means that for a long time, OpenTelemetry does not intend to focus on observability products. Users still adopt OpenTelemetry as a data transit hub or use its data standard to constrain their own observability products.
Building End-to-End Full-Link Observability with OpenTelemetry
The following introduces three approaches to building end-to-end full-link observability based on OpenTelemetry:
1. Traditional Monitoring with a Large Collection
This approach primarily uses the OTel Collector to push logs, metrics, and traces to ELK, Prometheus, and APM vendors (e.g., Jaeger).
2. Based on the Grafana Ecosystem
In recent years, Grafana has also entered the observability field, establishing Grafana Cloud and Grafana Labs, and has launched its own set of solutions. Grafana Tempo is an open-source, easy-to-use, and large-scale distributed tracing backend. Tempo is cost-effective, requires only object storage to run, and deeply integrates with Grafana, Prometheus, and Loki. Tempo works with any open-source tracing protocol, including Jaeger, Zipkin, and OpenTelemetry, so it can directly receive trace data from OpenTelemetry. Loki is used to collect log data from OpenTelemetry, and Grafana still uses Prometheus to receive metric data.
Although the above two solutions solve the data format problem, in a sense they can only be called technologies, not products. They are essentially a patchwork of open-source tools. When encountering business issues, you still need to access different tools to view and analyze problems. Logs, metrics, and traces are not well integrated, which does not reduce the operational and communication costs for Ops and developers. A unified data analysis platform based on logs, metrics, and traces becomes particularly important. Grafana is also continuously working towards this goal, but it has not fully solved the data silo problem. Different data structures still use different query languages. Grafana currently implements correlation from log data to trace data, but trace data cannot be correlated back to log data. The Grafana team still needs to work on cross-correlation query and analysis between data.
3. Based on Guance - A Commercial Observability Product
Guance is a unified data collection and management platform that integrates metric data, log data, APM, RUM, infrastructure, containers, middleware, network performance, and more. Using Guance provides comprehensive application observability, not just observability between logs and traces.
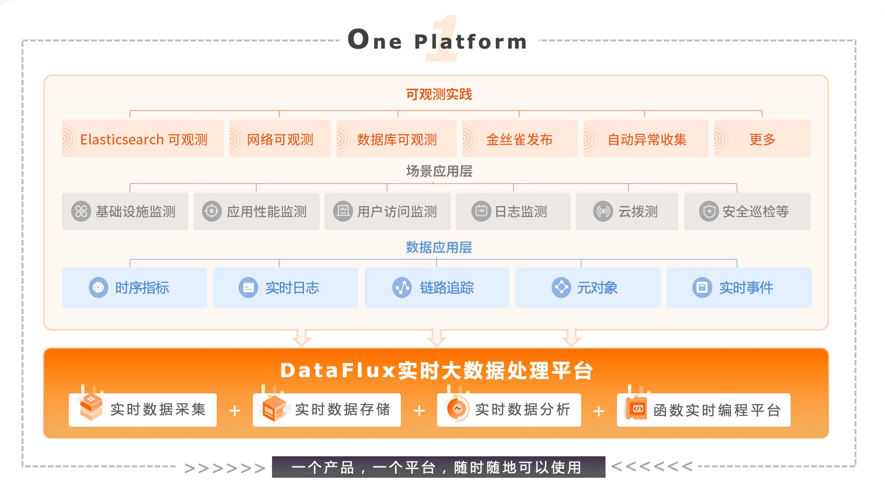
DataKit is the upstream gateway of Guance. To send data to Guance, you need to configure DataKit correctly. Using DataKit offers the following advantages:
- In a host environment, each host has a DataKit. Data is first sent to the local DataKit, which caches, preprocesses, and then reports it. This avoids network jitter and provides edge processing capabilities, relieving pressure on the backend data processing.
- In a Kubernetes environment, each node has a DataKit DaemonSet. By leveraging Kubernetes' local traffic mechanism, data from pods on each node is first sent to the local node's DataKit. This avoids network jitter and adds pod and node labels to APM data, facilitating location in distributed environments.
DataKit's design philosophy is also inspired by OpenTelemetry. It is compatible with the OTLP protocol, so data can be sent directly to DataKit without going through the Collector. You can also set the Collector's exporter to OTLP (DataKit).
Comparison of Solutions
| Scenario | Open-Source Self-Built Products | Using Guance |
|---|---|---|
| Building a Cloud-Native Monitoring System | Requires a professional technical team to invest at least 3 months, and that's just the beginning. | 30 minutes out-of-the-box |
| Related Costs | Hardware investment for a simple open-source monitoring product starts at more than 20,000 CNY/year. For a cloud-native observability platform, the fixed investment is at least 100,000 CNY/year (estimated based on cloud hardware). | Pay-as-you-go. Costs are flexible based on actual business needs. Overall cost is more than 50% lower than the comprehensive investment of using open-source products. |
| System Maintenance | Requires dedicated technical engineers for long-term attention and investment. Using multiple open-source products together increases management complexity. | No need to worry; focus on business issues. |
| Number of Agents to Install on Servers | Each open-source software requires its own agent; server performance is heavily occupied by these agents. | One agent, running purely in binary, with extremely low CPU and memory usage. |
| Value Delivered | Depends solely on the company's own engineers' ability to delve into open-source products. | A comprehensive data platform for full observability, enabling engineers to solve problems using data. |
| Root Cause Analysis for Performance and Failures | Relies solely on the team's own capabilities. | Quick location based on data analysis. |
| Security | A mix of various open-source software tests the comprehensive ability of technical engineers. | Comprehensive security scanning and testing. Client-side code is open-sourced to users, and products are iteratively updated to ensure security. |
| Scalability and Service | Requires building your own SRE engineering team. | Provides professional services, equivalent to having an external SRE support team. |
| Training and Support | Hire external trainers. | Long-term online training and support. |