Correlated Analysis of RUM, APM, and LOG for Java Applications
Use Cases
The most important revenue source for an enterprise is its business, and nowadays, the business of most enterprises is supported by their corresponding IT systems. Therefore, how to ensure the stability of the enterprise's business ultimately comes down to how to ensure the enterprise's IT systems internally. When a business system experiences anomalies or failures, it often requires coordination among colleagues from business, application development, operations, and other departments to troubleshoot the problem. This involves cross-platform, cross-department, and cross-domain issues, making the troubleshooting both time-consuming and labor-intensive.
To solve this problem, a relatively mature approach in the industry is to perform deep monitoring at the application and log layers in addition to infrastructure monitoring. By using RUM + APM + LOG, unified management of the most critical frontend/backend applications and logs of the entire business system is achieved. More capable monitoring solutions can also correlate these three types of data through key fields, enabling correlated analysis and thereby improving the efficiency of relevant personnel and ensuring stable system operation.
- APM: Application Performance Monitoring
- RUM: Real User Monitoring
- LOG: Logging
Currently, Guance already has this capability. This article uses the RuoYi office system as a demo, and explains how to integrate RUM, APM, and LOG monitoring, as well as how to use Guance for correlated analysis.
Installing DataKit
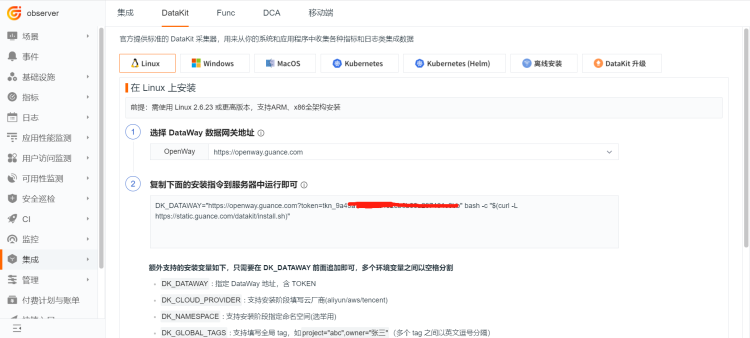
1. Copy the Installation Command
Register and log in to Guance, select Integrations → DataKit, choose the installation command suitable for your environment, and copy it.
2. Install DataKit on the Server

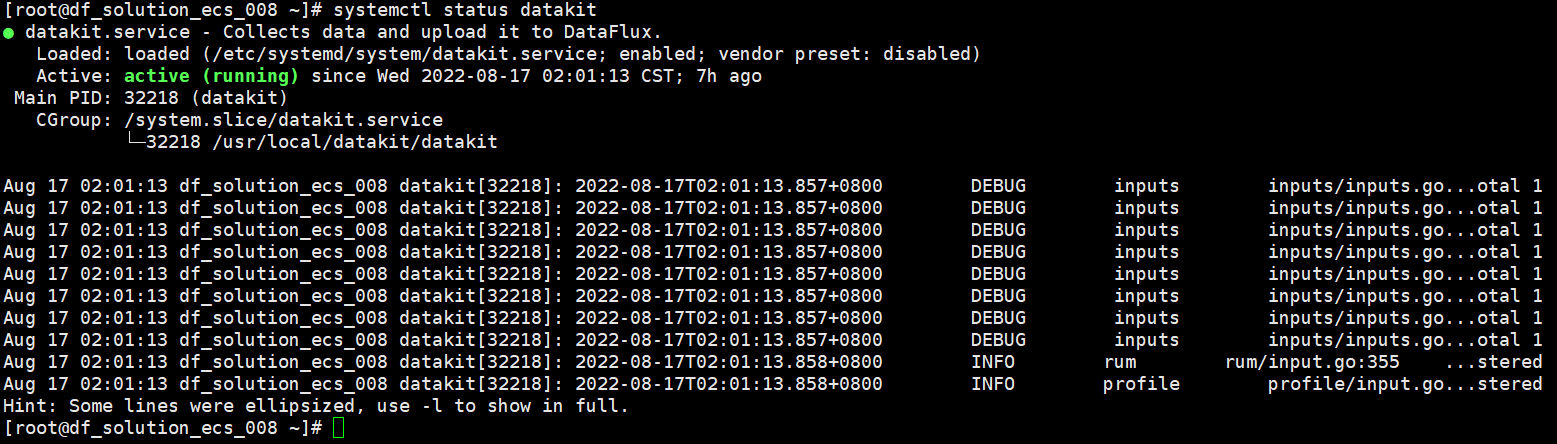
3. Check DataKit Status
Run the command systemctl status datakit.
4. View Data
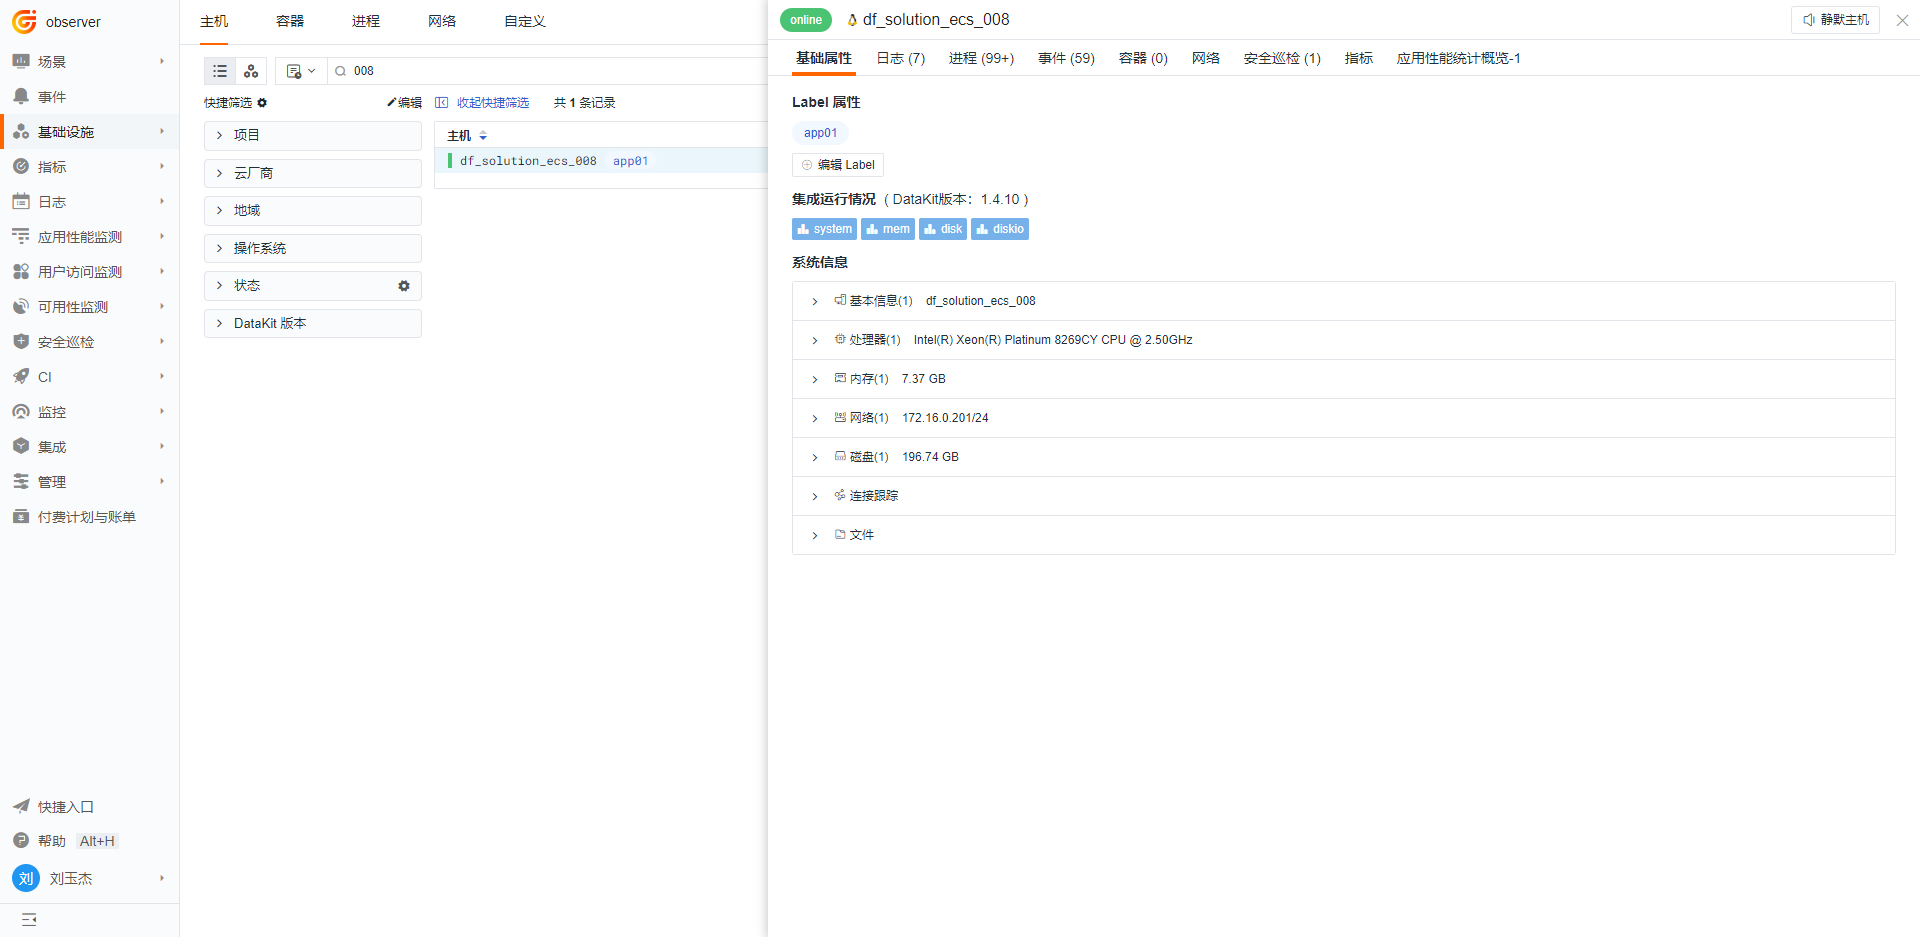
After DataKit is installed, it collects the following items by default. You can view the related data directly in Guance → Infrastructure → Hosts.
| Collector Name | Description |
|---|---|
| cpu | Collects host CPU usage |
| disk | Collects disk usage |
| diskio | Collects host disk I/O |
| mem | Collects host memory usage |
| swap | Collects swap memory usage |
| system | Collects host OS load |
| net | Collects host network traffic |
| host_process | Collects the list of persistent processes on the host (alive for more than 10 minutes) |
| hostobject | Collects basic host information (e.g., OS info, hardware info) |
| docker | Collects possible container objects and container logs on the host |
Select different integration inputs names to view the corresponding monitoring views. Below the monitoring views, you can also view other data, such as logs, processes, and containers.
Real User Monitoring (RUM)
For detailed steps, refer to the document Web Application Monitoring (RUM) Best Practices.
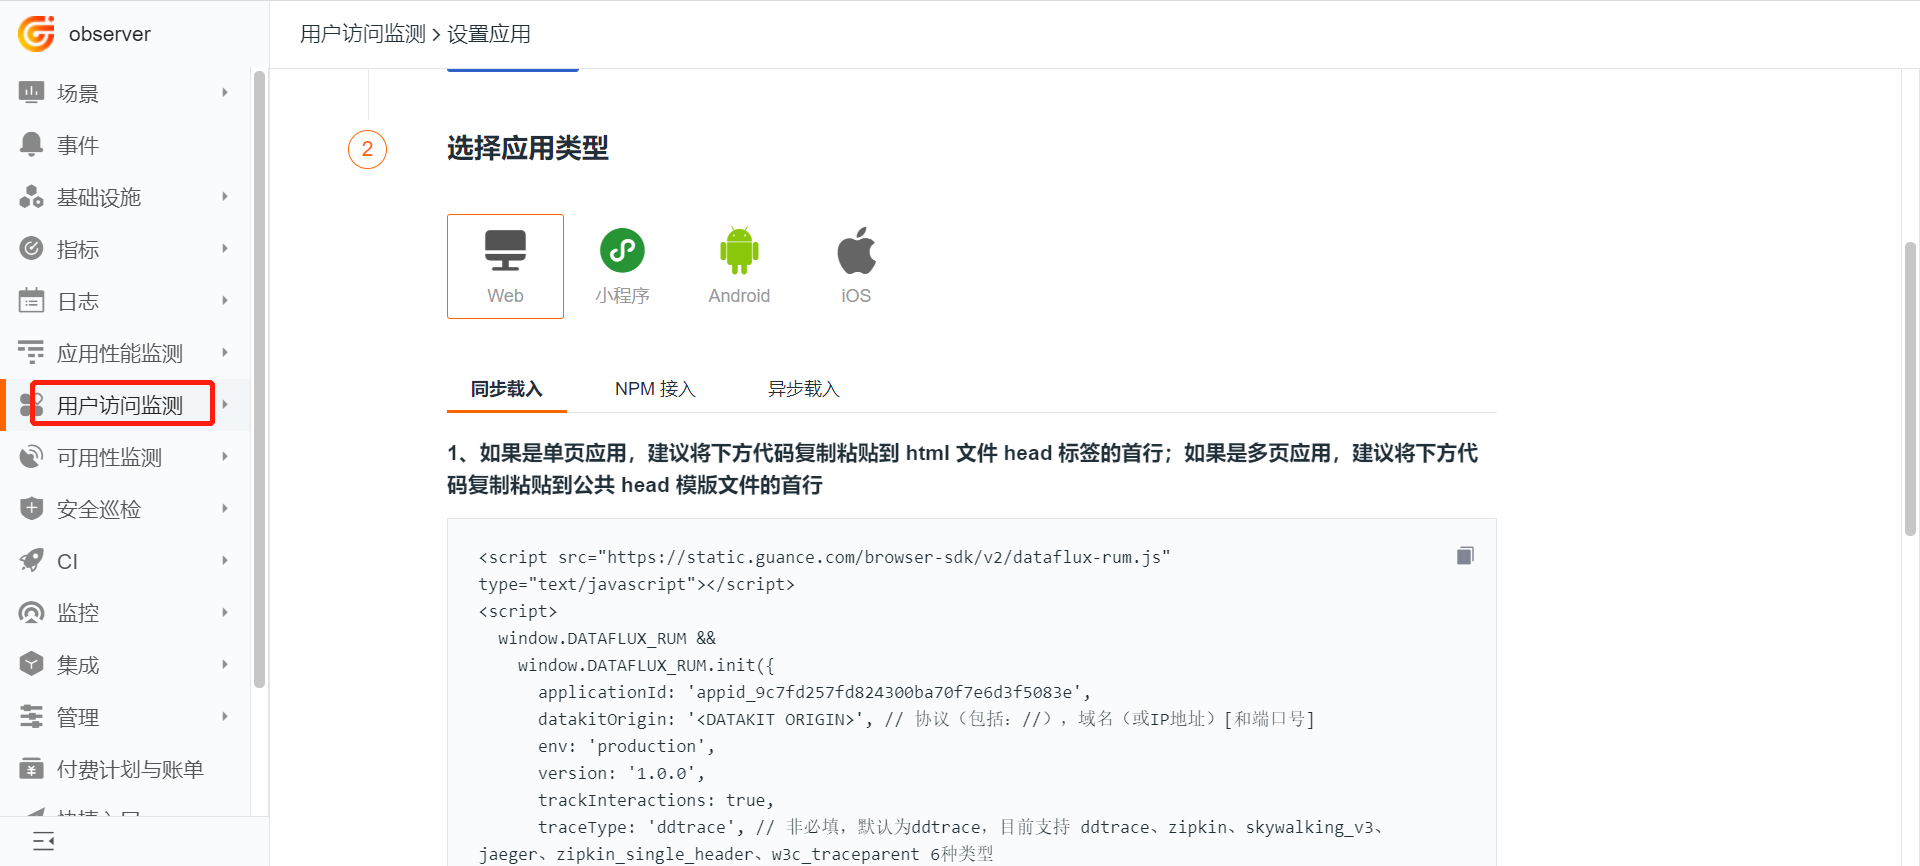
1. Copy the JavaScript Code
Log in to Guance, select Real User Monitoring → Create Application → Web → Loading Type → Synchronous Loading.
2. Embed the JavaScript Code
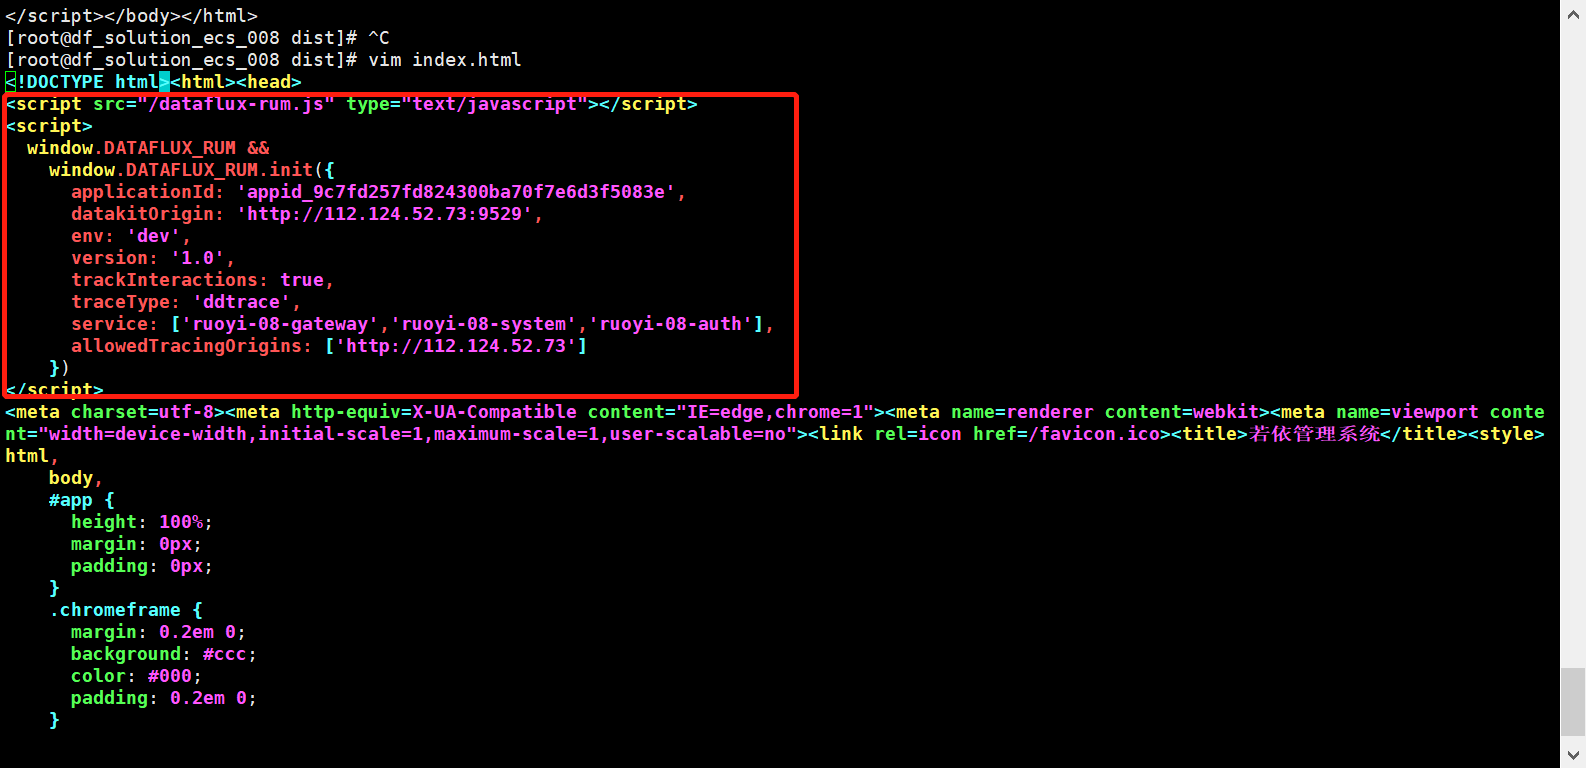
Paste the JavaScript code in the <head> section of the frontend page /usr/local/ruoyi/dist/index.html.
<script src="https://static.guance.com/browser-sdk/v2/dataflux-rum.js" type="text/javascript"></script>
<script>
  window.DATAFLUX_RUM &&
    window.DATAFLUX_RUM.init({
      applicationId: 'appid_9c7fd257fd824300ba70f7e6d3f5083e',
      datakitOrigin: 'http://112.124.52.73:9529',
      env: 'dev',
      version: '1.0',
      trackInteractions: true,
      traceType: 'ddtrace',
      allowedTracingOrigins: ['http://112.124.52.73']
    })
</script>
Parameter Description
- datakitOrigin: The data transfer address. In a production environment, if a domain name is configured, you can forward requests from the domain to any server running a DataKit instance with port 9529. If the frontend has a high volume of requests, you can add an SLB (Server Load Balancer) between the domain and the DataKit servers. The frontend JS sends data to the SLB, which then forwards requests to multiple servers running DataKit on port 9529. Multiple DataKit instances can handle RUM data; because frontend requests are multiplexed, session data is not interrupted and RUM data display is not affected.
- allowedTracingOrigins: Enables correlation between frontend (RUM) and backend (APM). This only works when RUM is deployed on the frontend and APM is deployed on the backend. You must enter the domain name (production) or IP (test) of the backend application server that interacts with the frontend page. Use Case: If a slow frontend user visit is caused by an abnormal backend code logic, you can directly jump from the frontend RUM slow request data to the APM data to view the corresponding backend code call and determine the root cause of the slowness. How It Works: When a user visits the frontend application, the frontend application makes resource and request calls, triggering RUM-js performance data collection. RUM-js generates a
trace-idand writes it in the request header. When the request reaches the backend, the backend ddtrace reads thetrace_idand records it in its own trace data. This enables correlation between Application Performance Monitoring (APM) and Real User Monitoring (RUM) data through the sametrace_id. - env: Required. The environment the application belongs to, e.g.,
test,product, or other values. - version: Required. The version number of the application.
- trackInteractions: Tracks user interactions, such as button clicks and form submissions.
3. Publish
Save, verify, and publish the page.
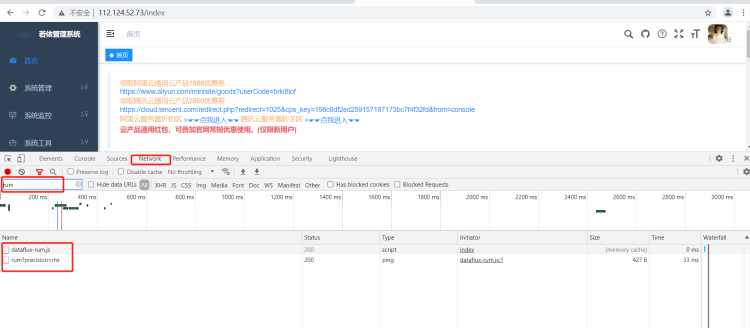
Open the browser and visit the target page. Use the F12 developer tools to check the network requests. Look for requests related to rum and verify that the status code is 200.
Warning
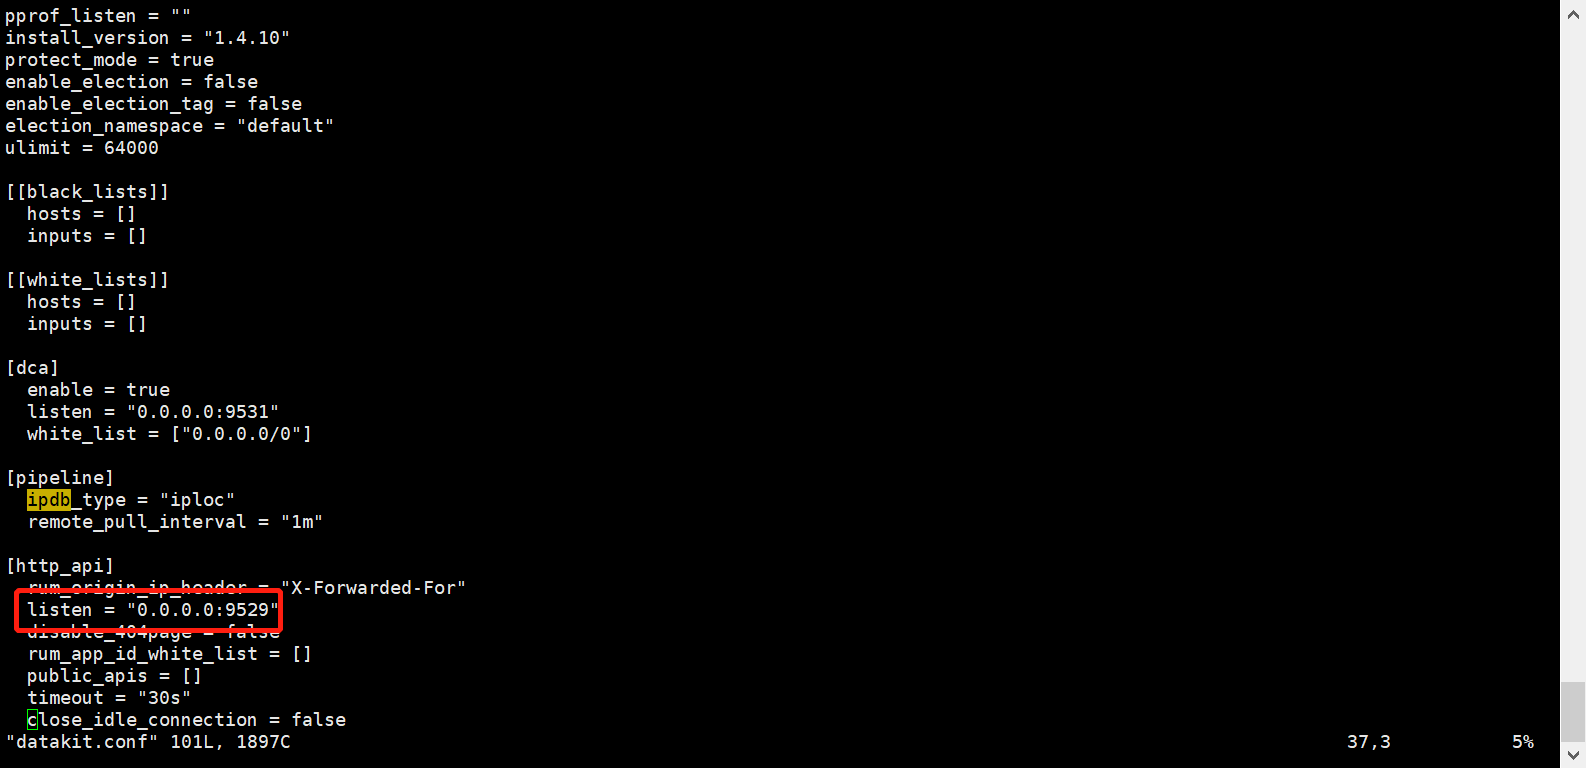
If the developer tools show that data cannot be reported and the port is refused, run telnet IP:9529 to verify if the port is open.
If the port is not open, modify /usr/local/datakit/conf.d/datakit.conf and change the first line http_listen to 0.0.0.0.
If the port is still not open, check if the security group has opened port 9529.
4. View RUM Data
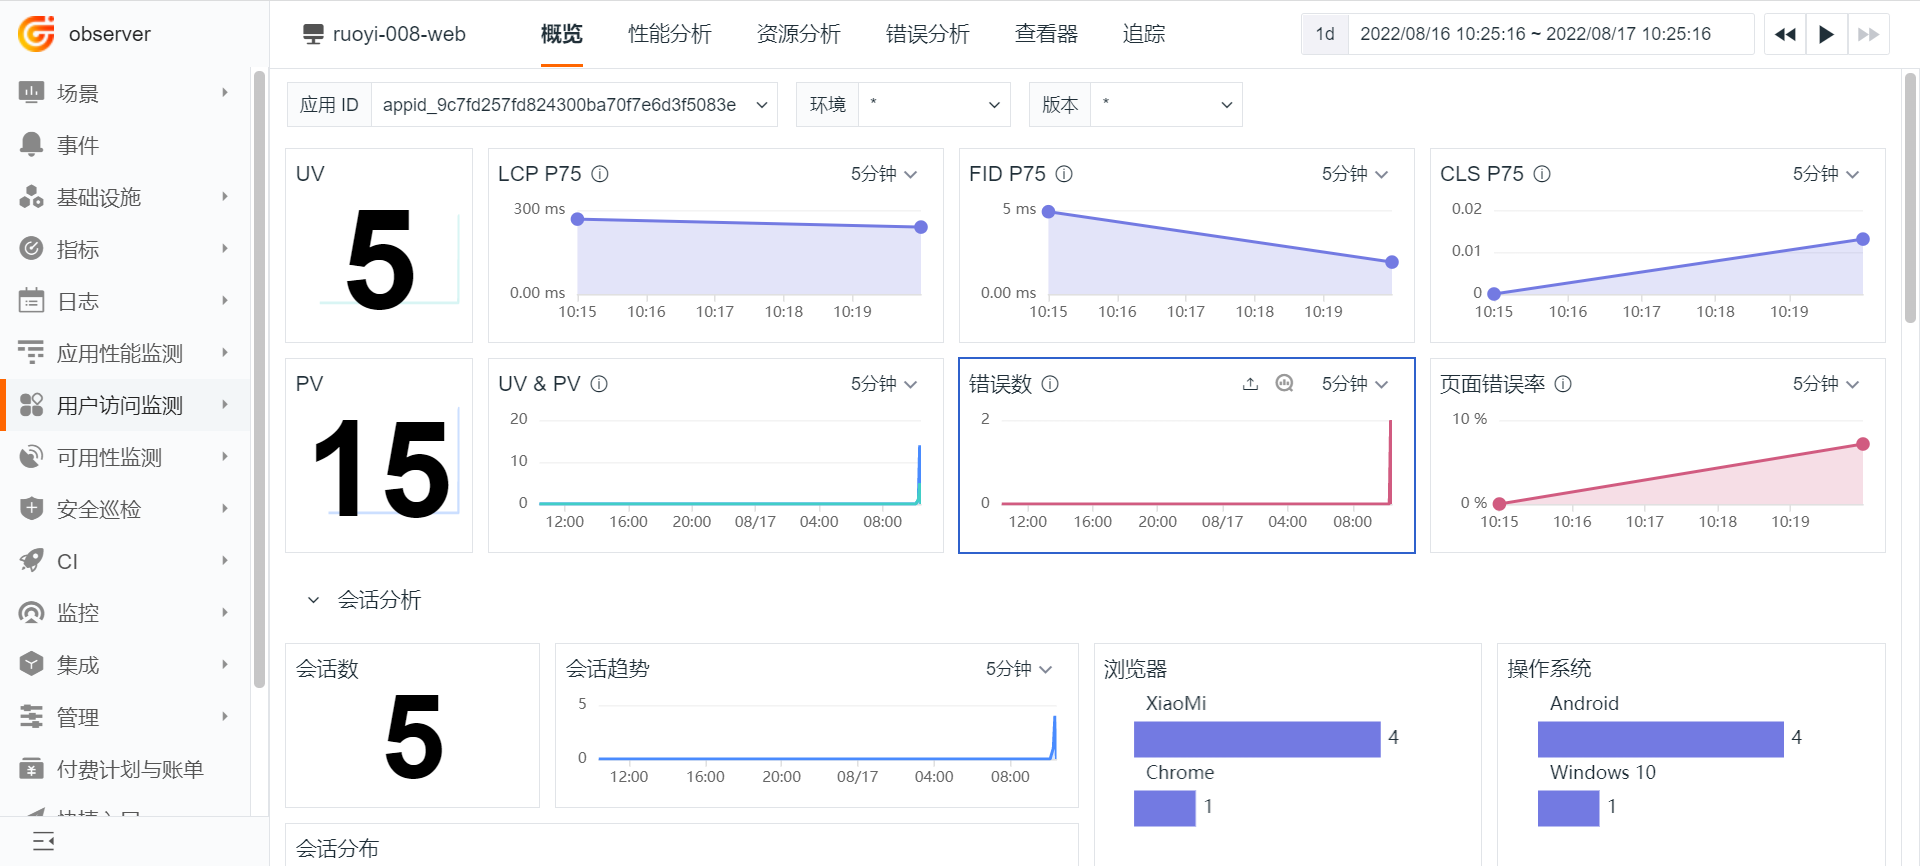
You can view RUM-related data in Real User Monitoring.
Application Performance Monitoring (APM)
For detailed steps, refer to the document Distributed Tracing (APM) Best Practices.
Guance supports APM integration methods including ddtrace, SkyWalking, Zipkin, Jaeger, and other APM tools that support the OpenTracing protocol. This example uses ddtrace to implement APM observability.
1. Modify the Input Configuration
Modify the APM (ddtrace) input configuration in DataKit.
By default, you do not need to modify the JVM input configuration. Simply copy the configuration file.
$ cd /usr/local/datakit/conf.d/ddtrace/
$ cp ddtrace.conf.sample ddtrace.conf
$ vim ddtrace.conf

# No modification is needed by default.
2. Modify the Java Application Startup Script
To achieve APM observability, you need to add an agent to the Java application. When the application starts, this agent uses bytecode injection to collect performance data about internal method calls, SQL calls, and external system calls, thereby providing observability into the application's code quality.
# Original application startup script
$ cd /usr/local/ruoyi/
$ nohup java -Dfile.encoding=utf-8   -jar ruoyi-gateway.jar > logs/gateway.log  2>&1 &
$ nohup java -Dfile.encoding=utf-8   -jar ruoyi-auth.jar > logs/auth.log  2>&1 &
$ nohup java -Dfile.encoding=utf-8   -jar ruoyi-modules-system.jar > logs/system.log  2>&1 &

——————————————————————————————————————————————————————————————————————————————————————————

# Application startup script after adding the ddtrace agent
$ cd /usr/local/ruoyi/

$ nohup java -Dfile.encoding=utf-8 -javaagent:dd-java-agent-0.80.0.jar -XX:FlightRecorderOptions=stackdepth=256 -Ddd.logs.injection=true -Ddd.service.name=ruoyi-gateway -Ddd.service.mapping=redis:redis_ruoyi -Ddd.agent.port=9529 -Ddd.jmxfetch.enabled=true -Ddd.jmxfetch.check-period=1000  -Ddd.jmxfetch.statsd.port=8125 -Ddd.version=1.0 -jar ruoyi-gateway.jar > logs/gateway.log  2>&1 &

$ nohup java -Dfile.encoding=utf-8 -javaagent:dd-java-agent-0.80.0.jar  -XX:FlightRecorderOptions=stackdepth=256 -Ddd.logs.injection=true -Ddd.service.name=ruoyi-auth -Ddd.service.mapping=redis:redis_ruoyi -Ddd.env=staging -Ddd.agent.port=9529 -Ddd.jmxfetch.enabled=true -Ddd.jmxfetch.check-period=1000 -Ddd.jmxfetch.statsd.port=8125 -Ddd.version=1.0 -jar ruoyi-auth.jar > logs/auth.log  2>&1 &

$ nohup java -Dfile.encoding=utf-8 -javaagent:dd-java-agent-0.80.0.jar -XX:FlightRecorderOptions=stackdepth=256 -Ddd.logs.injection=true -Ddd.service.name=ruoyi-modules-system -Ddd.service.mapping=redis:redis_ruoyi,mysql:mysql_ruoyi -Ddd.env=dev -Ddd.agent.port=9529 -Ddd.jmxfetch.enabled=true -Ddd.jmxfetch.check-period=1000 -Ddd.jmxfetch.statsd.port=8125 -Ddd.version=1.0 -jar ruoyi-modules-system.jar > logs/system.log  2>&1 &
Description of ddtrace-related environment variables (startup parameters):
Ddd.env: Custom environment type, optional.Ddd.tags: Custom application tags, optional.Ddd.service.name: Custom application name, required.Ddd.agent.port: Data upload port (default is 9529), required.Ddd.version: Application version, optional.Ddd.trace.sample.rate: Sets the sampling rate (default is full sampling). Optional. If you want to sample, set a value between 0 and 1, e.g., 0.6 means 60% sampling.Ddd.service.mapping: Use this parameter to add aliases for Redis, MySQL, etc. called by the current application, to distinguish them from those called by other applications. Optional. Use case: For example, project A and project B both call MySQL, but they call different instances (mysql-a and mysql-b). If you do not add the mapping configuration, the Guance platform will show that both projects call a database namedmysql. If you add the mapping configuration (e.g.,mysql:mysql_aandmysql:mysql_b), the platform will show that project A callsmysql-aand project B callsmysql-b.Ddd.agent.host: Data transfer target IP. Default is localhost. Optional.
3. View APM Data
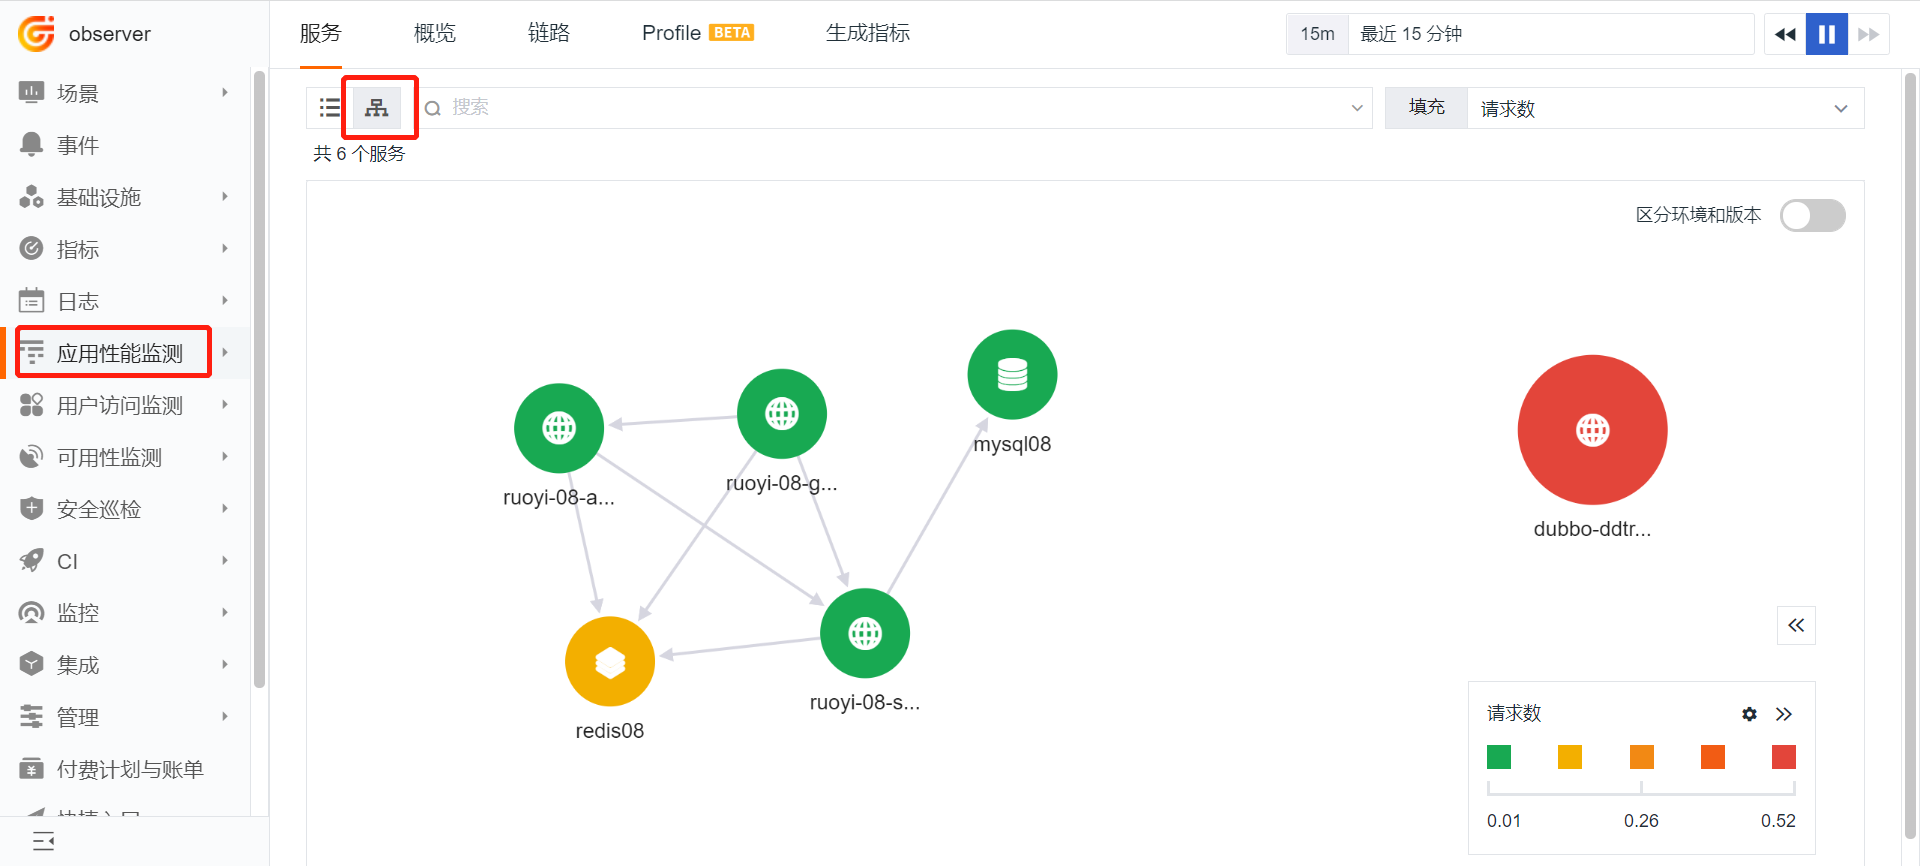
APM is a built-in module of Guance and can be viewed without creating a scenario or view.
View Example:
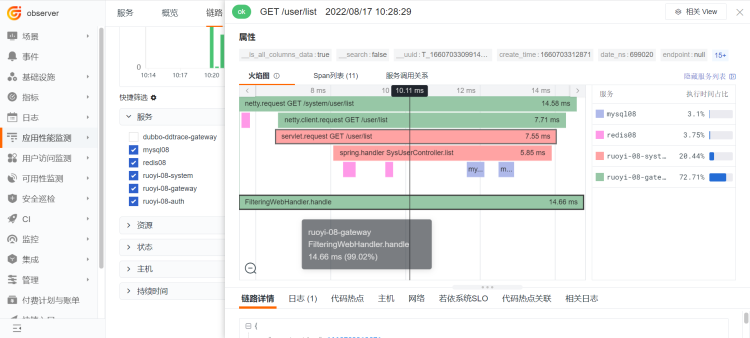
From this view, you can quickly view application call status, topology maps, anomaly data, and other APM-related data.
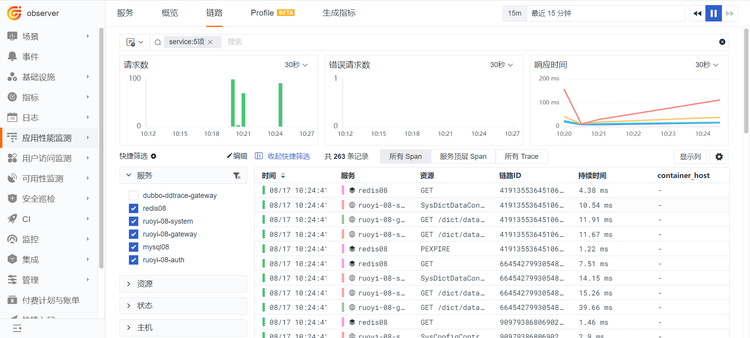
Trace problem diagnosis:
You can troubleshoot interfaces, databases, and other issues.
LOG
1. Standard Log Collection
For example: Nginx, MySQL, Redis, etc.
By enabling the built-in inputs of DataKit, you can directly start log collection for related services, such as Nginx, Redis, Containers, Elasticsearch, etc.
Example: Nginx
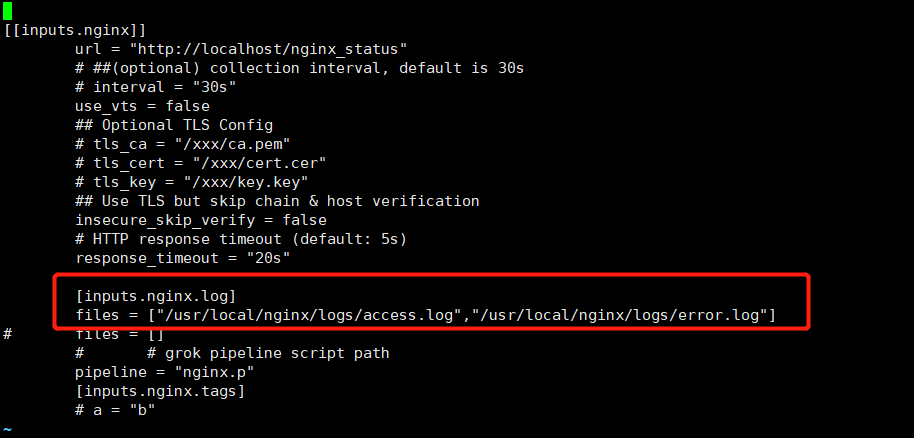
$ cd /usr/local/datakit/conf.d/nginx/
$ cp nginx.conf.sample nginx.conf
$ vim nginx.conf

## Modify the log path to the correct Nginx path
$ [inputs.nginx.log]
$     files = ["/usr/local/nginx/logs/access.log","/usr/local/nginx/logs/error.log"]
$     pipeline = "nginx.p"

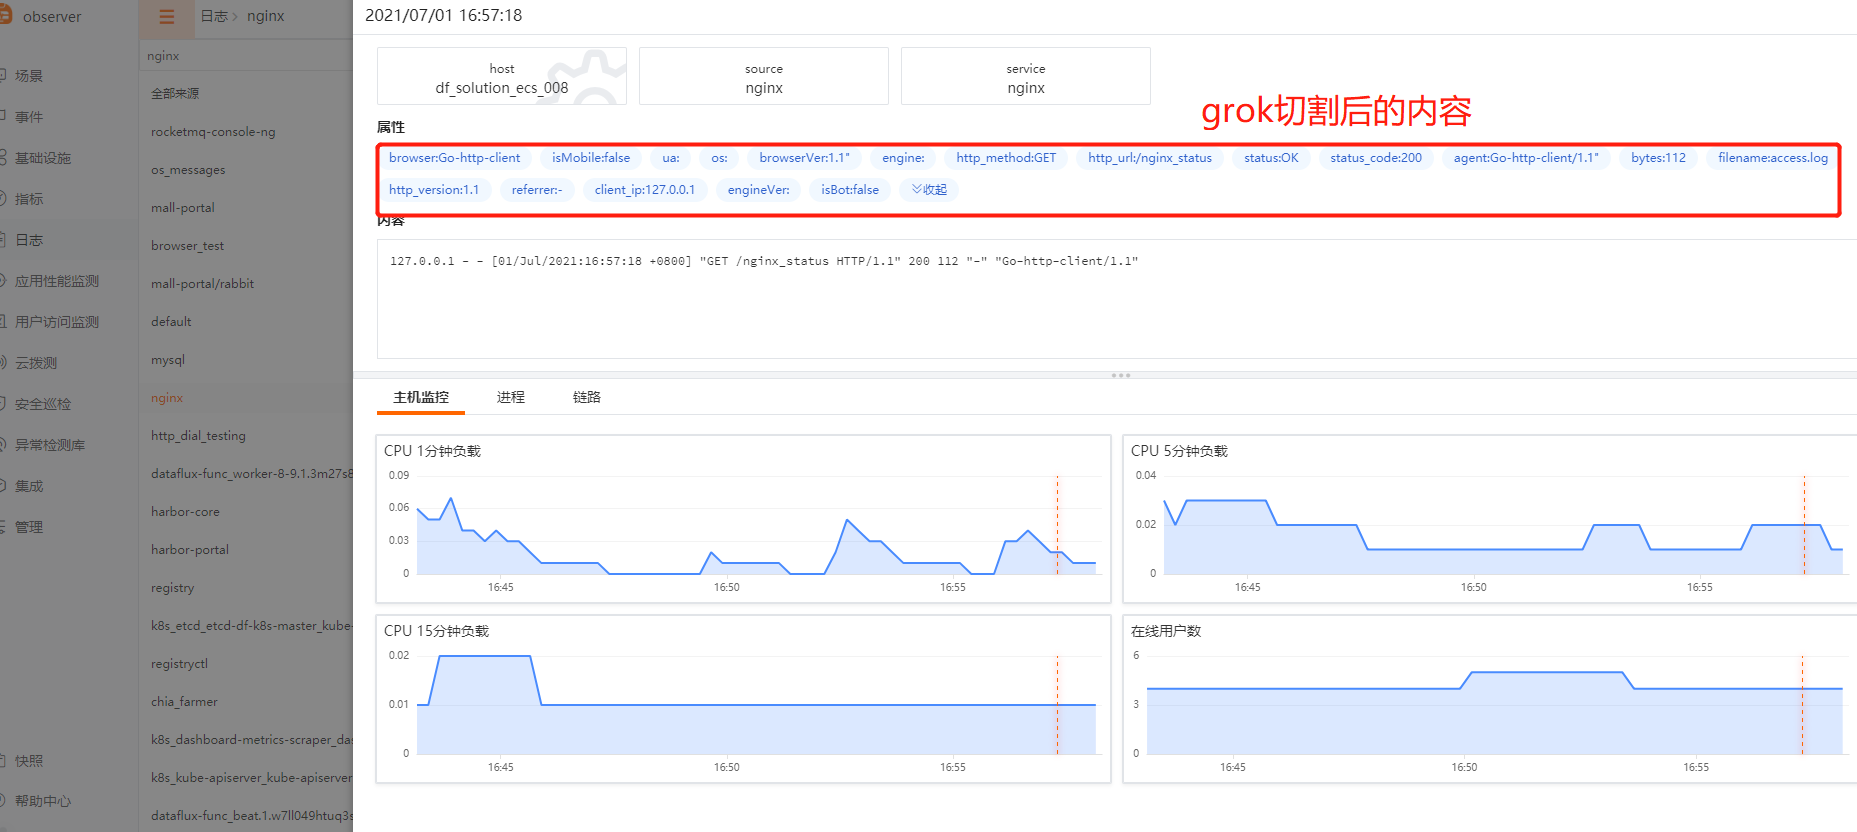
## The pipeline is the Grok statement used to parse log text. DataKit has built-in pipelines for various services, including Nginx, MySQL, etc. The default pipeline directory is /usr/local/datakit/pipeline/. You do not need to modify the pipeline path here; DataKit automatically reads it.
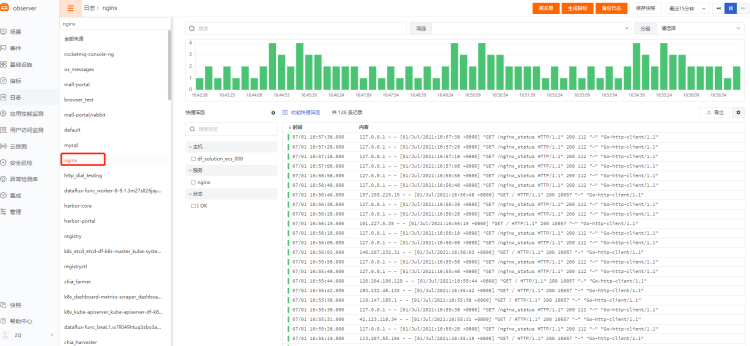
View Display:
2. Custom Log Collection
For example: application logs, business logs, etc.
Example: Application Logs
Pipeline (Grok log parsing) Official Documentation
$ cd /usr/local/datakit/conf.d/log/
$ cp logging.conf.sample system-logging.conf
$ vim system-logging.conf

## Modify the log path to the correct application log path.
## `source` and `service` are required fields. You can use the application name directly to distinguish different log names.

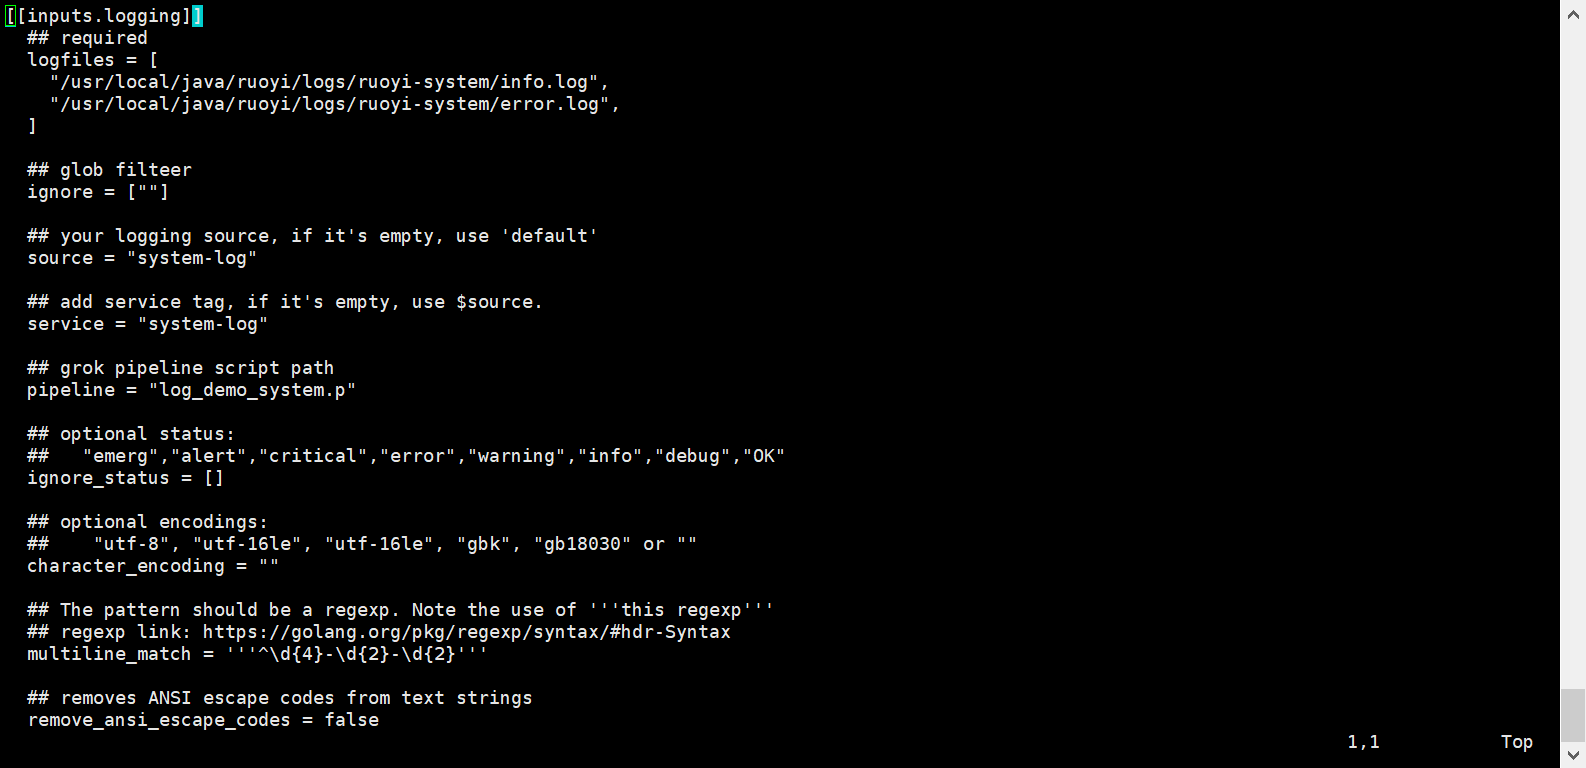
[[inputs.logging]]
  ## required
  logfiles = [
    "/usr/local/java/ruoyi/logs/ruoyi-system/info.log",
    "/usr/local/java/ruoyi/logs/ruoyi-system/error.log",
  ]

  ## glob filter
  ignore = [""]

  ## your logging source, if it's empty, use 'default'
  source = "system-log"

  ## add service tag, if it's empty, use $source.
  service = "system-log"

  ## grok pipeline script path
  pipeline = "log_demo_system.p"

  ## optional status:
  ##   "emerg","alert","critical","error","warning","info","debug","OK"
  ignore_status = []

  ## optional encodings:
  ##    "utf-8", "utf-16le", "utf-16le", "gbk", "gb18030" or ""
  character_encoding = ""

  ## The pattern should be a regexp. Note the use of '''this regexp'''
  ## regexp link: https://golang.org/pkg/regexp/syntax/#hdr-Syntax
  multiline_match = '''^\d{4}-\d{2}-\d{2}'''

  ## removes ANSI escape codes from text strings
  remove_ansi_escape_codes = false


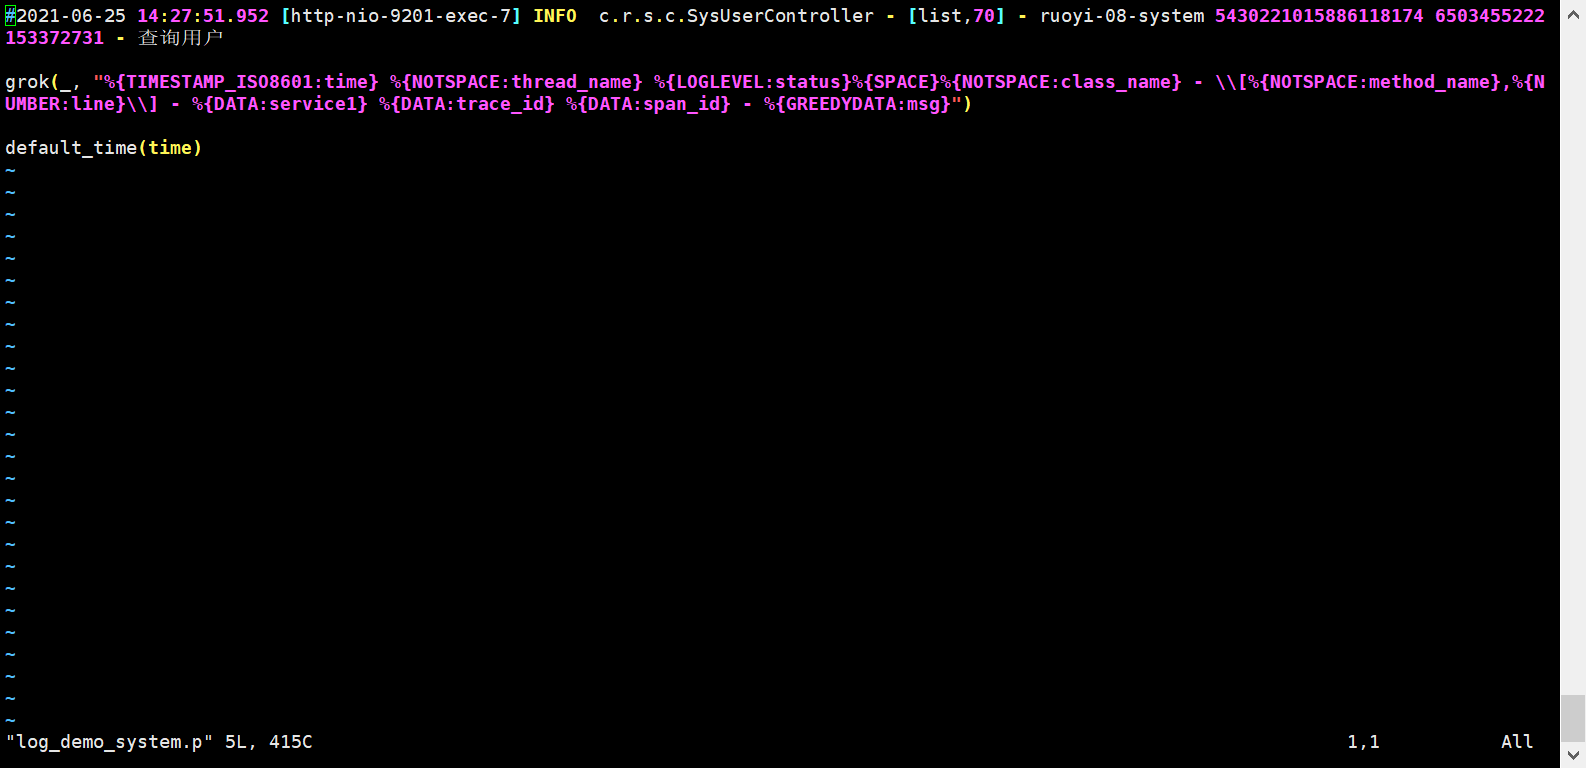
## The pipeline is the Grok statement used to parse log text. If this configuration is not enabled, the platform displays the raw log text. If you fill in the pipeline, the corresponding logs will be parsed with Grok. The `.p` file you specify here must be manually created.
$ /usr/local/datakit/pipeline/
$ vim ruoyi_system.p

grok(_, "%{TIMESTAMP_ISO8601:time} %{NOTSPACE:thread_name} %{LOGLEVEL:status}%{SPACE}%{NOTSPACE:class_name} - \\[%{NOTSPACE:method_name},%{N
UMBER:line}\\] - %{DATA:service1} %{DATA:trace_id} %{DATA:span_id} - %{GREEDYDATA:msg}")

default_time(time)
3. View Log Data

RUM and APM Data Correlation Demo
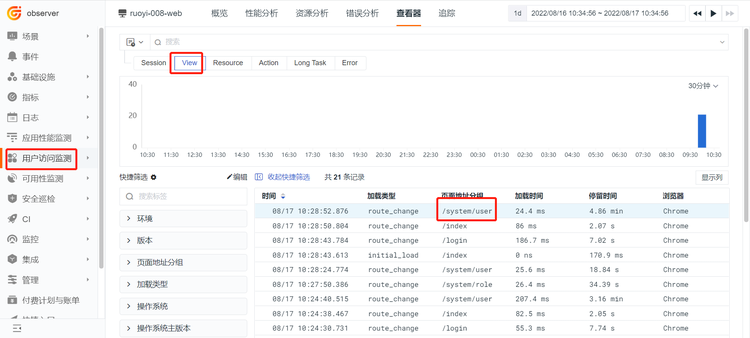
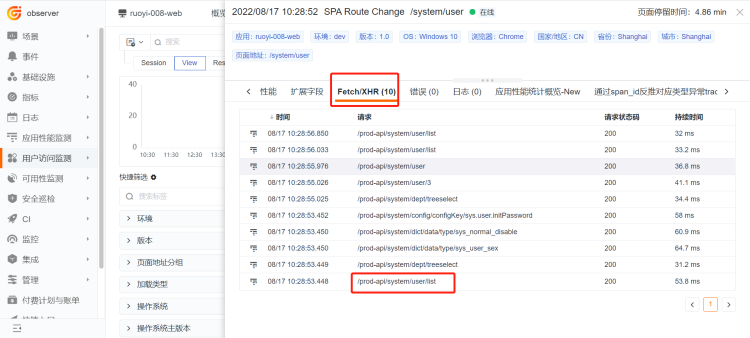
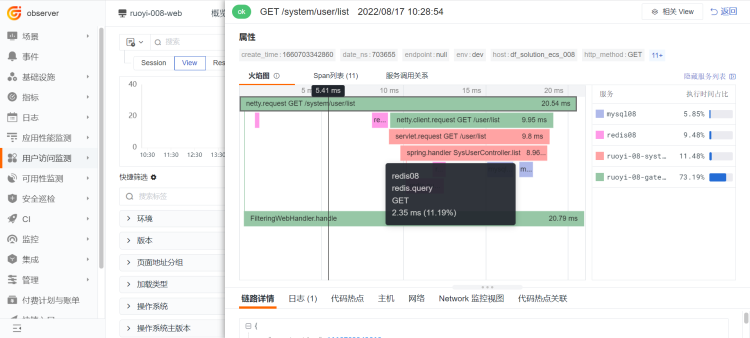
How It Works: When a user visits the frontend application (which has RUM monitoring enabled and the allowedTracingOrigins field configured), the frontend application makes resource and request calls, triggering RUM-js performance data collection. RUM-js generates a trace-id and writes it in the request header. When the request reaches the backend, the backend ddtrace reads the trace_id and records it in its own trace data. This enables correlated analysis between Application Performance Monitoring (APM) and Real User Monitoring (RUM) data through the same trace_id.
Use Case: Frontend and backend are linked, and frontend requests are bound one-to-one with backend method execution performance data. This makes it easier to locate issues related to frontend-backend interaction. For example, if a frontend user login is slow because the backend service takes too long to query the database for user information, the frontend-backend correlated analysis can quickly help cross-team and cross-department troubleshooting. Example below:
Configuration Method: Web Application Monitoring (RUM) Best Practices
1. Frontend RUM Data
2. Jump to Backend APM Data
APM and LOG Data Correlation Demo
1. Enable APM Monitoring
Refer to the APM section in Correlated Analysis of RUM, APM, and LOG for Kubernetes Applications. No additional operations are needed.
2. Modify the Application Log Output Format
This step requires developer involvement. Modify the log output format configuration file (logback/log4j).
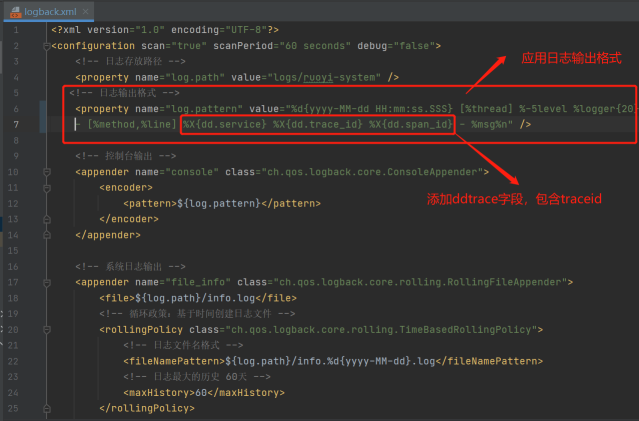
<!-- Log output format -->

<property name="log.pattern" value="%d{yyyy-MM-dd HH:mm:ss.SSS} [%thread] %-5level %logger{20} - [%method,%line] %X{dd.service} %X{dd.trace_id} %X{dd.span_id} - %msg%n" />
Save the XML file and redeploy the application.
3. Enable Log Monitoring
Example:
$ cd /usr/local/datakit/conf.d/log/
$ cp log.conf.sample ruoyi-system.conf
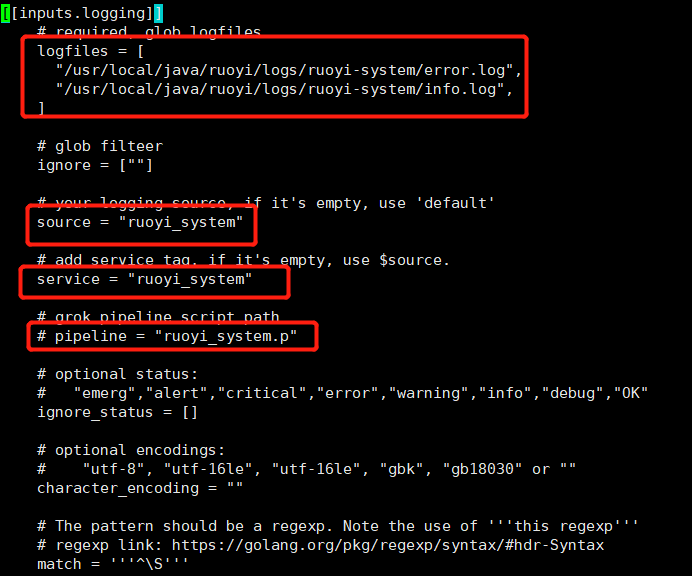
$ vim ruoyi-system.conf

## Modify the content as shown in the image below.
## `logfiles`: absolute path to the application log.
## `service` and `source`: required fields, used to facilitate searching on the platform.
## `pipeline`: optional, can be set based on requirements. The pipeline is used to parse the log into fields. The parsed log content can be converted into metrics for visualization. The trace-id related content does not need to be visualized, so it can be left unparsed.
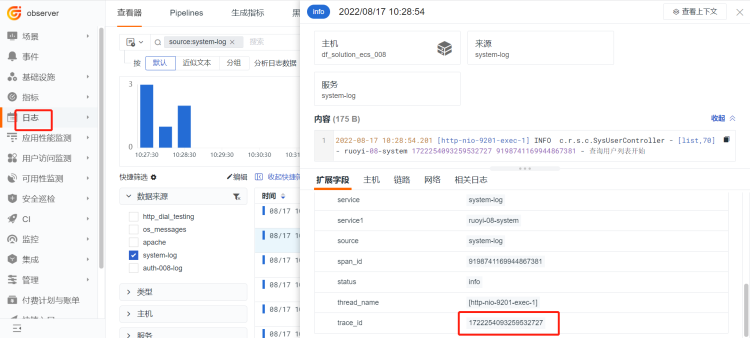
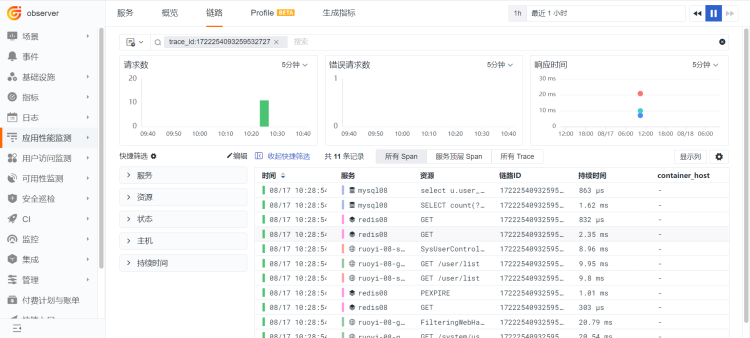
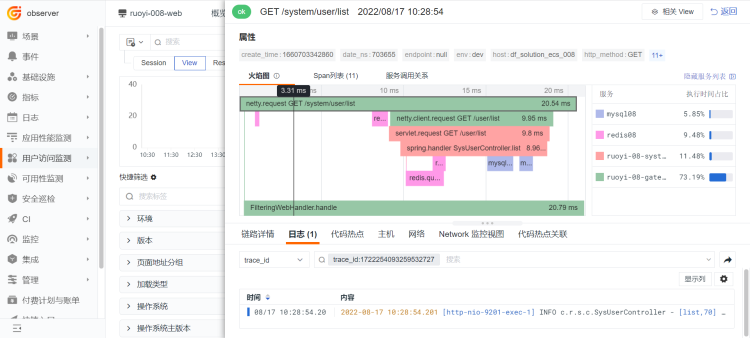
4. APM & LOG Correlated Analysis
- Forward Correlation [APM → Log]
In the APM trace data, search for thetrace_iddirectly in the log module below to view the application logs generated by this trace call.
- Reverse Correlation [Log → APM]
View exception logs, copy thetrace_idfrom the log, and search for thetrace_idin the search box on the Distributed Tracing page. This will retrieve all trace and span data related to that ID. Click to view.