SLO from Methodology to Practice: Part 2 SLO Tool Selection
Service level objectives (SLOs) are a key part of the site reliability engineering toolkit. SLOs provide a framework for defining clear goals around application performance, ultimately helping teams deliver a consistent customer experience, balance feature development with platform stability, and improve communication with internal and external users.
SLOs and SLIs
As we saw in Part 1, SLOs set precise targets for your SLIs, which are metrics that reflect the health and performance of your services. By managing your SLOs in Guance, you can seamlessly access monitoring data—including trace metrics from APM, custom metrics, synthetic data, and metrics generated from logs—to use as SLIs. For example, if you want to ensure that typical user requests are handled quickly, you can use the median latency of a service from APM as an SLI. You can then define an SLO as: "The median latency of all user requests (calculated per minute) will be less than 250 milliseconds 99% of the time in any calendar month."
To accurately track how actual performance compares with the targets you have set, you need a way not only to monitor real-time performance (for example, calculating the median latency every 60 seconds and comparing it with the 250 milliseconds threshold), but also to measure how often that threshold is violated over longer time spans (to ensure the 99% target is met each calendar month). Guance tracks your SLIs and visualizes their status relative to the SLOs you have established, so you can immediately see how actual performance compares with your targets over a given period.
Tool Selection
For SLI metrics, data mainly comes from three pillars: Metrics, Logs, and Traces.
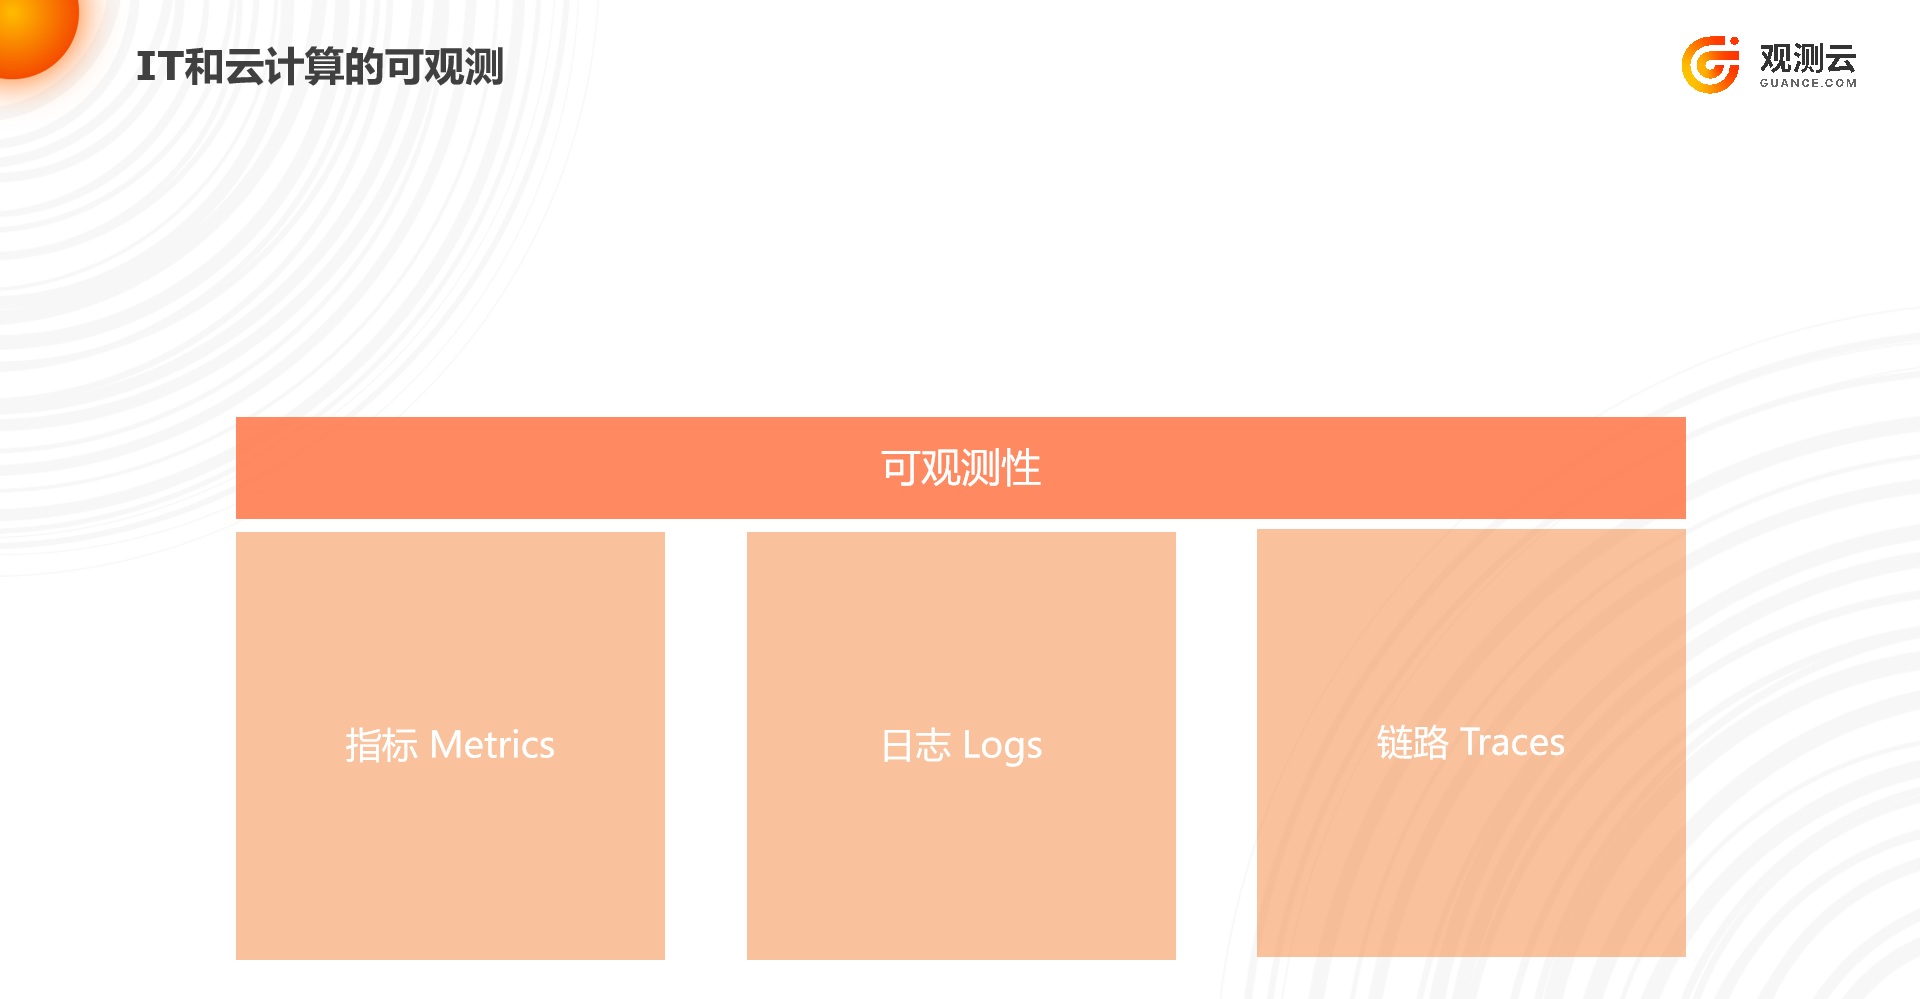
Metrics: Metrics primarily collect system and application metrics, which can have a significant impact on your services. For example, a sudden CPU spike of 100% can cause application processing capacity to drop sharply, manifesting as severe lag for users.
Traces: Traces are the direct call relationships between software modules, constructed based on a directed acyclic graph, and reflect the service call chain. With trace information, you can quickly identify which services and which statements have a significant impact on customers, such as slow database queries.
Logs: Logs are time-related records output by systems/applications, usually generated by system/software developers to make it easy to locate system errors and status. Correlated data in logs can be extracted as Tags or Fields. Tags are convenient for aggregation and grouping, while Fields are convenient for computation and aggregation.
Commonly used tools:
Metrics promethues, OpenTelemetry... Traces skyworking, OpenTelemetry, jaeger, Sleuth, Zipkin... Logs ELK, filebeat, flume...
There are too many free open source tools, and each ecosystem has its own specific console and query language. These tools impose high learning costs and expensive maintenance costs on you, and the scattered systems and user systems force you to constantly switch between multiple platforms. Yet SLIs are exactly what require a platform that can aggregate and centralize components from various systems. Being able to integrate multiple tools through one platform and unify the query language can effectively reduce learning costs. Guance is the best choice. Guance provides you with a one-stop solution and has already integrated 200+ open source tool components. Of course, you could also form a team to build such a platform, but that is not recommended.
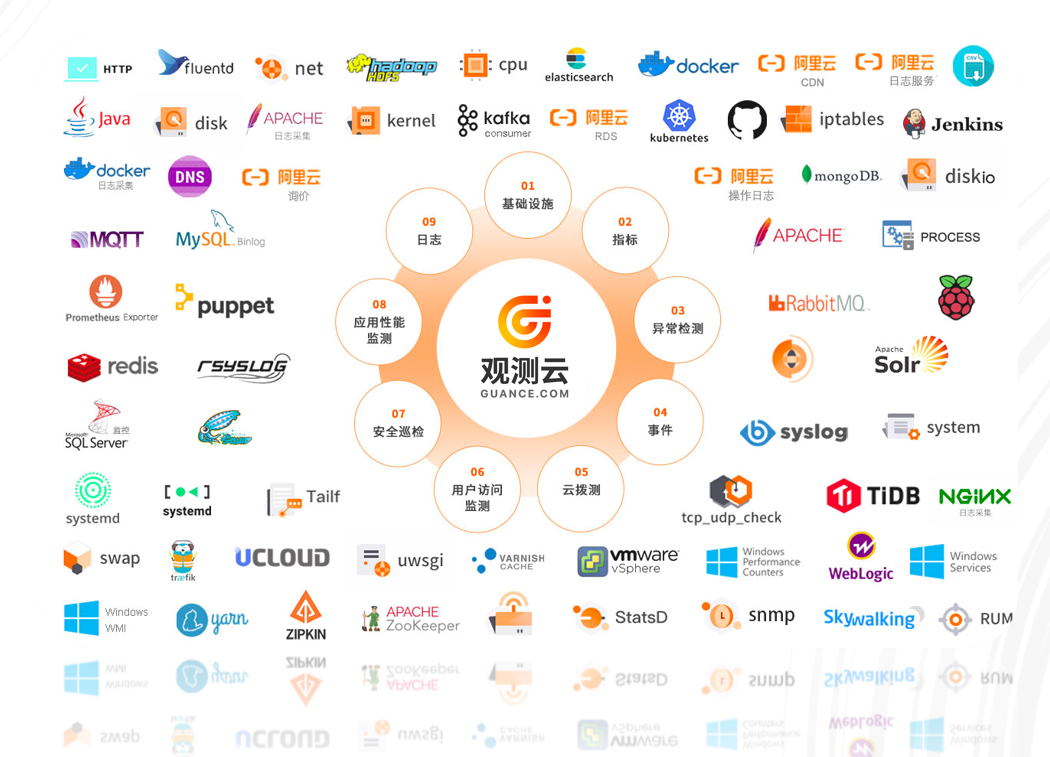
Manage All Your SLOs in One Place
If your organization is committed to various SLOs across multiple products and teams, visualizing the status of all SLOs in one place can help you set priorities and resolve issues. The Guance service level objectives view allows you to see the status of all SLOs, as well as the remaining error budget for each SLO.

Create SLOs from Metrics and Monitors
In the SLO list view, you can create SLOs by clicking the Create SLO button. SLOs in Guance can be based on existing monitors (for example, a monitor that compares p90 latency with a target threshold) or on real-time status calculated from metrics. Metric-based SLOs can be used to monitor the percentage of metrics that meet a specific definition, such as the number of non-5xx responses from a load balancer divided by the total number of responses.
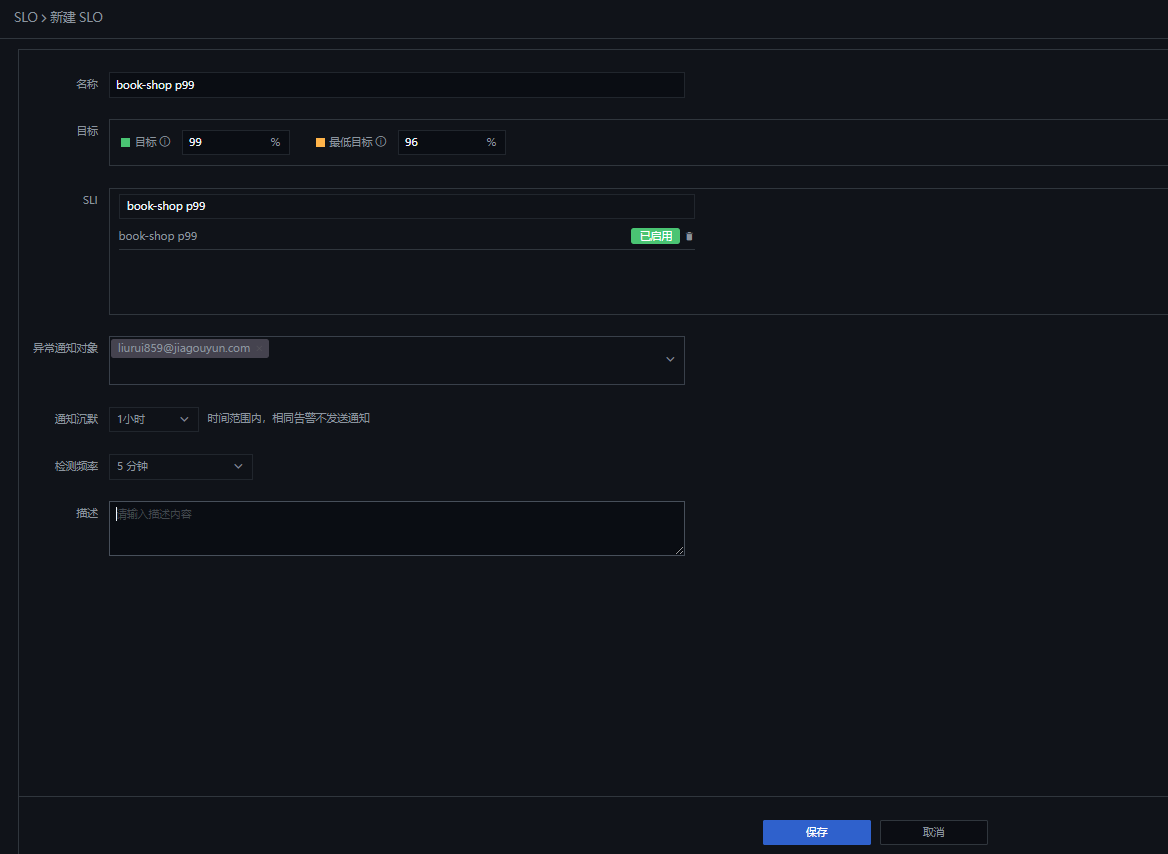
View Your SLOs and Error Budget at a Glance
Clicking an SLO or opening an event opens a side panel that displays detailed information about the SLO, such as its status, target value, and remaining error budget. Guance automatically generates an error budget for each SLO, which represents the degree of unreliability you can tolerate before violating the SLO. This helps you quickly understand whether you are meeting your targets and whether your development velocity is appropriate for your established performance and stability goals. Guance automatically calculates the error budget based on the SLO target and time window you specify. For example, a 99% SLO target over a 7-day period gives you an error budget of approximately three and a half hours during which performance can fall short of the standard.

Visualize SLO Status
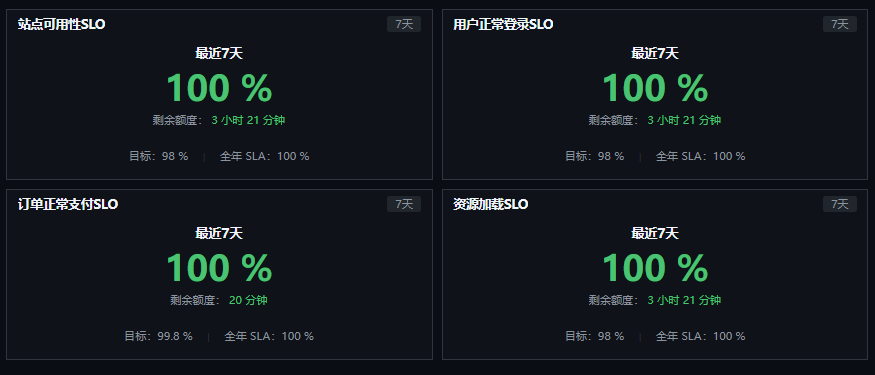 To track the status of your SLOs in context, along with detailed data about related services or infrastructure components, you can add SLO widgets to your Guance dashboard. You can then share your dashboard internally or externally to communicate the real-time status of your SLOs to anyone who depends on your services.
You can also visualize how often the threshold is violated using common SLO baselines, such as last week, last month, week to date, or month to date. If you set a target of 99% for the past 30 days and a warning target of 99.5%, your SLO status displays green when it is above 99.5%, yellow when it falls below 99.5%, and red when it drops below 99%.
Display and Share Your Service Status
Guance makes it simple to monitor and manage your SLOs in the same place where you already monitor applications, infrastructure, user experience, and more. Perhaps just as importantly, Guance enables you to provide transparency to any stakeholders or users who depend on these SLOs being met. If you are not yet using Guance to monitor the health and performance of your services, you can get started here with a free trial account.
Continue reading the next and final part of this series, where we will share best practices for getting the most out of your SLOs in Guance.