Connecting Dubbo Microservices to Guance in an Intranet Environment
Author: Liu Yujie
Introduction
In some projects, the user base consists of internal company personnel or employees of a group company. For security reasons, these projects are deployed in self-built data centers, and employees access them via the intranet or VPN. For this scenario, Guance provides an offline deployment solution: deploy DataKit on a host that has internet access, enable the Proxy collector, and have the intranet hosts install DataKit through this proxy. All data is also reported to Guance via this deployed DataKit.
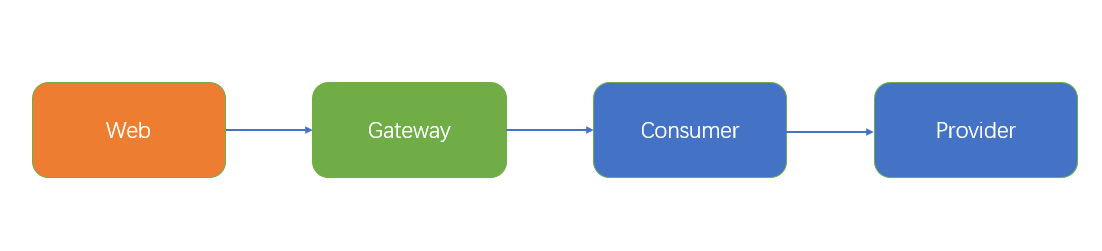
Below, we use a microservices architecture project to demonstrate how to connect to Guance. The project follows a front-end and back-end separation: the front end is developed with Vue, and the back-end microservices use Spring Boot combined with Dubbo. The front end accesses back-end services via a Gateway. Users visit the front-end website through a browser, click buttons on the interface to trigger back-end API requests, which are forwarded by the Gateway to the Consumer microservice. During processing, the Consumer microservice calls the Provider microservice, records logs, and returns the result to the browser, completing one call.
Deployment Planning
The example project consists of four services deployed on four hosts. Additionally, one host with internet access is required, which is also on the same intranet as the other four hosts.
- First, deploy DataKit on the host with internet access and enable the Proxy collector.
- Second, install DataKit on the other four hosts through this proxy.
- Next, deploy the Web project on the web server running Nginx. Ensure port 9529 on this web host is accessible by other intranet hosts.
- Finally, deploy the Gateway, Consumer, and Provider microservices, and enable the SkyWalking collector.
The services used in the example can be downloaded from https://github.com/stevenliu2020/vue3-dubbo. It contains provider.jar, consumer.jar, gateway.jar, and a dist directory (the Vue project).
Below is the mapping between projects and hosts, along with the overall deployment architecture diagram.
- Project to Host Mapping
| IP | Deployed Project | Description |
|---|---|---|
| 172.16.0.245 | DataKit (Proxy) | Has internet access |
| 172.16.0.29 | Web/DataKit | Intranet, Web Server (Nginx) |
| 172.16.0.51 | Gateway/DataKit | Intranet, Gateway service |
| 172.16.0.52 | Consumer/DataKit | Intranet, Consumer service |
| 172.16.0.53 | Provider/DataKit | Intranet, Provider service |
- Overall Deployment Architecture

Prerequisites
- CentOS 7.9
- Nginx installed
- JDK installed
- Zookeeper installed
- Guance account
Environment Versions
Warning
The versions used in this example are: DataKit 1.4.9, Nginx 1.22.0, Spring Cloud 3.1.1, Spring Boot 2.6.6, Dubbo 2.7.15, Zookeeper 3.7.1, Vue 3.2, JDK 1.8.
Steps
1 Deploy DataKit
1.1 Online DataKit Deployment
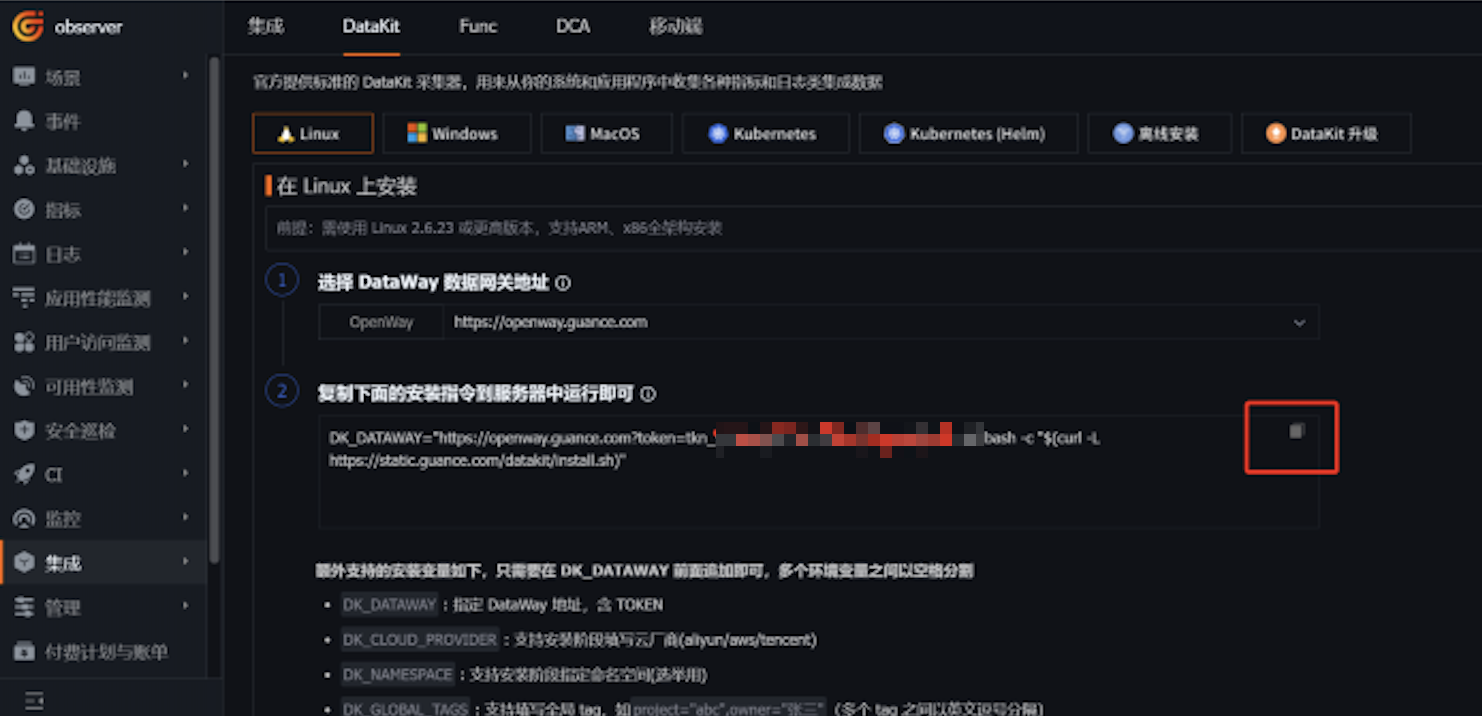
Log in to the Guance console, go to the Integrations module, click DataKit > Linux, copy the installation command, and execute it on host 172.16.0.245. Note that the installation command includes a token, which will be used later.
After installation, run the following commands to enable the Proxy collector:
Edit the /usr/local/datakit/conf.d/datakit.conf file and change the listen value under http_api to 0.0.0.0:9529 to ensure other hosts can access port 9529 on this host.
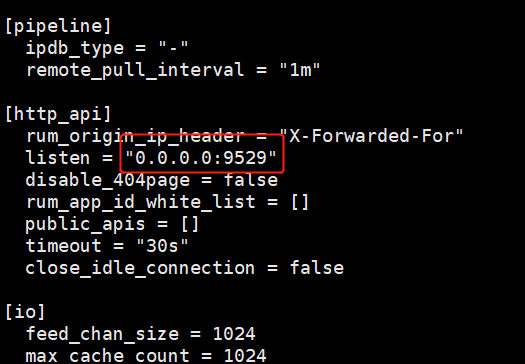
Restart DataKit:
1.2 Deploy DataKit via Proxy
Log in to host 172.16.0.29 and run the following command to install DataKit.
Here, 172.16.0.245 is the IP of the DataKit host installed in the previous step. This step installs DataKit through the DataKit proxy. The token used in the command is the same as the one mentioned above.
export HTTPS_PROXY=http://172.16.0.245:9530; DK_DATAWAY=https://openway.guance.com?token=tkn_9a1111123412341234123412341113bb bash -c "$(curl -L https://static.guance.com/datakit/install.sh)"
Run the following command to test whether data can be reported to Guance:
curl -x http://172.16.0.245:9530 -v -X POST https://openway.guance.com/v1/write/metrics?token=tkn_9a1111123412341234123412341113bb -d "proxy_test,name=test c=123i"
A return status of 200 indicates successful data reporting.
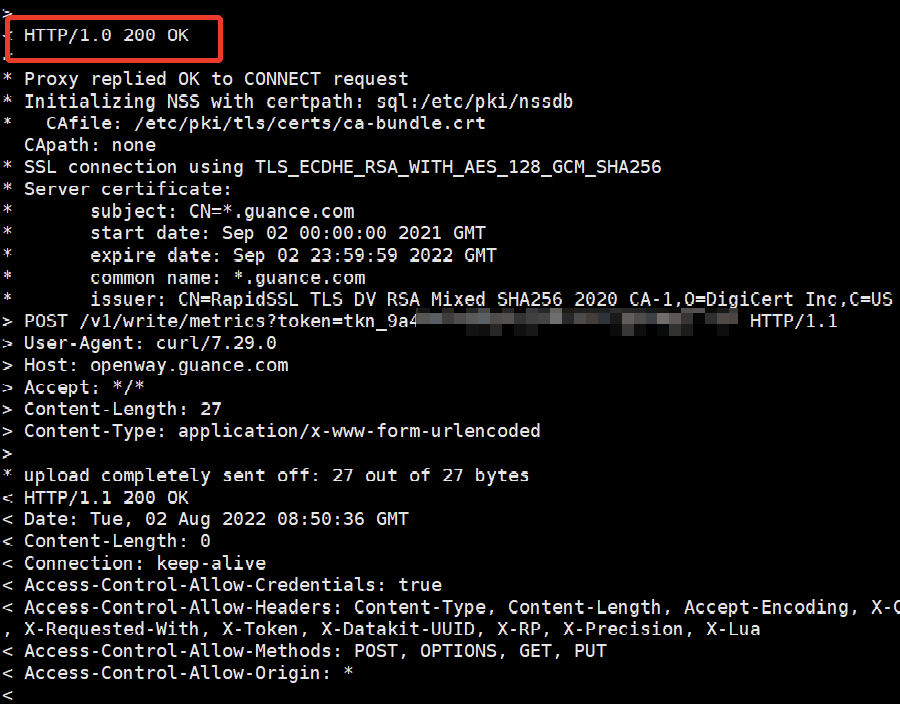
Use the same steps to deploy DataKit on hosts 172.16.0.51, 172.16.0.52, and 172.16.0.53. This completes the DataKit deployment on all four hosts.
2 APM Integration
2.1 Enable the SkyWalking Collector
Log in to host 172.16.0.51, copy the sample file to enable the SkyWalking collector:
Restart DataKit:
Use the same steps to enable the SkyWalking collector on the DataKit instances deployed on hosts 172.16.0.52 and 172.16.0.53.
2.2 Upload the SkyWalking Agent
There are many APM tools available. Since the microservices use the Dubbo framework, we recommend using SkyWalking.
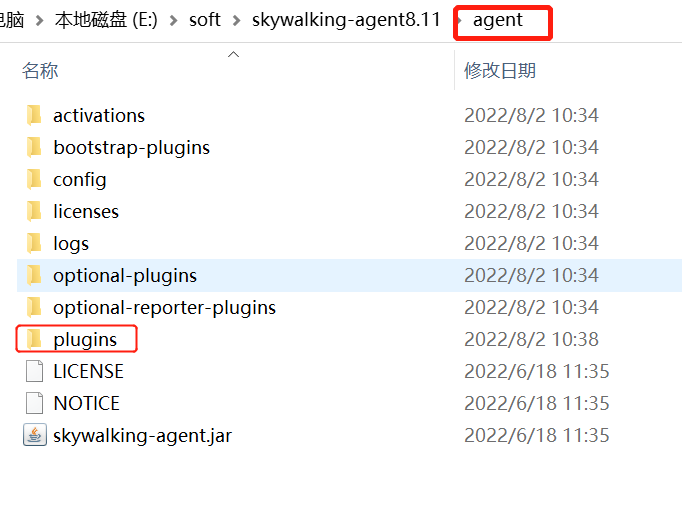
Download apache-skywalking-java-agent-8.11.0, extract it, rename the folder to agent, and upload it to the /usr/local/df-demo/ directory on hosts 172.16.0.51, 172.16.0.52, and 172.16.0.53.
Note: On host 172.16.0.51, which runs the Gateway, you need to copy the
apm-spring-cloud-gateway-3.x-plugin-8.11.0.jarandapm-spring-webflux-5.x-plugin-8.11.0.jarfiles from theagent\optional-pluginsdirectory to theagent\pluginsdirectory.
2.3 Deploy the Provider Microservice
Upload provider.jar to the /usr/local/df-demo/ directory on host 172.16.0.53, ensuring it is in the same directory as the agent folder. Start the Provider service:
cd /usr/local/df-demo/
java -javaagent:agent/skywalking-agent.jar -Dskywalking.agent.service_name=dubbo-provider -Dskywalking.collector.backend_service=localhost:11800 -jar provider.jar
2.4 Deploy the Consumer Microservice
Upload consumer.jar to the /usr/local/df-demo/ directory on host 172.16.0.52. Start the Consumer service:
cd /usr/local/df-demo/
java -javaagent:agent/skywalking-agent.jar -Dskywalking.agent.service_name=dubbo-consumer -Dskywalking.collector.backend_service=localhost:11800 -jar consumer.jar
2.5 Deploy the Gateway Microservice
Upload gateway.jar to the /usr/local/df-demo/ directory on host 172.16.0.51. Start the Gateway service:
cd /usr/local/df-demo/
java -javaagent:agent/skywalking-agent.jar -Dskywalking.agent.service_name=dubbo-gateway -Dskywalking.collector.backend_service=localhost:11800 -jar gateway.jar
3 RUM Integration
Upload the dist directory to the /usr/local/df-demo/ directory on host 172.16.0.29. The front-end connects to the back-end API via the URL specified in the dist\js\app.ec288764.js file. In this example, the back-end Gateway URL is http://172.16.0.51:9000/api.
Log in to the Guance console, go to the Real User Monitoring module, create a new application named dubbo-web, and copy the provided command.
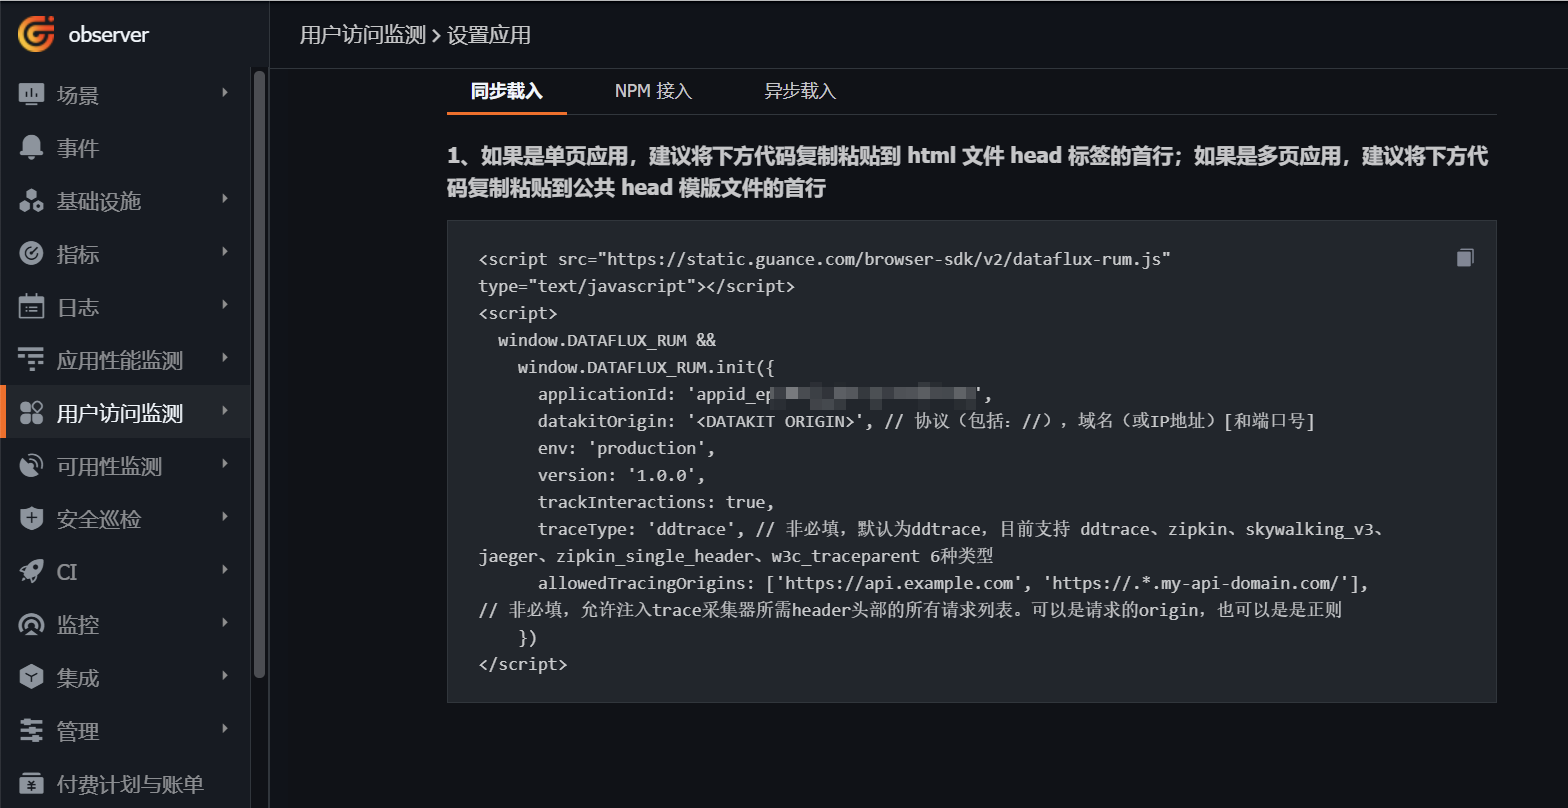
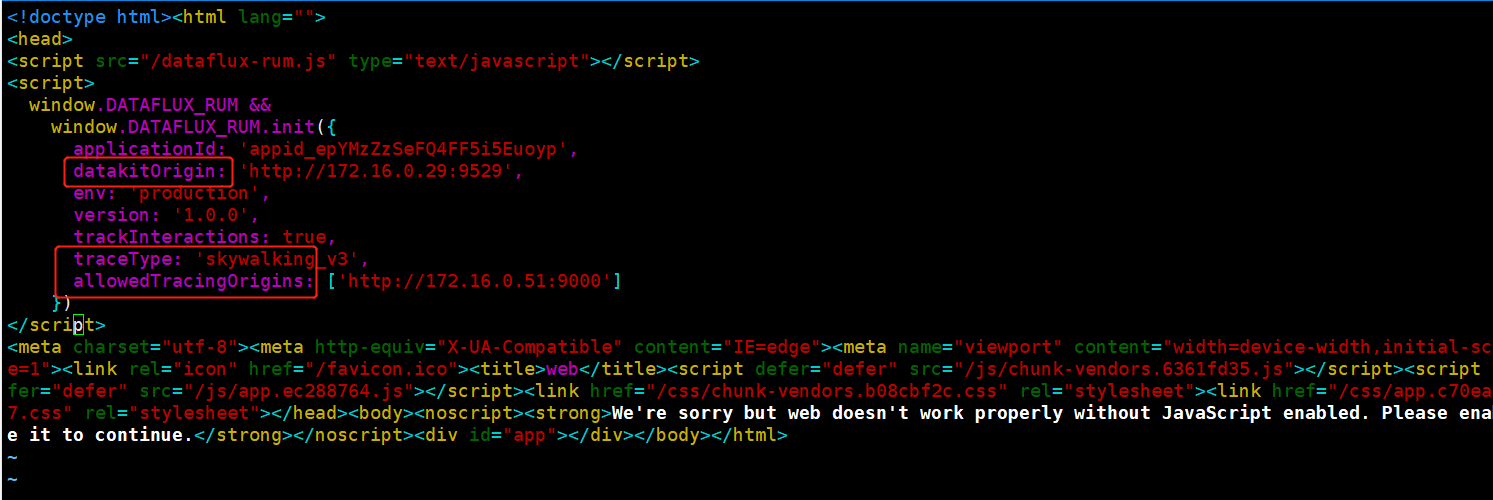
Edit /etc/nginx/nginx.conf and add the following content:
server {
        listen       80;
        #add_header Access-Control-Allow-Origin '*';
        #add_header Access-Control-Allow-Headers Origin,X-Requested-Width,Content-Type,Accept;

        location / {
            proxy_set_header   Host    $host:$server_port;
            proxy_set_header   X-Real-IP   $remote_addr;
            proxy_set_header   X-Forwarded-For  $proxy_add_x_forwarded_for;
            root   /usr/local/df-demo/dist;
            index  index.html index.htm;
        }
        #location /nginx_status{
        #        stub_status on;
        #}

    }
Reload the configuration:
Open a browser and visit http://172.16.0.29/ to access the front-end interface. Click buttons on the interface to trigger back-end API calls.
Log in to the Guance console, go to Real User Monitoring > dubbo-web. Here you will find many features for analyzing front-end application performance.
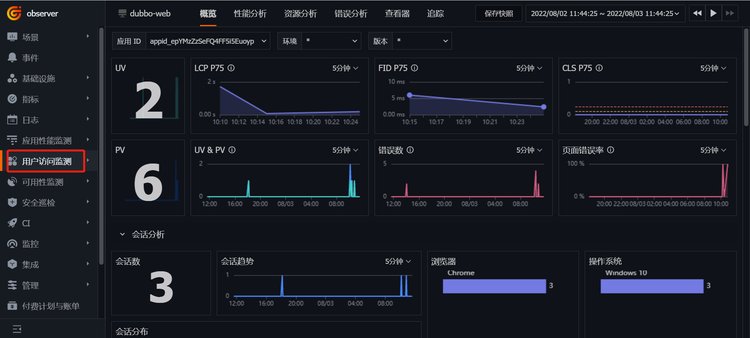
4 Log Integration
Using the apm-toolkit-log4j-2.x package from SkyWalking, you can output the traceId generated by SkyWalking into logs via log4j2.
DataKit's pipeline can extract the traceId from logs and associate it with traces.
4.1 Add Dependency
To output the traceId in the logs of the Provider microservice, add the following dependency to the pom.xml file of the Provider. The version should match the javaagent version used, which is 8.11.0 in this example.
<dependency>
    <groupId>org.apache.skywalking</groupId>
    <artifactId>apm-toolkit-log4j-2.x</artifactId>
    <version>8.11.0</version>
</dependency>
4.2 Enable the Log Collector
Log in to the host where the Provider service is deployed (172.16.0.53), and copy the sample file:
Edit the logging.conf file. Set the source to log-dubbo-provider; this name will be used later for log queries or pipeline configuration. Fill in the log file path in logfiles.
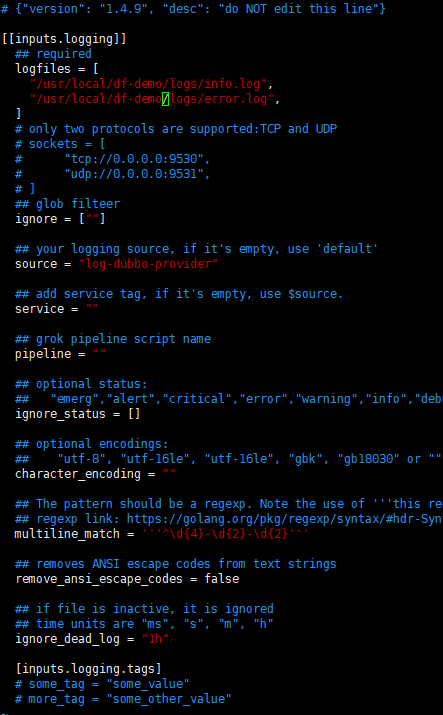
Restart DataKit:
4.3 Pipeline
Log in to the Guance console, go to Logs > Pipelines.
Click Create Pipeline, filter by the source defined when enabling the log collector (log-dubbo-provider).
Enter the following parsing rules, then click Save.
# 2022-08-03 10:55:50.818 [DubboServerHandler-172.16.0.29:20880-thread-2] INFO dubbo.service.StockAPIService - [decreaseStorage,21] - [TID: 1bc41dfa-3c2c-4917-9da7-0f48b4bcf4b7] - 用户ID:-4972683369271453960 ,发起流程审批:-1133938638

grok(_, "%{TIMESTAMP_ISO8601:time} %{NOTSPACE:thread_name} %{LOGLEVEL:status}%{SPACE}%{NOTSPACE:class_name} - \\[%{NOTSPACE:method_name},%{NUMBER:line}\\] - \\[TID: %{DATA:trace_id}\\] - %{GREEDYDATA:msg}")
default_time(time)
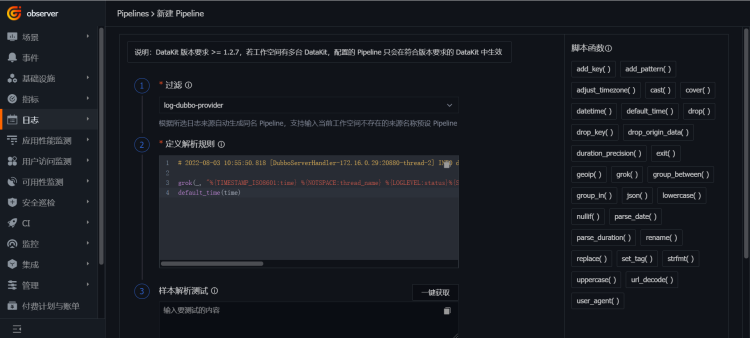
Trigger a call to the Provider service from the front end. The logs generated by the Provider will be collected by DataKit and reported to Guance.
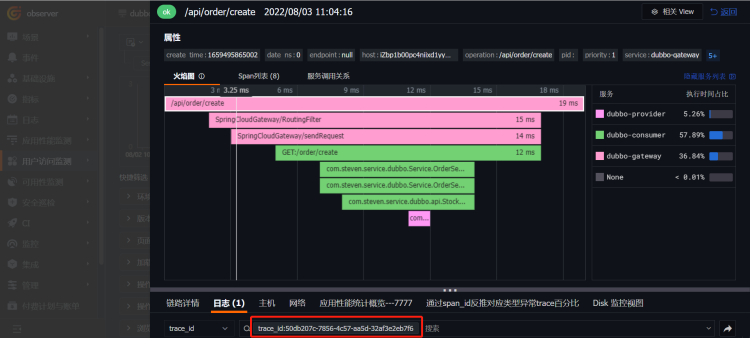
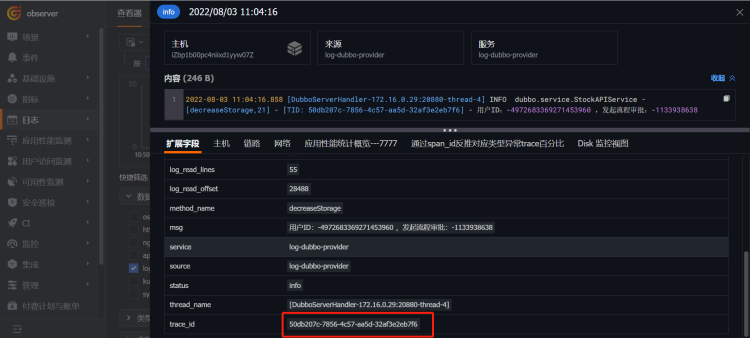
Log in to the Guance console, go to the Logs module's Explorer. Find the data source log-dubbo-provider, click on a log entry to view its details. You will see that trace_id has been added as a tag. Later, in APM, you can use this traceId to correlate with logs, helping you quickly locate issues.
5 Integrated Analysis
Through the steps above, you have completed the integration of RUM, APM, and logging.
Log in to the Guance console, go to Real User Monitoring, click dubbo-web, then click Explorer, select View to inspect page calls.
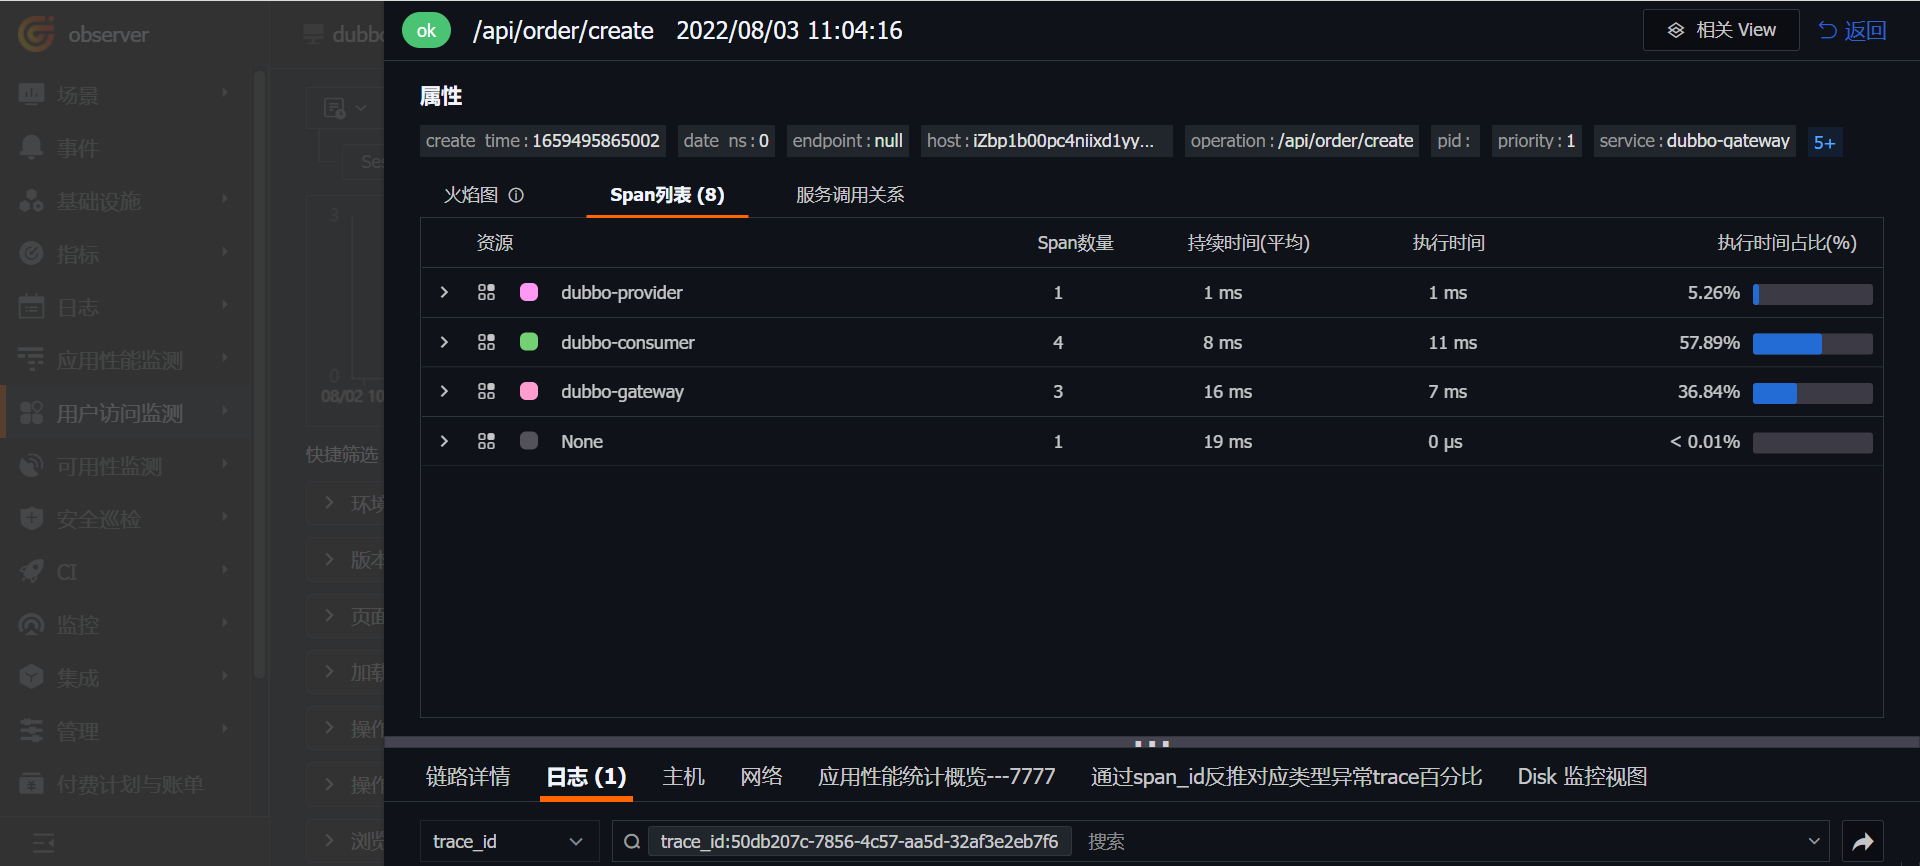
Then click route_change to enter. Under the Fetch/XHR tab, you can see the API calls triggered by the front end. Click on any entry to view the flame graph, span list, service call relationships, and the associated logs of the Provider service.