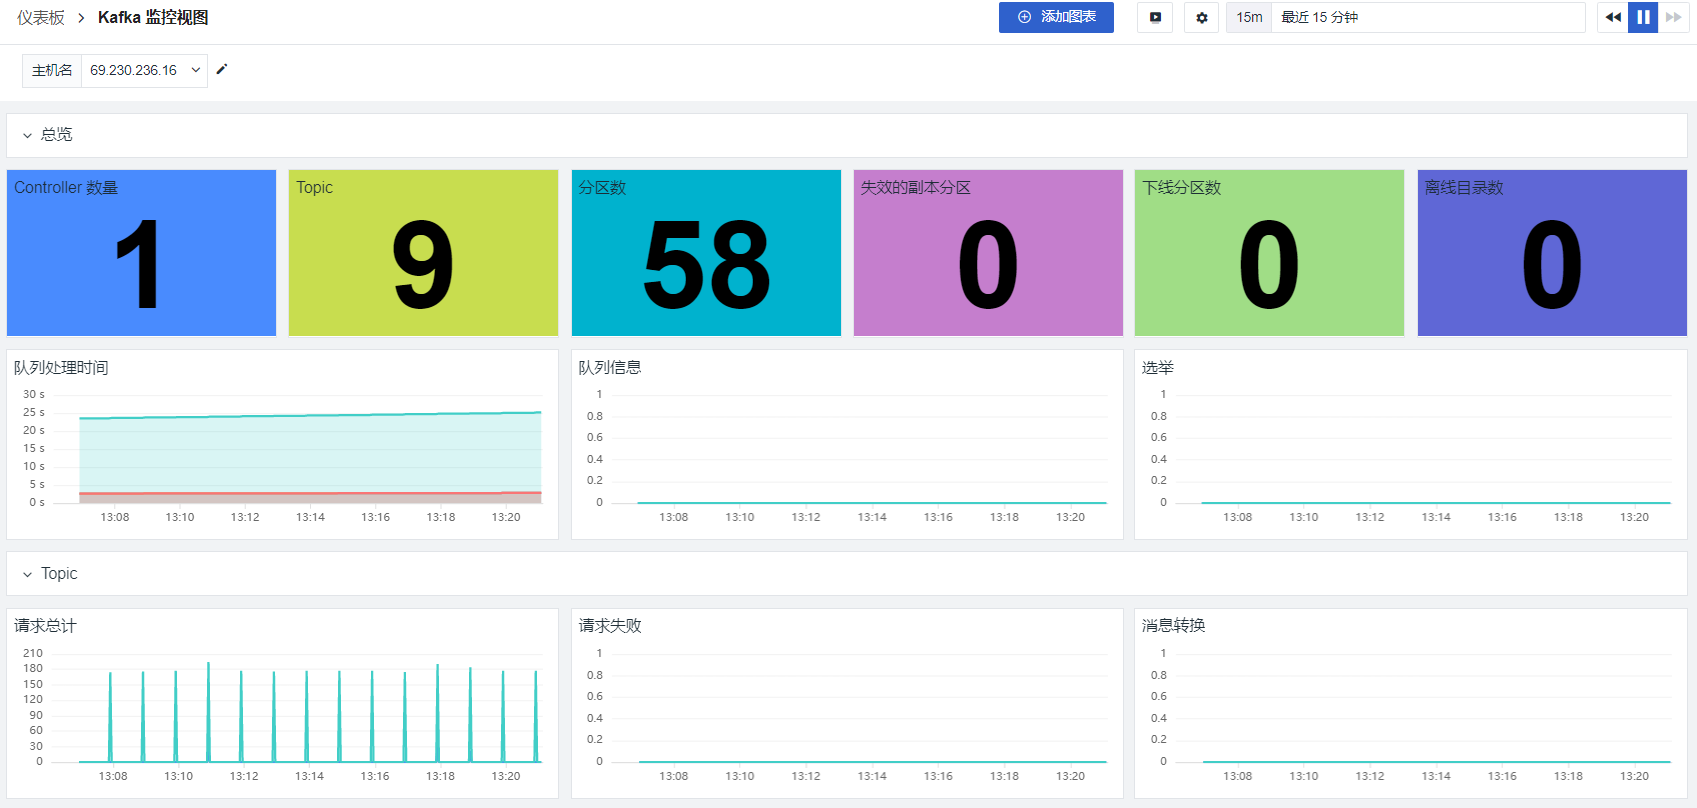
Kafka Observability Best Practices
Overview
Kafka is a distributed publish-subscribe messaging system developed by LinkedIn. It is a real-time data processing system that can be scaled horizontally. Like other middleware such as RabbitMQ and RocketMQ, it has several key features:
- Asynchronous processing
- Service decoupling
- Traffic peak shaving
The following diagram shows an example of asynchronous processing.

Architecture
As shown in the diagram below, a Kafka architecture consists of several Producers, several Consumers, several Brokers, and a ZooKeeper cluster.

- ZooKeeper: The Kafka cluster uses ZooKeeper to manage cluster configuration, elect leaders, and perform rebalancing when Consumer Group membership changes.
- Broker: A message middleware processing node. Each node is a Broker. A Kafka cluster consists of one or more Brokers, and a message can be distributed across multiple Brokers.
- Producer: Publishes messages to Brokers.
- Consumer: Reads messages from Brokers.
- Consumer Group: Each Consumer belongs to a specific Consumer Group. You can assign a name to the group; otherwise, it belongs to the default group. A message can be sent to multiple groups, but only one Consumer within a group can consume the message.
Kafka categorizes messages. Every message sent to the cluster must specify a Topic. A Topic represents a category of messages and is logically considered a Queue. Each message produced by a Producer must specify a Topic, and Consumers pull messages from the corresponding Broker based on the subscribed Topic. Each Topic contains one or more Partitions. A Partition corresponds to a folder that stores the partition's data and index files. Messages within a Partition are ordered. A Topic is divided into one or more Partitions, and each Partition has multiple replicas distributed across different Brokers. The multiple replicas of a partition follow a leader-follower relationship: one leader and multiple followers. The Leader serves external requests (i.e., interacts with client programs), while Followers passively synchronize from the Leader and cannot interact with clients. This multi-replica mechanism enables automatic failover: if a Broker in the cluster fails, service availability is still guaranteed, improving disaster recovery.
As shown in the diagram below, a Kafka cluster has 4 Brokers, and a Topic has three partitions. Assuming the replication factor is also set to 3, each partition will have one Leader and two Follower replicas.
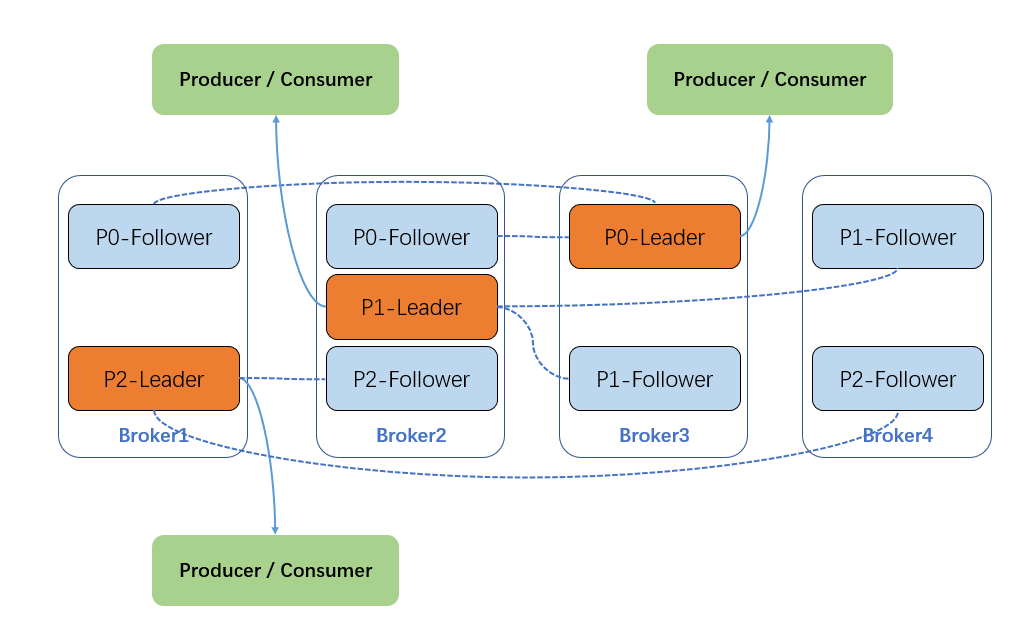
Partition replicas are located on different Brokers. Producers and Consumers only interact with the Leader replica, while Follower replicas are only responsible for synchronizing messages. When the Leader replica fails, a new Leader replica is elected from the Follower replicas to serve external requests.
Below are some important terms in the Kafka multi-replica mechanism.
- AR (Assigned Replicas): All replicas in a partition are collectively referred to as AR.
- ISR (In-Sync Replicas): The Leader replica and all Follower replicas that are keeping up with the Leader to a certain degree (including the Leader itself) form the ISR.
- OSR (Out-of-Sync Replicas): The opposite of ISR. All Follower replicas that are not keeping up with the Leader replica to a certain degree form the OSR.
First, the Producer sends messages to the Leader replica. Then, Follower replicas pull messages from the Leader for synchronization. At any given moment, the messages in all replicas are not exactly identical; that is, during synchronization, Followers lag behind the Leader to some extent. The relationship among the three is: AR = ISR + OSR.
The Leader is responsible for maintaining and tracking the lag status of all Follower replicas in the ISR set. When a Follower lags too much or fails, the Leader removes it from the ISR set. Conversely, if a Follower in the OSR set catches up with the Leader's synchronization range, the Leader moves it from the OSR set to the ISR set. Generally, when the Leader fails or becomes unavailable, only Followers in the ISR set are eligible to be elected as the new Leader; Followers in the OSR set are not eligible (though this can be changed by modifying configuration parameters).
Key Metrics for Monitoring Kafka
The following section provides detailed information about Kafka metrics.
UnderReplicatedPartitions
UnderReplicatedPartitions indicates the number of partitions that are not fully synchronized, i.e., the number of partitions with under-replicated replicas. An abnormal value is non-zero. In a healthy cluster, the number of in-sync replicas (ISR) should be exactly equal to the total number of replicas. A non-zero value indicates that some Leader partitions on a Broker have replicas that are not fully synchronized and are not keeping up with the ISR. Possible issues include:
- A Broker is down.
- The disk where a replica resides is faulty or full, causing the replica to go offline. This can be determined by checking the
OfflineLogDirectoryCountmetric (non-zero value). - Performance issues cause the replica to fail to synchronize in time. This can be due to two scenarios: first, the Follower replica process is stuck and does not initiate a synchronization request to the Leader for a period of time (e.g., frequent Full GC); second, the Follower replica process is too slow to catch up with the Leader within a certain time (e.g., excessive I/O overhead).
| Measurement | kafka_replica_manager | |
|---|---|---|
| Metric | Description | Data Type |
| UnderReplicatedPartitions | Number of partitions that are not fully synchronized | int |
| UnderMinIsrPartitionCount | Number of partitions below the minimum ISR count | int |
OfflineLogDirectoryCount
OfflineLogDirectoryCount indicates the number of offline log directories. An abnormal value is non-zero. This metric should be monitored to check for offline log directories.
| Measurement | kafka_log | |
|---|---|---|
| Metric | Description | Data Type |
| OfflineLogDirectoryCount | Number of offline log directories | int |
IsrShrinksPerSec / IsrExpandsPerSec
The number of in-sync replicas (ISR) for any partition should remain stable, unless you are scaling Broker nodes or deleting partitions. To maintain high availability, the Kafka cluster must ensure a minimum ISR count so that if a partition's Leader fails, its Followers can take over. A replica is removed from the ISR pool for the following reasons: the Follower's offset lags far behind the Leader (modify the replica.lag.max.messages configuration), or a Follower has lost contact with the Leader for a certain period of time (modify the replica.socket.timeout.ms configuration). Regardless of the cause, if IsrShrinksPerSec increases without a corresponding increase in IsrExpandsPerSec, it warrants attention and manual intervention.
| Measurement | kafka_replica_manager | |
|---|---|---|
| Metric | Description | Data Type |
| IsrShrinksPerSec.Count | Number of ISR shrink events | int |
| IsrShrinksPerSec.OneMinuteRate | Rate of ISR shrink events | float |
| IsrExpandsPerSec.Count | Number of ISR expand events | int |
| IsrExpandsPerSec.OneMinuteRate | Rate of ISR expand events | float |
ActiveControllerCount
ActiveControllerCount indicates the number of currently active controllers. An abnormal value is 0. The first node to start in a Kafka cluster automatically becomes the Controller. There must be exactly one such node. Under normal circumstances, this metric should be 1 on the Broker where the Controller is located and 0 on all other Brokers. The Controller's responsibility is to maintain the list of partition Leaders and coordinate Leader changes when a Leader becomes unavailable. If a Controller replacement is necessary, ZooKeeper randomly selects a new Controller from the Broker pool. Typically, this value cannot be greater than 1. However, if this value is 0 for a sustained period (less than 1), a clear warning must be issued. Therefore, this metric can be used for alerting.
| Measurement | kafka_controller | |
|---|---|---|
| Metric | Description | Data Type |
| ActiveControllerCount.Value | Number of active Controllers | int |
OfflinePartitionsCount
OfflinePartitionsCount indicates the number of partitions without an active Leader. An abnormal value is non-zero. Since all read and write operations occur on the Partition Leader, any partition without an active Leader is completely unavailable. Consumers and producers on that partition will be blocked until the Leader becomes available. This metric can be used for alerting.
| Measurement | kafka_controller | |
|---|---|---|
| Metric | Description | Data Type |
| OfflinePartitionsCount.Value | Number of offline partitions | int |
LeaderElectionRateAndTimeMs
When a Partition Leader goes down, an election is triggered to elect a new Leader. The LeaderElectionRateAndTimeMs metric allows you to observe how many leader elections occur per second and the election frequency.
| Measurement | kafka_controller | |
|---|---|---|
| Metric | Description | Data Type |
| LeaderElectionRateAndTimeMs.Count | Number of leader elections | int |
| LeaderElectionRateAndTimeMs.OneMinuteRate | Rate of leader elections | float |
| LeaderElectionRateAndTimeMs.50thPercentile | 50th percentile of leader election time | float |
| LeaderElectionRateAndTimeMs.75thPercentile | 75th percentile of leader election time | float |
| LeaderElectionRateAndTimeMs.99thPercentile | 99th percentile of leader election time | float |
UncleanLeaderElectionsPerSec
When a partition Leader on a Kafka Broker becomes unavailable, an unclean leader election may occur, where a new Leader is elected from the partition's ISR set. Essentially, unclean leader elections sacrifice consistency for availability. If no replicas in the ISR are available, and a Leader is elected from the out-of-sync replicas, all messages that were not yet synchronized from the previous Leader will be permanently lost. An abnormal value for UncleanLeaderElectionsPerSec.Count is non-zero, indicating data loss. This requires alerting.
| Measurement | kafka_controller | |
|---|---|---|
| Metric | Description | Data Type |
| UncleanLeaderElectionsPerSec.Count | Number of unclean leader elections | int |
TotalTimeMs
TotalTimeMs is the sum of four metrics:
- queue: time spent waiting in the request queue
- local: time spent processing on the leader
- remote: time spent waiting for a response from followers (only when
requests.required.acks=-1) - response: time spent sending the response
TotalTimeMs measures the total time for server requests. Under normal circumstances, this metric is relatively stable with only small fluctuations. If anomalies are detected, irregular data fluctuations occur. In such cases, check the values of queue, local, remote, and response to identify which segment is causing the delay.
| Measurement | kafka_request | |
|---|---|---|
| Metric | Description | Data Type |
| TotalTimeMs.Count | Total request time | int |
PurgatorySize
PurgatorySize: A temporary holding area where produce and fetch requests wait until they are needed. Monitoring the purgatory size helps identify the root cause of latency. For example, if the number of fetch requests in the purgatory queue increases correspondingly, it can easily explain the increase in consumer fetch time.
| Measurement | kafka_purgatory | |
|---|---|---|
| Metric | Description | Data Type |
| Fetch.PurgatorySize | Fetch Purgatory size | int |
| Produce.PurgatorySize | Produce Purgatory size | int |
| Rebalance.PurgatorySize | Rebalance Purgatory size | int |
| topic.PurgatorySize | Topic Purgatory size | int |
| ElectLeader.PurgatorySize | Elect Leader Purgatory size | int |
| DeleteRecords.PurgatorySize | Delete Records Purgatory size | int |
| DeleteRecords.NumDelayedOperations | Number of delayed delete record operations | int |
| Heartbeat.NumDelayedOperations | Heartbeat monitoring | int |
BytesInPerSec / BytesOutPerSec
BytesInPerSec/BytesOutPerSec: Number of bytes incoming/outgoing per second. Disk throughput and network throughput can both become bottlenecks. If you are sending messages across data centers, have many topics, or replicas are catching up with the leader, network throughput may affect Kafka performance. These metrics help track network throughput on Brokers to determine where the bottleneck lies.
| Measurement | kafka_topics | |
|---|---|---|
| Metric | Description | Data Type |
| BytesInPerSec.Count | Number of bytes incoming per second | int |
| BytesInPerSec.OneMinuteRate | Rate of bytes incoming per second | float |
| BytesOutPerSec.Count | Number of bytes outgoing per second | int |
| BytesOutPerSec.OneMinuteRate | Rate of bytes outgoing per second | float |
RequestsPerSec
RequestsPerSec: Number of requests per second. By monitoring this metric, you can track the request rate of producers and consumers in real time to ensure efficient Kafka communication. If this metric remains consistently high, consider increasing the number of producers or consumers to improve throughput and reduce unnecessary network overhead.
| Measurement | kafka_topics | |
|---|---|---|
| Metric | Description | Data Type |
| TotalFetchRequestsPerSec.Count | Number of fetch requests per second | int |
| TotalProduceRequestsPerSec.Count | Number of produce requests per second | int |
| FailedFetchRequestsPerSec.Count | Number of failed fetch requests for Topics | int |
| FailedProduceRequestsPerSec.Count | Rate of failed produce requests | int |
Other Commonly Used Metrics
| Measurement | kafka_controller | |
|---|---|---|
| Metric | Description | Data Type |
| GlobalTopicCount.Value | Total number of topics in the cluster | int |
| GlobalPartitionCount.Value | Number of partitions | int |
| TotalQueueSize.Value | Total number of queues | int |
| EventQueueSize.Value | Number of event queues | int |
| Measurement | kafka_request | |
|---|---|---|
| Metric | Description | Data Type |
| RequestQueueTimeMs.Count | Request queue time | int |
| ResponseSendTimeMs.Count | Response send time | int |
| MessageConversionsTimeMs.Count | Message conversion time | int |
| Measurement | kafka_topics | |
|---|---|---|
| Metric | Description | Data Type |
| PartitionCount.Value | Number of Partitions | int |
| LeaderCount.Value | Number of Leaders | int |
| BytesRejectedPerSec.Count | Number of rejected Topic requests | int |
Scenario View
Before you start using Guance to observe Kafka, you need to register a Guance account. After registration, log in to the Guance workspace. Then follow the <Kafka Integration Documentation> to implement Kafka observability.