Optimizing Application Performance with async-profiler
Info
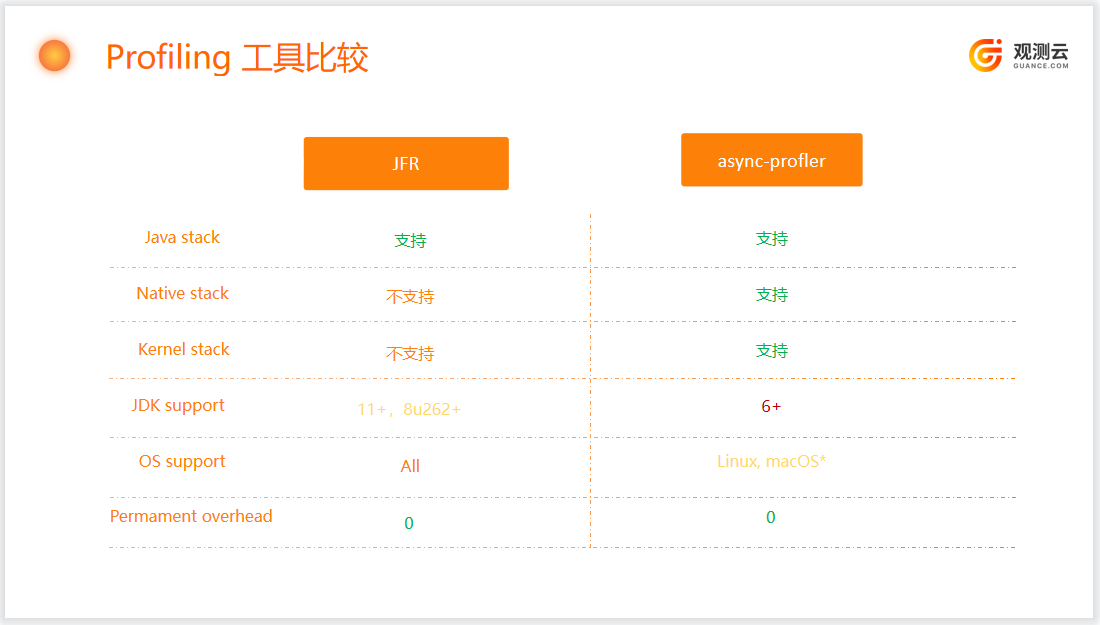
In addition to obtaining Java profiling through JFR (JAVA Flight Recording), another method is using async-profiler.
Introduction to async-profiler
Async-profiler is a low-overhead Java collector and analyzer that does not have the Safepoint bias problem. It leverages HotSpot-specific APIs to collect stack information and memory allocation data, working with OpenJDK, Oracle JDK, and other Java virtual machines based on HotSpot.
Async-profiler can collect several types of events:
- CPU cycles
- Hardware and software performance counters, such as cache misses, branch misses, page faults, context switches, etc.
- Allocation on the Java heap
- Contended lock attempts, including Java object monitors and ReentrantLocks
1. CPU Performance Analysis
In this mode, the profiler collects stack trace samples, which include Java methods, native calls, JVM code, and kernel functions.
Typically, it receives call stacks generated by perf_events and matches them with call stacks generated by AsyncGetCallTrace to produce accurate summaries for both Java and native code.
Additionally, the asynchronous profiler provides a workaround to recover stack traces in some cases where AsyncGetCallTrace fails.
Compared to Java agents that directly use perf_events to translate addresses into Java method names, this method has the following advantages:
- It works with older Java versions because it does not require
-XX:+PreserveFramePointer, available only in JDK 8u60 and later. - It avoids the performance overhead introduced by
-XX:+PreserveFramePointer, which can be up to 10% in rare cases. - It does not require generating mapping files to map Java code addresses to method names.
- It works with interpreter frameworks.
- It does not need to write out perf.data files for further processing in user-space scripts.
2. Memory Allocation Analysis
The profiler can be configured to collect call sites allocating the maximum heap memory instead of detecting code consuming CPU.
Async-profiler does not use invasive techniques like bytecode instrumentation or expensive DTrace probes, which significantly impact performance. It also does not affect escape analysis or prevent JIT optimizations such as allocation elimination. It only measures actual heap allocations.
The profiler features TLAB-driven sampling. It relies on HotSpot-specific callbacks to receive two types of notifications:
- When objects are allocated in newly created TLABs (blue frames in flame graphs);
- When an object is allocated on the slow path outside TLABs (brown frames).
This means not every allocation is counted but only every N kB of allocations, where N is the average size of TLABs. This makes heap sampling very inexpensive and suitable for production. On the other hand, the collected data may be incomplete, though it usually reflects the highest allocation sources in practice.
The sampling interval can be adjusted via the --alloc option. For example, --alloc 500k will sample once after allocating an average of 500 KB of space. However, intervals smaller than the TLAB size will not take effect.
The lowest supported JDK version is 7u40, where TLAB callbacks appeared.
3. Wall-clock Profiling
The -e wall option tells async-profiler to sample all threads at regular intervals regardless of thread state: running, sleeping, or blocked. For instance, this is helpful when analyzing application startup time.
Wall-clock profilers are most useful in per-thread mode: -t.
Example: ./profiler.sh -e wall -t -i 5ms -f result.html 8983
4. Java Method Performance Analysis
The -e ClassName.methodName option profiles a specific Java method by recording stack traces of all calls to this method.
- Non-native applications, example:
-e java.util.Properties.getPropertywill profile all calls togetProperty. - Native applications, use hardware breakpoint events instead, example:
-e Java_java_lang_Throwable_fillInStackTrace
Note: Attaching async-profiler at runtime may cause deoptimization of all compiled methods for non-native Java methods during the first detection. Subsequent detections only refresh related code.
If async-profiler is attached as an agent, significant CodeCache refreshes do not occur.
Some useful native methods you might want to profile include:
G1CollectedHeap::humongous_obj_allocate- tracks G1 GC's huge allocations;JVM_StartThread- tracks new thread creation;Java_java_lang_ClassLoader_defineClass1- tracks class loading.
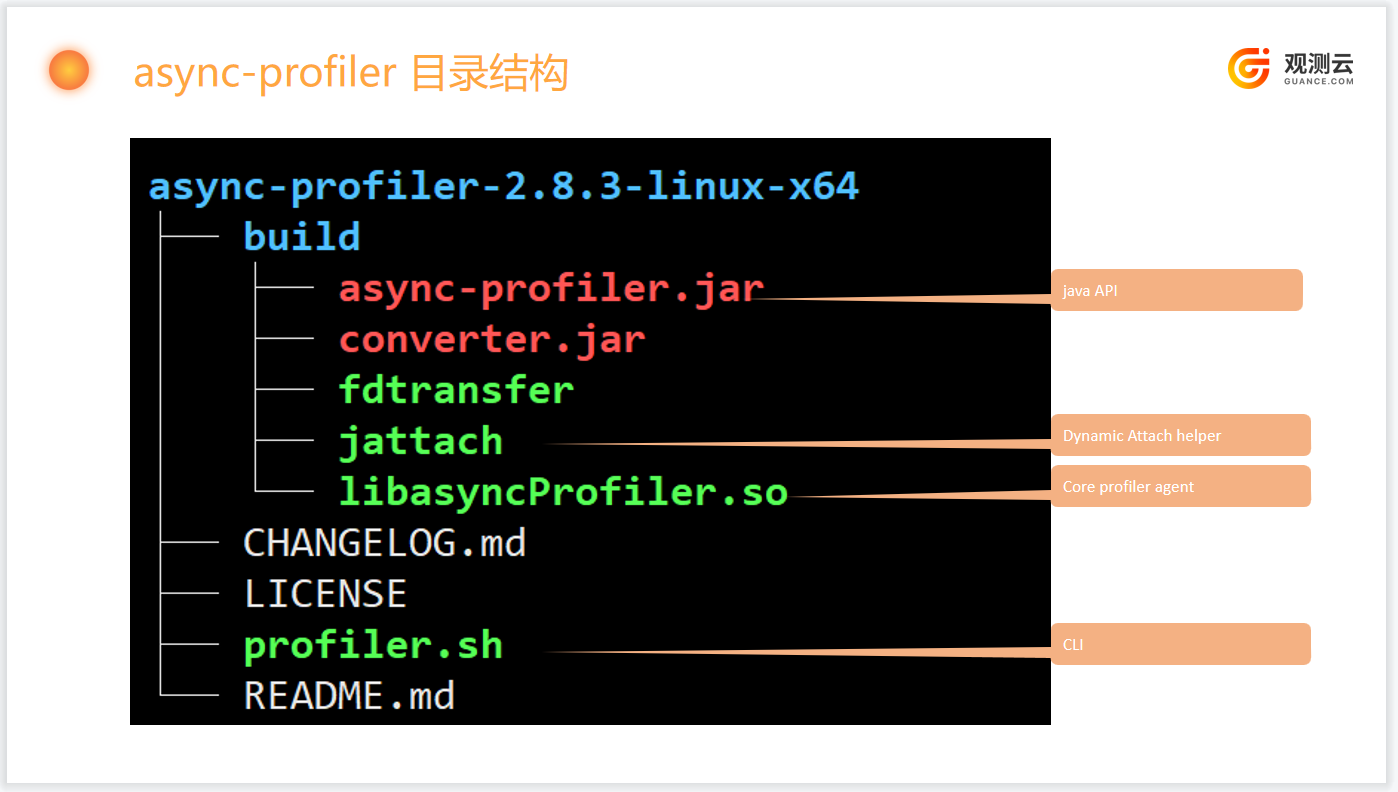
Directory Structure
Launch Methods
Async-profiler is developed as an Agent based on JVMTI (JVM tool interface) and supports two launch methods:
-
- Loaded automatically with the Java process;
-
- Dynamically loaded during program execution via attach API.
1 Loading at Startup
Note
Loading at startup is only suitable for profiling at application startup and cannot perform real-time analysis during runtime.
If you need to profile some code immediately after JVM starts, rather than using the profiler.sh script, you can add async-profiler as an agent in the command line. For example:
$ java -agentpath:async-profiler-2.8.3/build/libasyncProfiler.so=start,event=alloc,file=profile.html -jar ...
The agent library is configured via JVMTI parameters, and the format of the parameter string is described in the source code.
- The
profiler.shscript actually converts command-line arguments into this format.
For example,-e wallconverts toevent=wall, and-f profile.htmlconverts tofile=profile.html. - Some parameters are handled directly by the
profile.shscript.
For example,-d 5includes three operations: using thestartcommand to attach the profiler agent, sleeping for 5 seconds, then using thestopcommand to reattach the agent.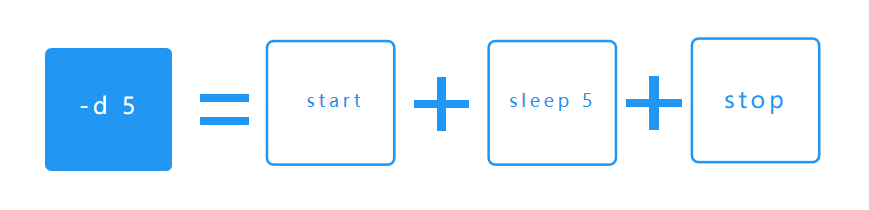
2 Loading During Runtime
More often, you need to analyze the application while it is running.
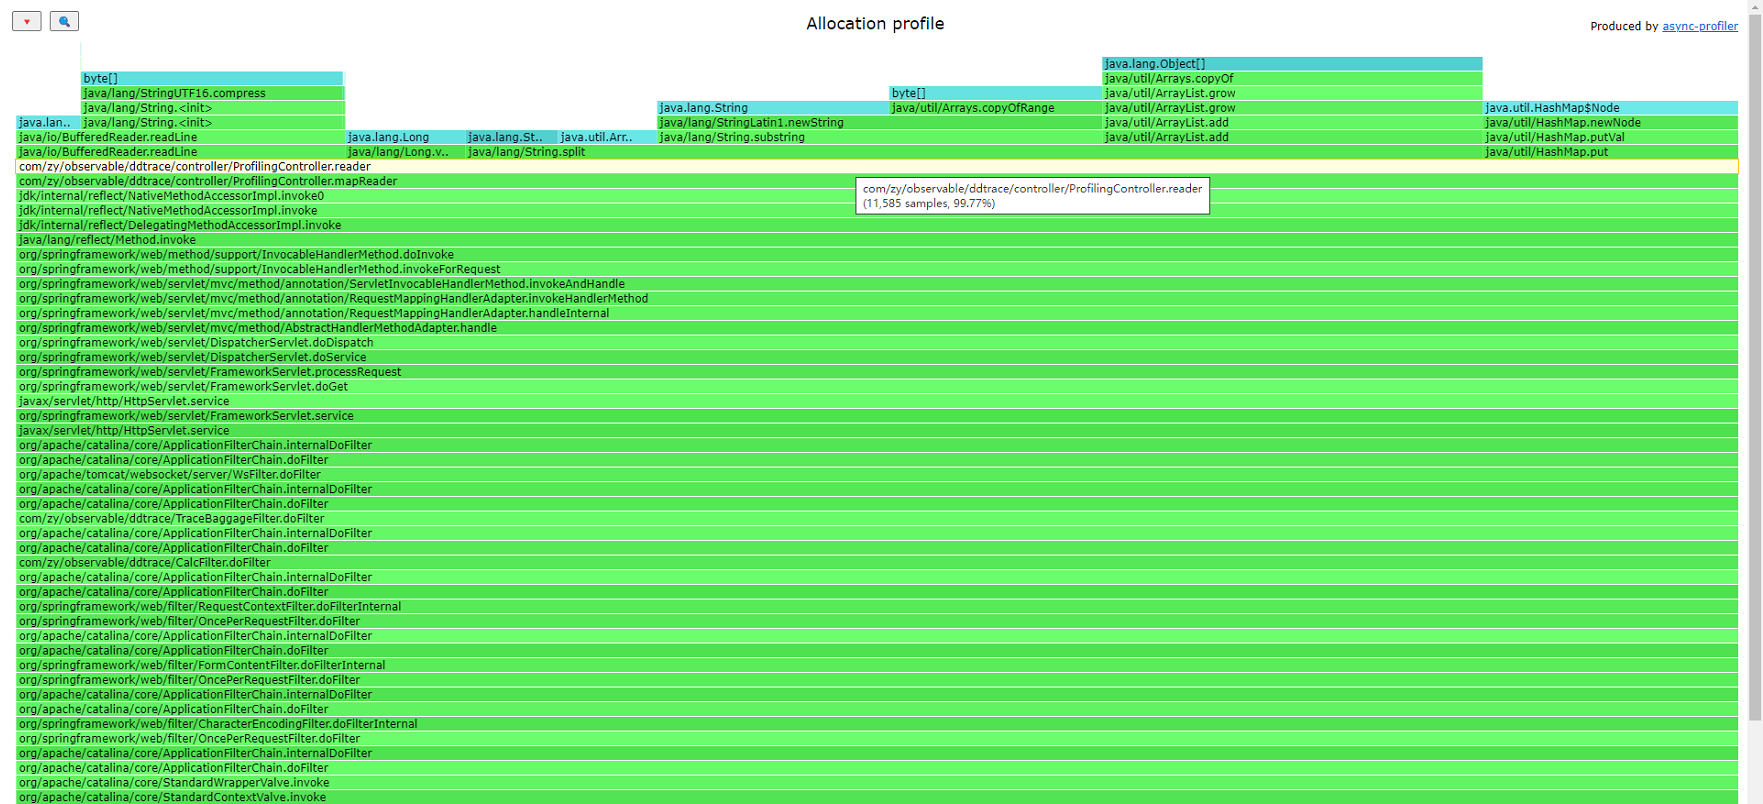
You can observe the memory usage allocation at that moment, with reader allocating 99.77% of the memory.
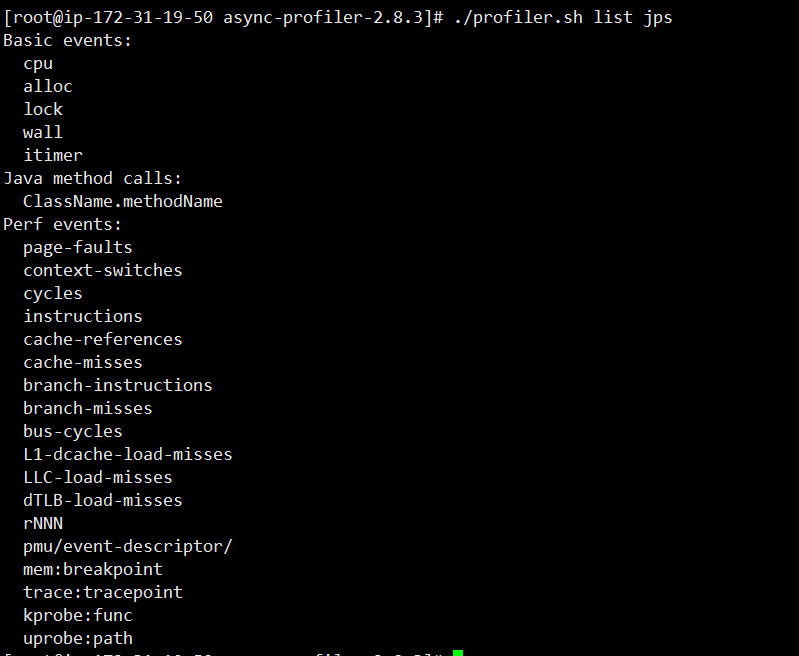
To view supported events for the current application:
Note
HTML format supports only single events, while JFR format supports multiple event outputs.
Integration with Guance
Guance deeply integrates with async-profiler, allowing data to be sent to DataKit and leveraging Guance's powerful UI and analysis capabilities for multi-dimensional analysis.
Refer to the integration documentation
Case Study
Quickly read a large file stored as key-value pairs (key:value) and parse it into a map.
1 Writing a Large File
import java.io.FileWriter;

public class MapGenerator {
    public static String fileName = "/opt/profiling/map-info.txt";
    public static void main(String[] args) {

        try (FileWriter writer = new FileWriter(fileName)) {
            writer.write("");// clear original file content
            for (int i = 0; i < 16500000; i++) {
                writer.write("name"+i+":"+i+"\n");
            }
            writer.flush();
            System.out.println("write success!");
        } catch (Exception e) {
            e.printStackTrace();
        }

    }
}
2 Reading a Large File
private static Map<String,Long> readMap(String fileName) throws IOException {
        Map<String,Long> map = new HashMap<>();
        try(BufferedReader br = new BufferedReader(new FileReader(fileName))) {
            for (String line ;(line = br.readLine())!=null;){
                String[] kv = line.split(":",2);
                String key = kv[0].trim();
                String value = kv[1].trim();
                map.put(key,Long.parseLong(value));
            }
        }
        return map;
    }
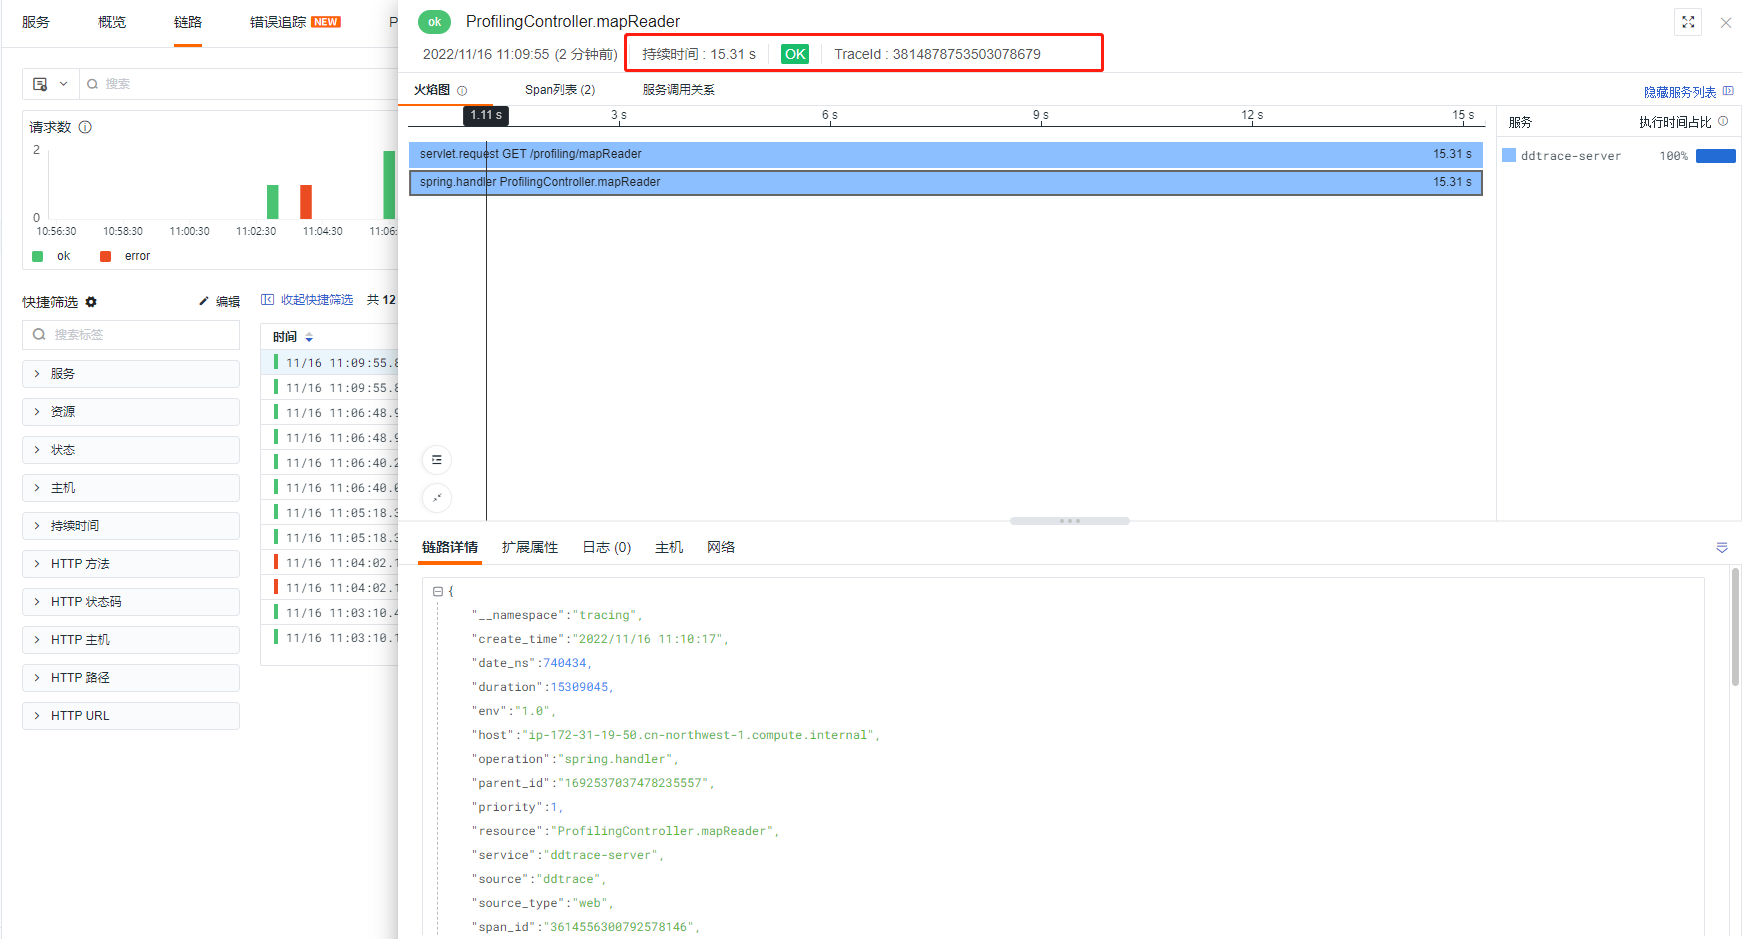
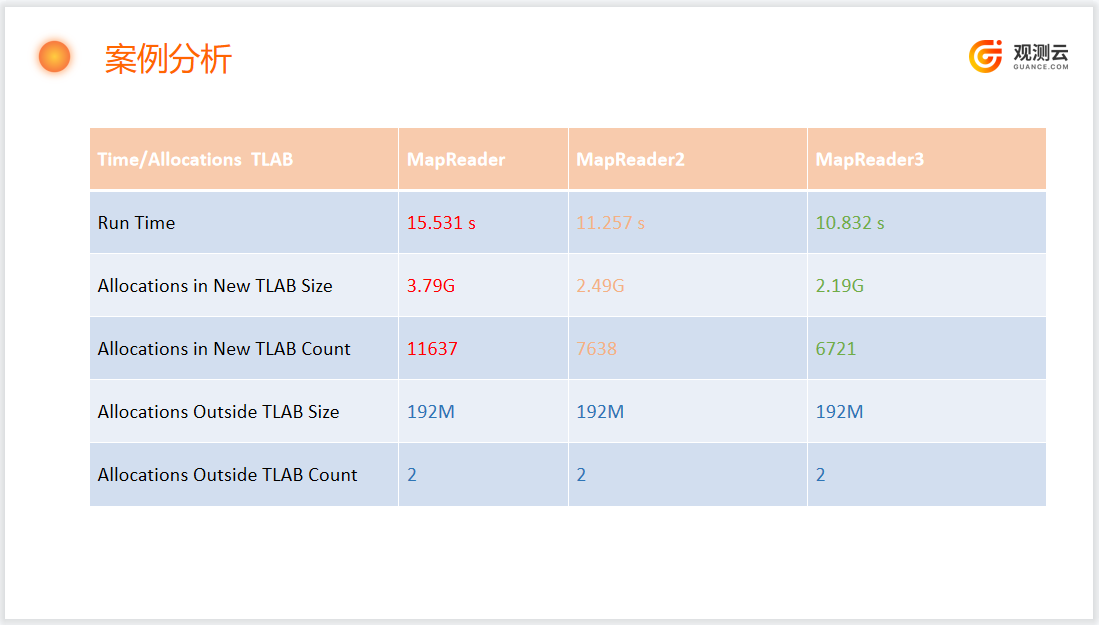
Running MapReader took 15.5 seconds.
[root@ip-172-31-19-50 profiling]# java MapReader
Profiling started
Read 16500000 elements in 15.531 seconds
Execute async-profiler while running MapReader and push the profiling information to the Guance platform for analysis.
[root@ip-172-31-19-50 async-profiler-2.8.3-linux-x64]# DATAKIT_URL=http://localhost:9529 APP_ENV=test APP_VERSION=1.0.0 HOST_NAME=datakit PROFILING_EVENT=cpu,alloc,lock PROFILING_DURATION=10 PROCESS_ID=`ps -ef |grep java|grep springboot|grep -v grep|awk '{print $2}'` SERVICE_NAME=demo bash collect.sh
profiling process 16134

Profiling for 10 seconds
Done
generate profiling file successfully for MapReader, pid 16134
  % Total    % Received % Xferd  Average Speed   Time    Time     Time  Current
                                 Dload  Upload   Total   Spent    Left  Speed
100  110k  100    64  100  110k     99   172k --:--:-- --:--:-- --:--:--  172k
Info: send profile file to datakit successfully
[root@ip-172-31-19-50 async-profiler-2.8.3-linux-x64]#
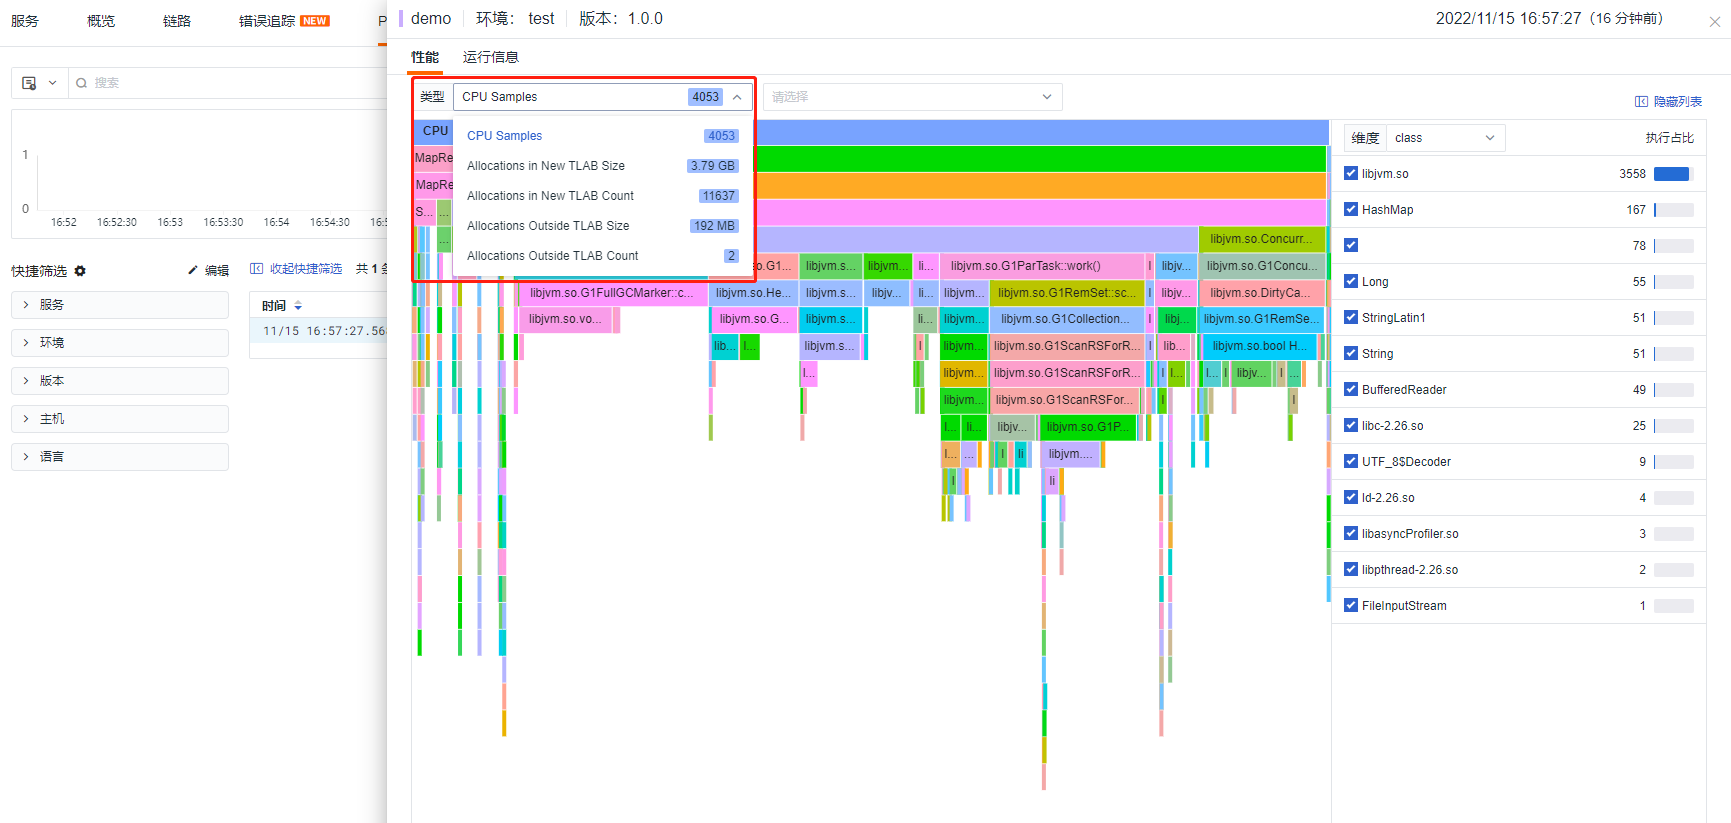
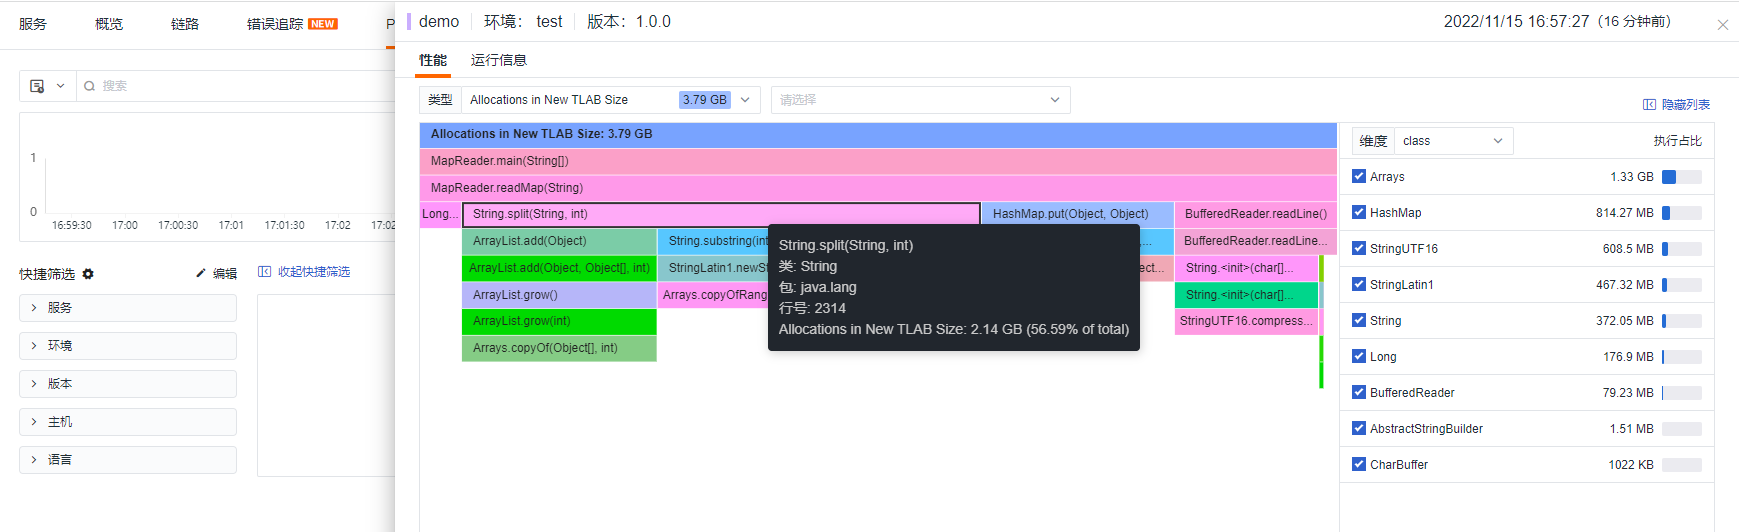
Result
The total memory allocated was 3.79G.
private static Map<String,Long> readMap(String fileName) throws IOException {
        Map<String,Long> map = new HashMap<>();
        try(BufferedReader br = new BufferedReader(new FileReader(fileName))) {
            for (String line ;(line = br.readLine())!=null;){
                int sep = line.indexOf(":");
                String key = trim(line,0,sep);
                String value = trim(line,sep+1,line.length());
                map.put(key,Long.parseLong(value));
            }
        }
        return map;
    }

    private static String trim(String line,int from,int to){
        while (from<to && line.charAt(from) <= ' '){
            from ++;
        }
        while (to > from && line.charAt(to-1) <= ' '){
            to--;
        }
        return line.substring(from,to);
    }
Running MapReader2 took 11.257 seconds.
[root@ip-172-31-19-50 profiling]# java MapReader2
Profiling started
Read 16500000 elements in 11.257 seconds
[root@ip-172-31-19-50 profiling]#
Execute async-profiler while running MapReader2 and push the profiling information to the Guance platform for analysis, using the same command as Method One.
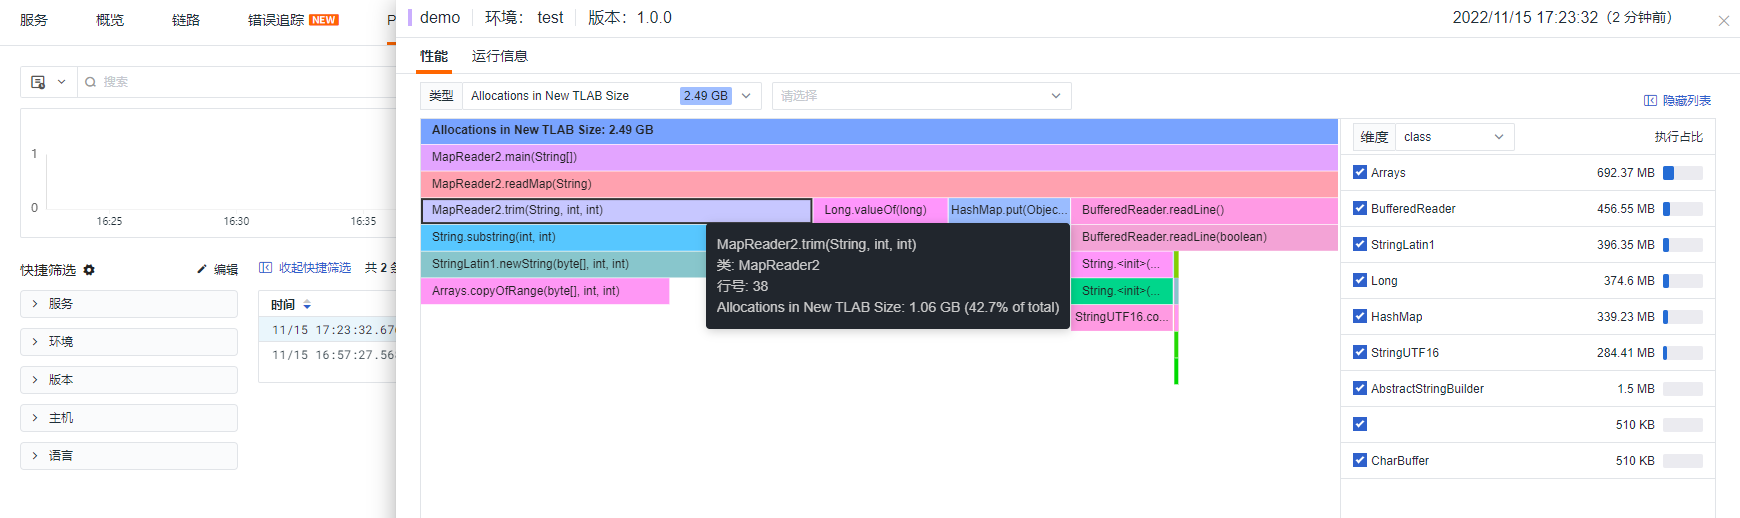
Result
The total memory allocated was 2.49G, saving 1.3G compared to Method One, and reducing the time by approximately 4 seconds.
private static Map<String,Long> readMap(String fileName) throws IOException {
        Map<String,Long> map = new HashMap<>(600000);
        try(BufferedReader br = new BufferedReader(new FileReader(fileName))) {
            for (String line ;(line = br.readLine())!=null;){
                int sep = line.indexOf(":");
                String key = trim(line,0,sep);
                String value = trim(line,sep+1,line.length());
                map.put(key,Long.parseLong(value));
            }
        }
        return map;
    }

    private static String trim(String line,int from,int to){
        while (from<to && line.charAt(from) <= ' '){
            from ++;
        }
        while (to > from && line.charAt(to-1) <= ' '){
            to--;
        }
        return line.substring(from,to);
    }
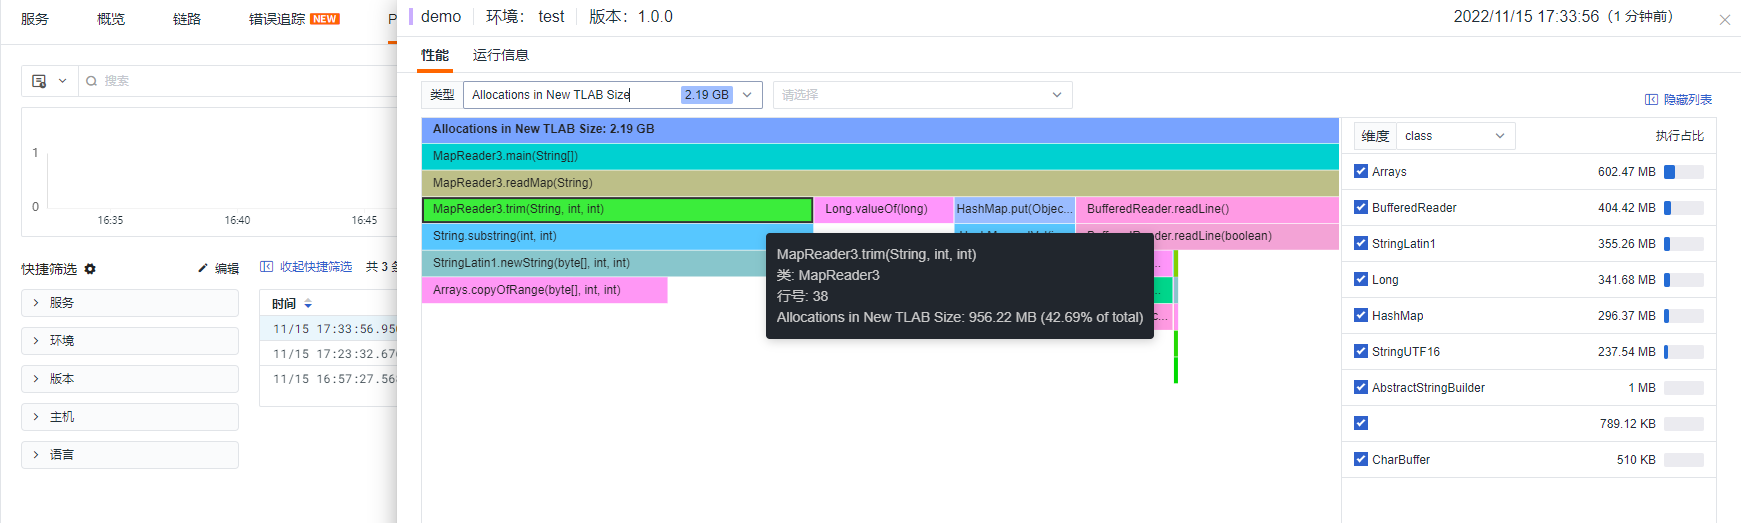
Result
The steps are the same as Method Two. MapReader3 differs from MapReader2 by specifying the capacity when initializing the Map, thus saving 0.3G of memory compared to Method Two and 1.6G compared to Method One.
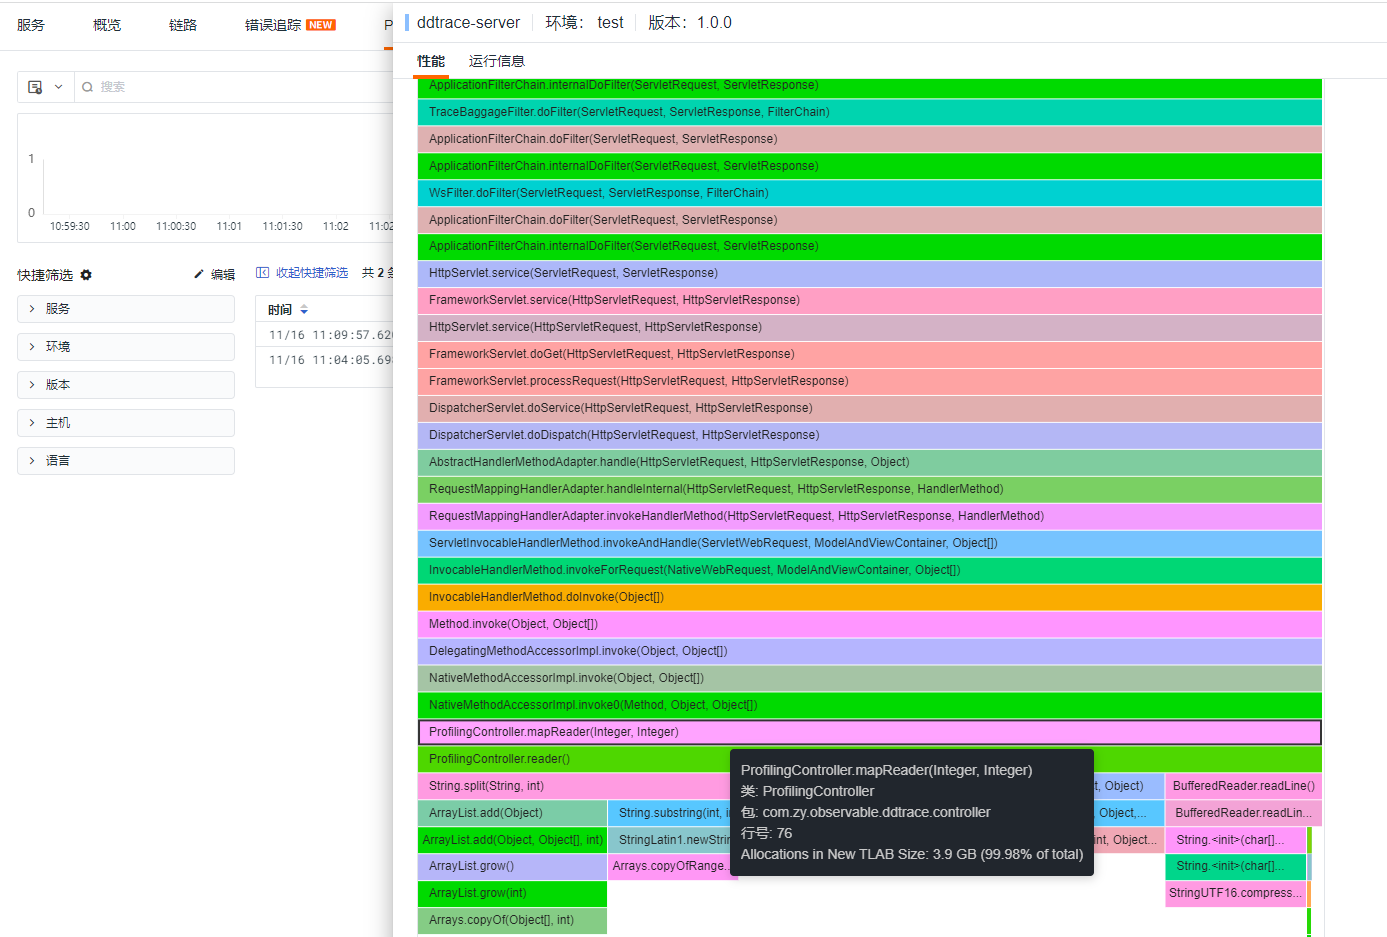
3 Combining Metrics, Traces, and Correlated Analysis
Since the above demo code has a short lifecycle, it cannot provide comprehensive observability (JVM-related metrics, host-related metrics, etc.). Migrating the demo code to a Spring Boot application and using APM (ddtrace-agent) combined with jvm metrics and async-profiler allows for observable insights from three dimensions: metrics (JVM/host), traces (current trace situation), profiling (performance analysis). By accessing corresponding URLs, you can perform async-profiler analysis.
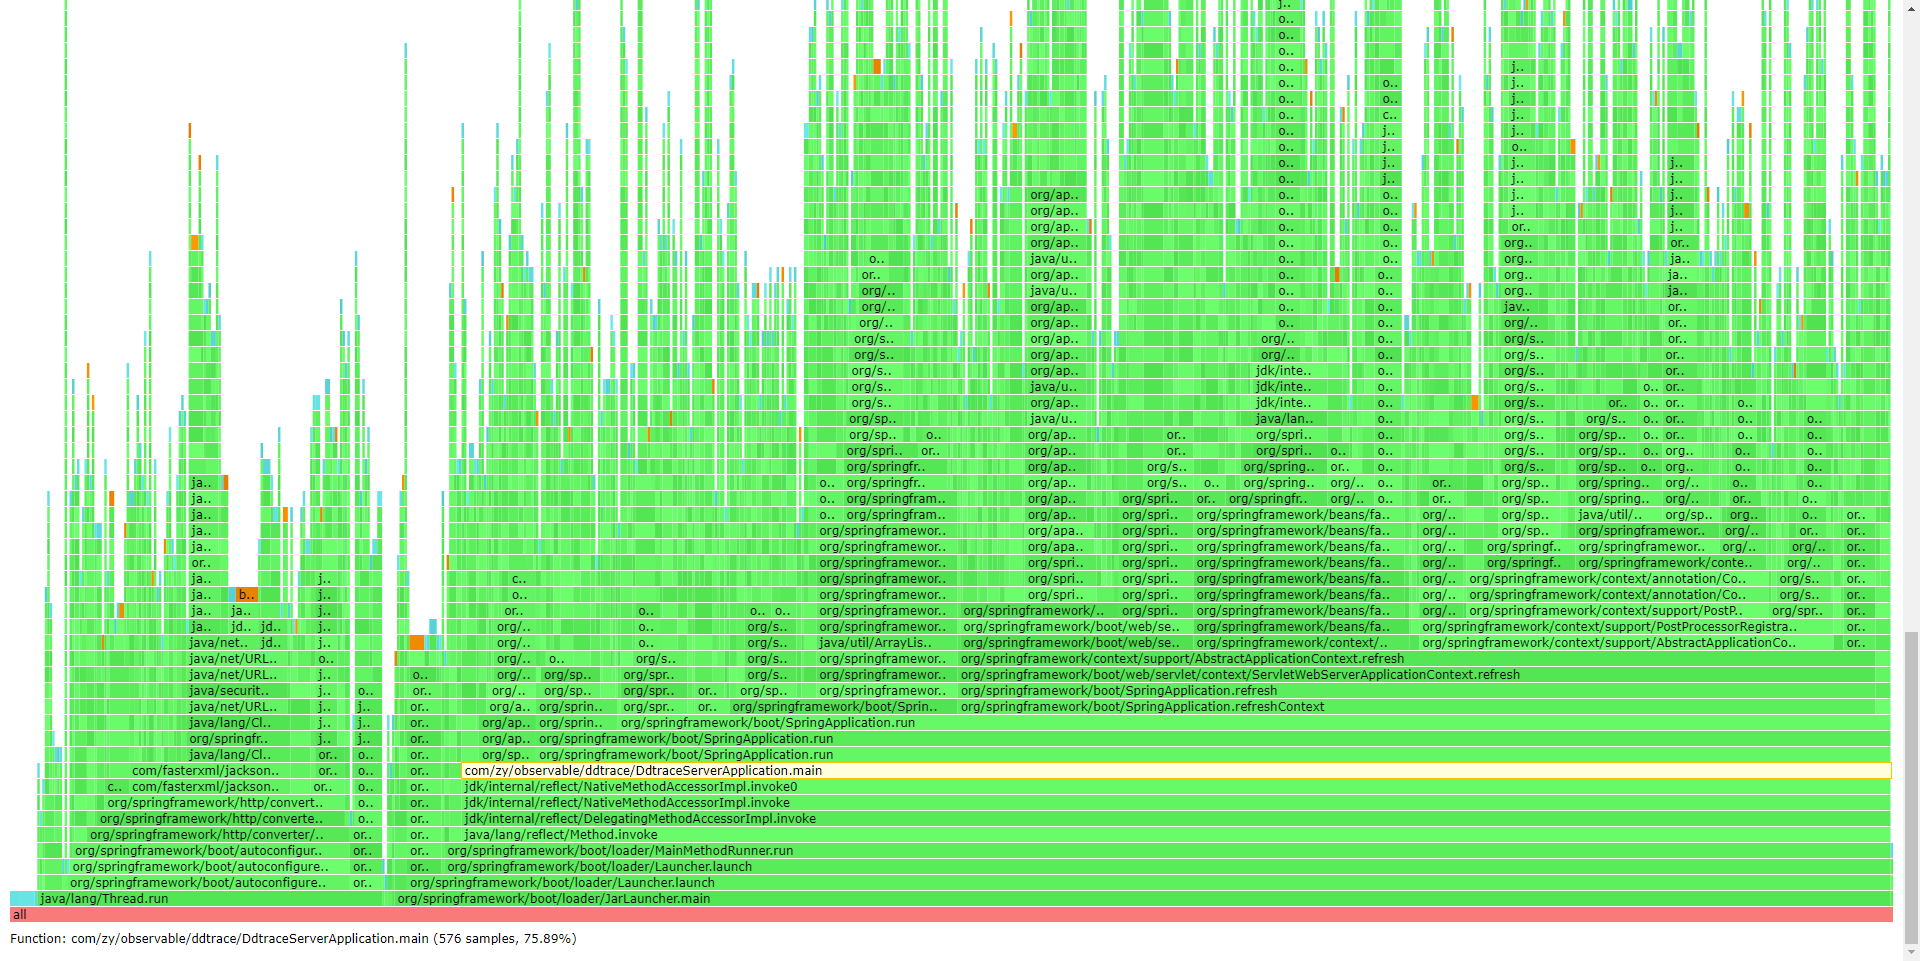
- Profiling View
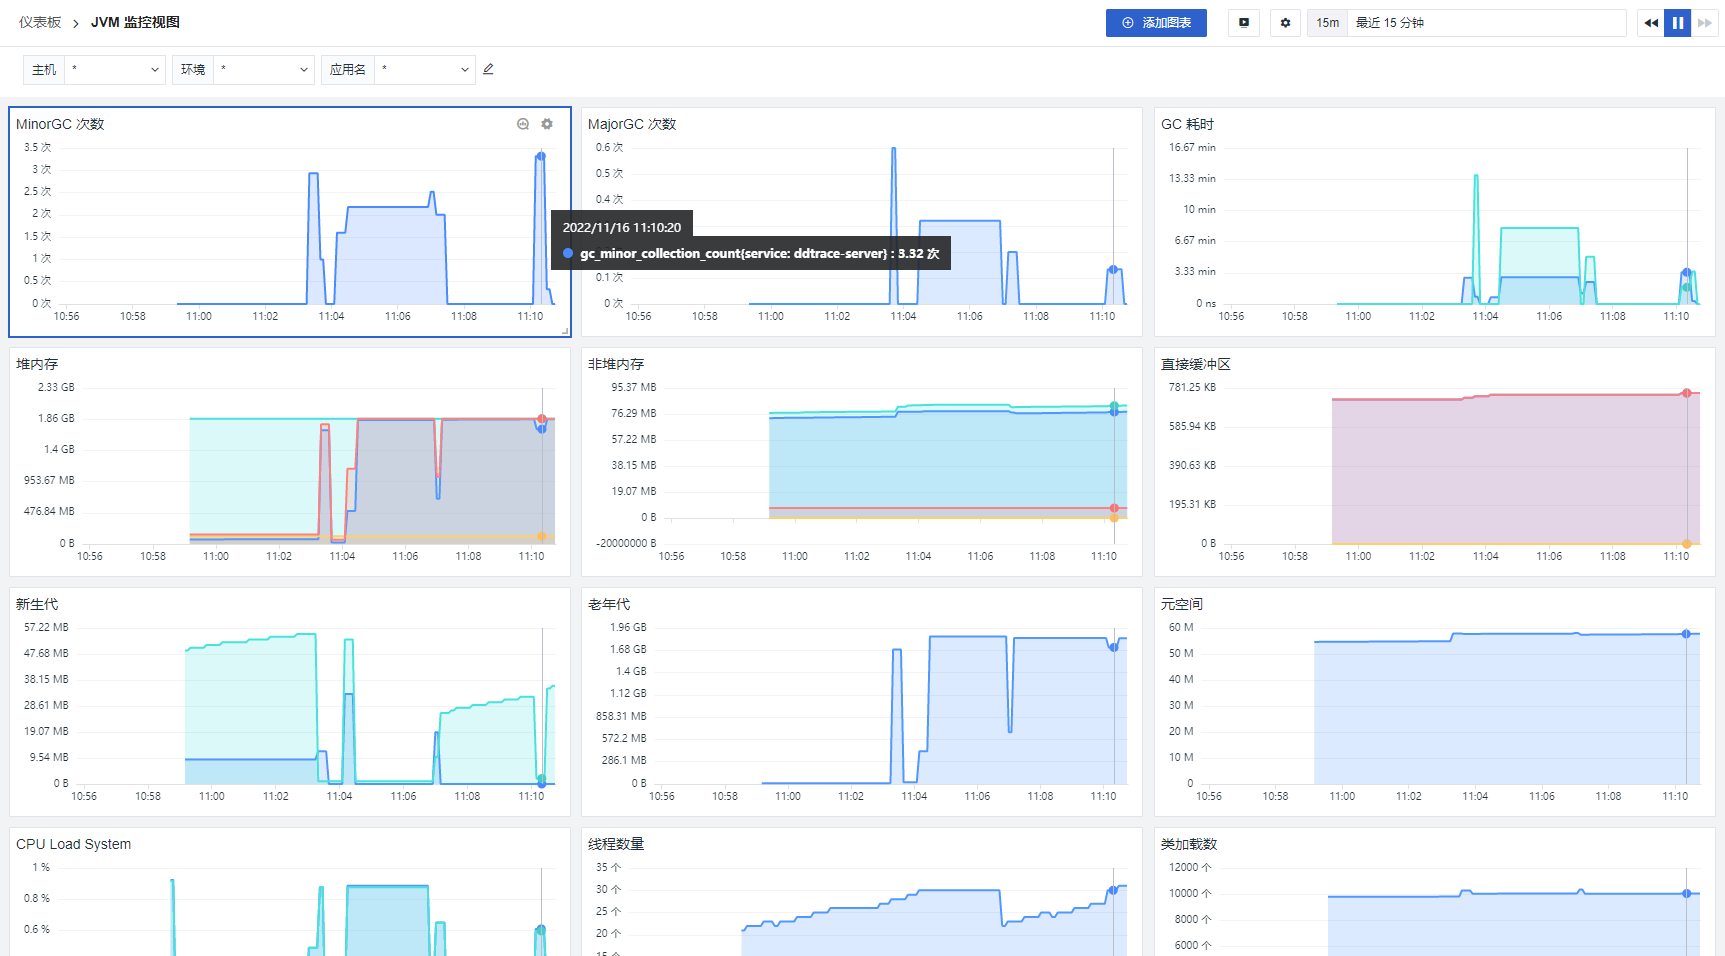
- JVM View
- Trace View
4 Summary
About TLAB
TLAB stands for Thread Local Allocation Buffer, a concept related to Java memory allocation. It is a thread-dedicated memory allocation area created when a thread creates objects. It primarily solves the issue of reducing memory allocation contention in multi-threaded environments. When a thread needs to allocate memory, it prioritizes allocation within its own region, eliminating the need for locking or protective operations.
Note
For most JVM applications, most objects are allocated within TLABs. If there are too many allocations outside TLABs or too many TLAB re-allocations, check your code for large objects or irregularly sized allocations to optimize the code.
Allocations in New TLAB Size
Primarily collects jdk.ObjectAllocationInNewTLAB events, referred to as "slow TLAB allocations."
Allocations Outside TLAB Size
Primarily collects jdk.ObjectAllocationOutsideTLAB events, referred to as "allocations outside TLAB."
Profiling Tool Comparison