InfluxDB Time Series Overview
Software Overview
InfluxDB is an open-source distributed time series and metrics database, written in Go.
Industry Position
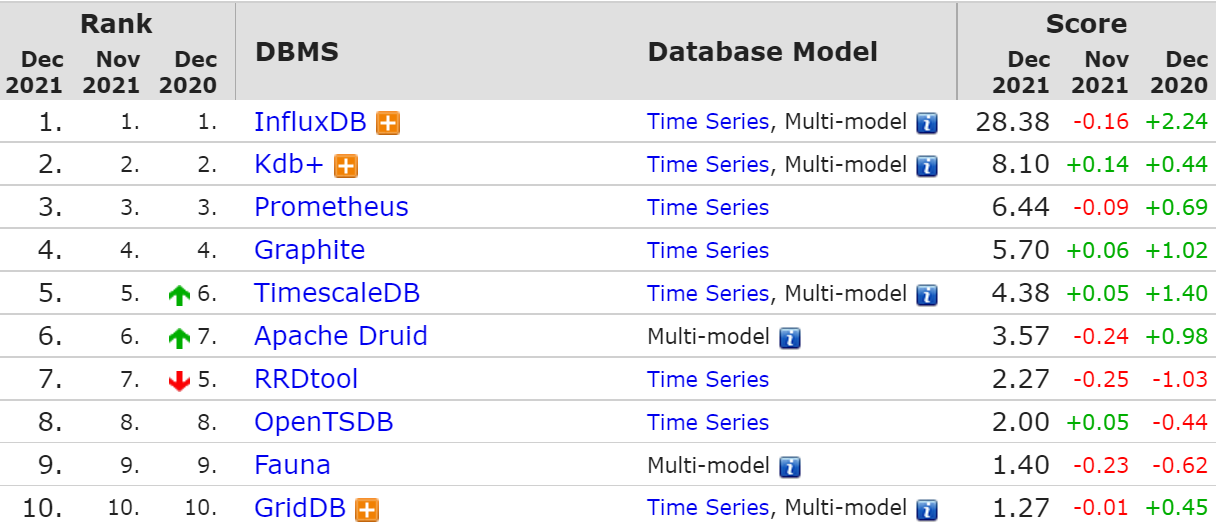
InfluxDB has consistently held the top position. In the latest time series database rankings, InfluxDB leads the second-place Kdb+ by a margin of three Prometheus.
Basic Concepts
- Database: A database.
- Measurement: A data table, analogous to a table in MySQL.
- Field: Key-value pairs that record actual data in InfluxDB (mandatory, not indexed).
- Field Set: A collection of field key-value pairs.
- Field Key: The key in a field key-value pair.
- Field Value: The value in a field key-value pair (the actual data).
- Tag: Key-value pairs used to describe fields (optional in InfluxDB, indexed).
- Tag Set: A collection of tag key-value pairs.
- Tag Key: The key in a tag key-value pair.
- Tag Value: The value in a tag key-value pair.
- Timestamp: The date and time associated with a data point.
Advanced Concepts
- Retention Policy: The data storage duration (default is
autogen, which retains data forever). - Series: A time series is composed of three parts: Retention Policy, Measurement, and Tag Set.
| Series Number | Retention Policy | Measurement | Tag Set |
|---|---|---|---|
| Series 1 | autogen | weather | province=Zhejiang, city=Wenzhou |
| Series 2 | autogen | weather | province=Zhejiang, city=Shaoxing |
| Series 3 | autogen | weather | province=Jiangsu, city=Changzhou |
| Series 4 | autogen | weather | province=Jiangsu, city=Wuxi |
- Point: A field set with the same timestamp within a series. It can be thought of as a row of data in a table.
| Timestamp | Measurement | Tag Set | Field Set |
|---|---|---|---|
| 2021-12-12T00:00:00Z | disk | host=a, path=/ | free=40836976, used=20836976 |
- Line Protocol: A text format for writing data points into InfluxDB.
# Convert the Point from the table above to line protocol
disk,host=a,path=/ free=40836976,used=20836976 1639238400000000000
Hands-On Practice
1. Software Installation
Add the InfluxData yum repository.
cat <<EOF | tee /etc/yum.repos.d/influxdb.repo
[influxdb]
name = InfluxDB Repository - RHEL \$releasever
baseurl = https://repos.influxdata.com/rhel/\$releasever/\$basearch/stable
enabled = 1
gpgcheck = 1
gpgkey = https://repos.influxdata.com/influxdb.key
EOF
2. Data Query
Since this is a local installation, use the influx command to access the database directly (see influx -h for more parameters).
Select the telegraf measurement and query data using the SELECT command (query language is InfluxQL).
The output shows 3 points, each consisting of four parts (measurement, timestamp, tag set, field set).

Measurement
- name = system
Timestamp
- time = 1637744500000000000 (nanoseconds)
Tag Set
- host = df-solution-ecs-018
Field Set
- load = 0, load15 = 0, load5 = 0.01, n_cpus = 4, n_users = 5, uptime = 1106990, uptime_format = 12days,19:29
3. View Time Series
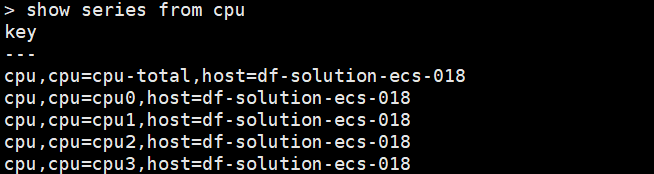
Use the SHOW SERIES command to view time series.
The output shows that the measurement cpu has 5 series (cpu-total, cpu0, cpu1, cpu2, cpu3; all with the same host).
4. Time Series Test
4.1 Add inputs.tags (Plugin Tags)
In the main configuration file /etc/telegraf/telegraf.conf, add inputs.cpu.tags.
[[inputs.cpu]]
  percpu = true
  totalcpu = true
  collect_cpu_time = false
  report_active = false
[inputs.cpu.tags]
  cloud = 'aliyun'
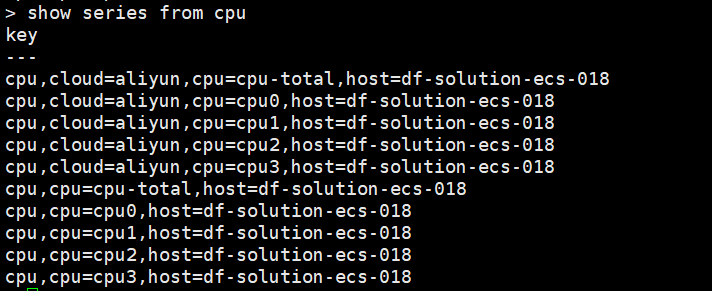
SHOW SERIES command to view time series.
The measurement cpu now has 10 series (increased from 5).
4.2 Drop a Measurement
Use the DROP MEASUREMENT command to drop a measurement.
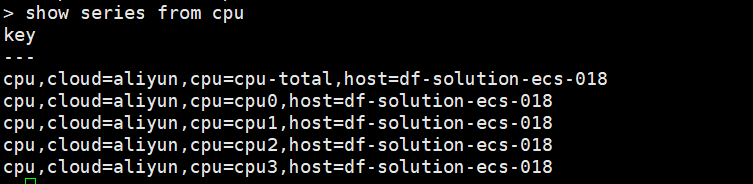
Use SHOW SERIES again to view time series.
The measurement cpu now has 5 series (cpu-total, cpu0, cpu1, cpu2, cpu3; all with the same host and cloud tags).
4.3 Add global_tags (Global Tags)
In the main configuration file /etc/telegraf/telegraf.conf, add global_tags.
Restart Telegraf.
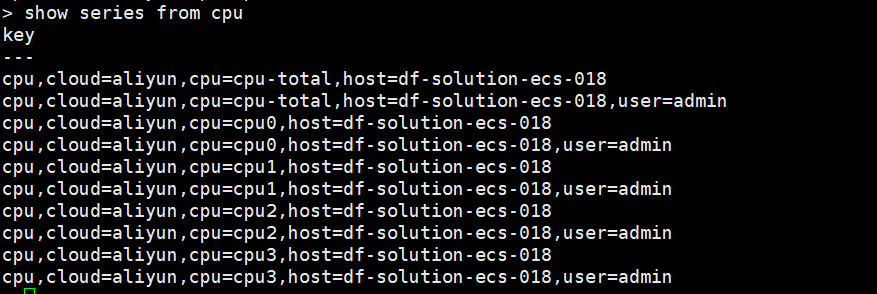
Use SHOW SERIES to view time series.
The measurement cpu now has 10 series again (increased from 5).
Use SHOW SERIES to view time series of another measurement.
The measurement mem now has 2 series (increased from 1).

Brief Analysis
- Retention Policy remains unchanged.
- Using plugin tags doubles the number of series for that measurement.
- Using global tags doubles the number of series for that database.
-
If the measurement also remains unchanged, the more tag combinations there are, the more series there are.
-
Measurement:
-
Once dropped, all series under that measurement are cleaned up.
-
Tag:
- Should generally be enumerable, e.g., hostname, status.
- Must not be random values, as this would generate a large number of series, e.g., container ID, source IP.