Best Practices for Observability of Page Channel Referral Traffic
1: Background
For marketing teams, it is critical to understand how users are referred from different channels to landing pages and registration pages. How do you record which page a user came from before visiting the ad page? And how many times each page was visited? How do you record the number of clicks on a button on a specific page?
2: Guance Solution
2.1: How to Analyze Page Source
[View Attributes]
| Field | Type | Description |
|---|---|---|
| view_id | string | Unique ID generated each time a page is visited |
| is_active | boolean | Indicates whether the user is still active, reference values: true | false |
| view_loading_type | string | Page loading type, reference values: initial_load | route_change route_change indicates SPA page loading mode |
| view_referrer | string | Page source |
| view_url | string | Page URL |
| view_host | string | Host part of the page URL |
| view_path | string | Path part of the page URL |
| view_path_group | string | Path group of the page URL |
| view_url_query | string | Query part of the page URL |
As shown above, in Real User Monitoring (RUM), the view_referrer field (page source) is already collected. You can use this for page source analysis.
2.2: How to Count Button Clicks on a Page
[Action Attributes]
| Field | Type | Description |
|---|---|---|
| action_id | string | Unique ID generated when a user performs an action on the page |
| action_name | string | Action name |
| action_type | string | Action type |
As shown above, in RUM, the action_name field (button name) is already collected. You can use this for button click count analysis.
For more metrics, see: Web Application Data Collection
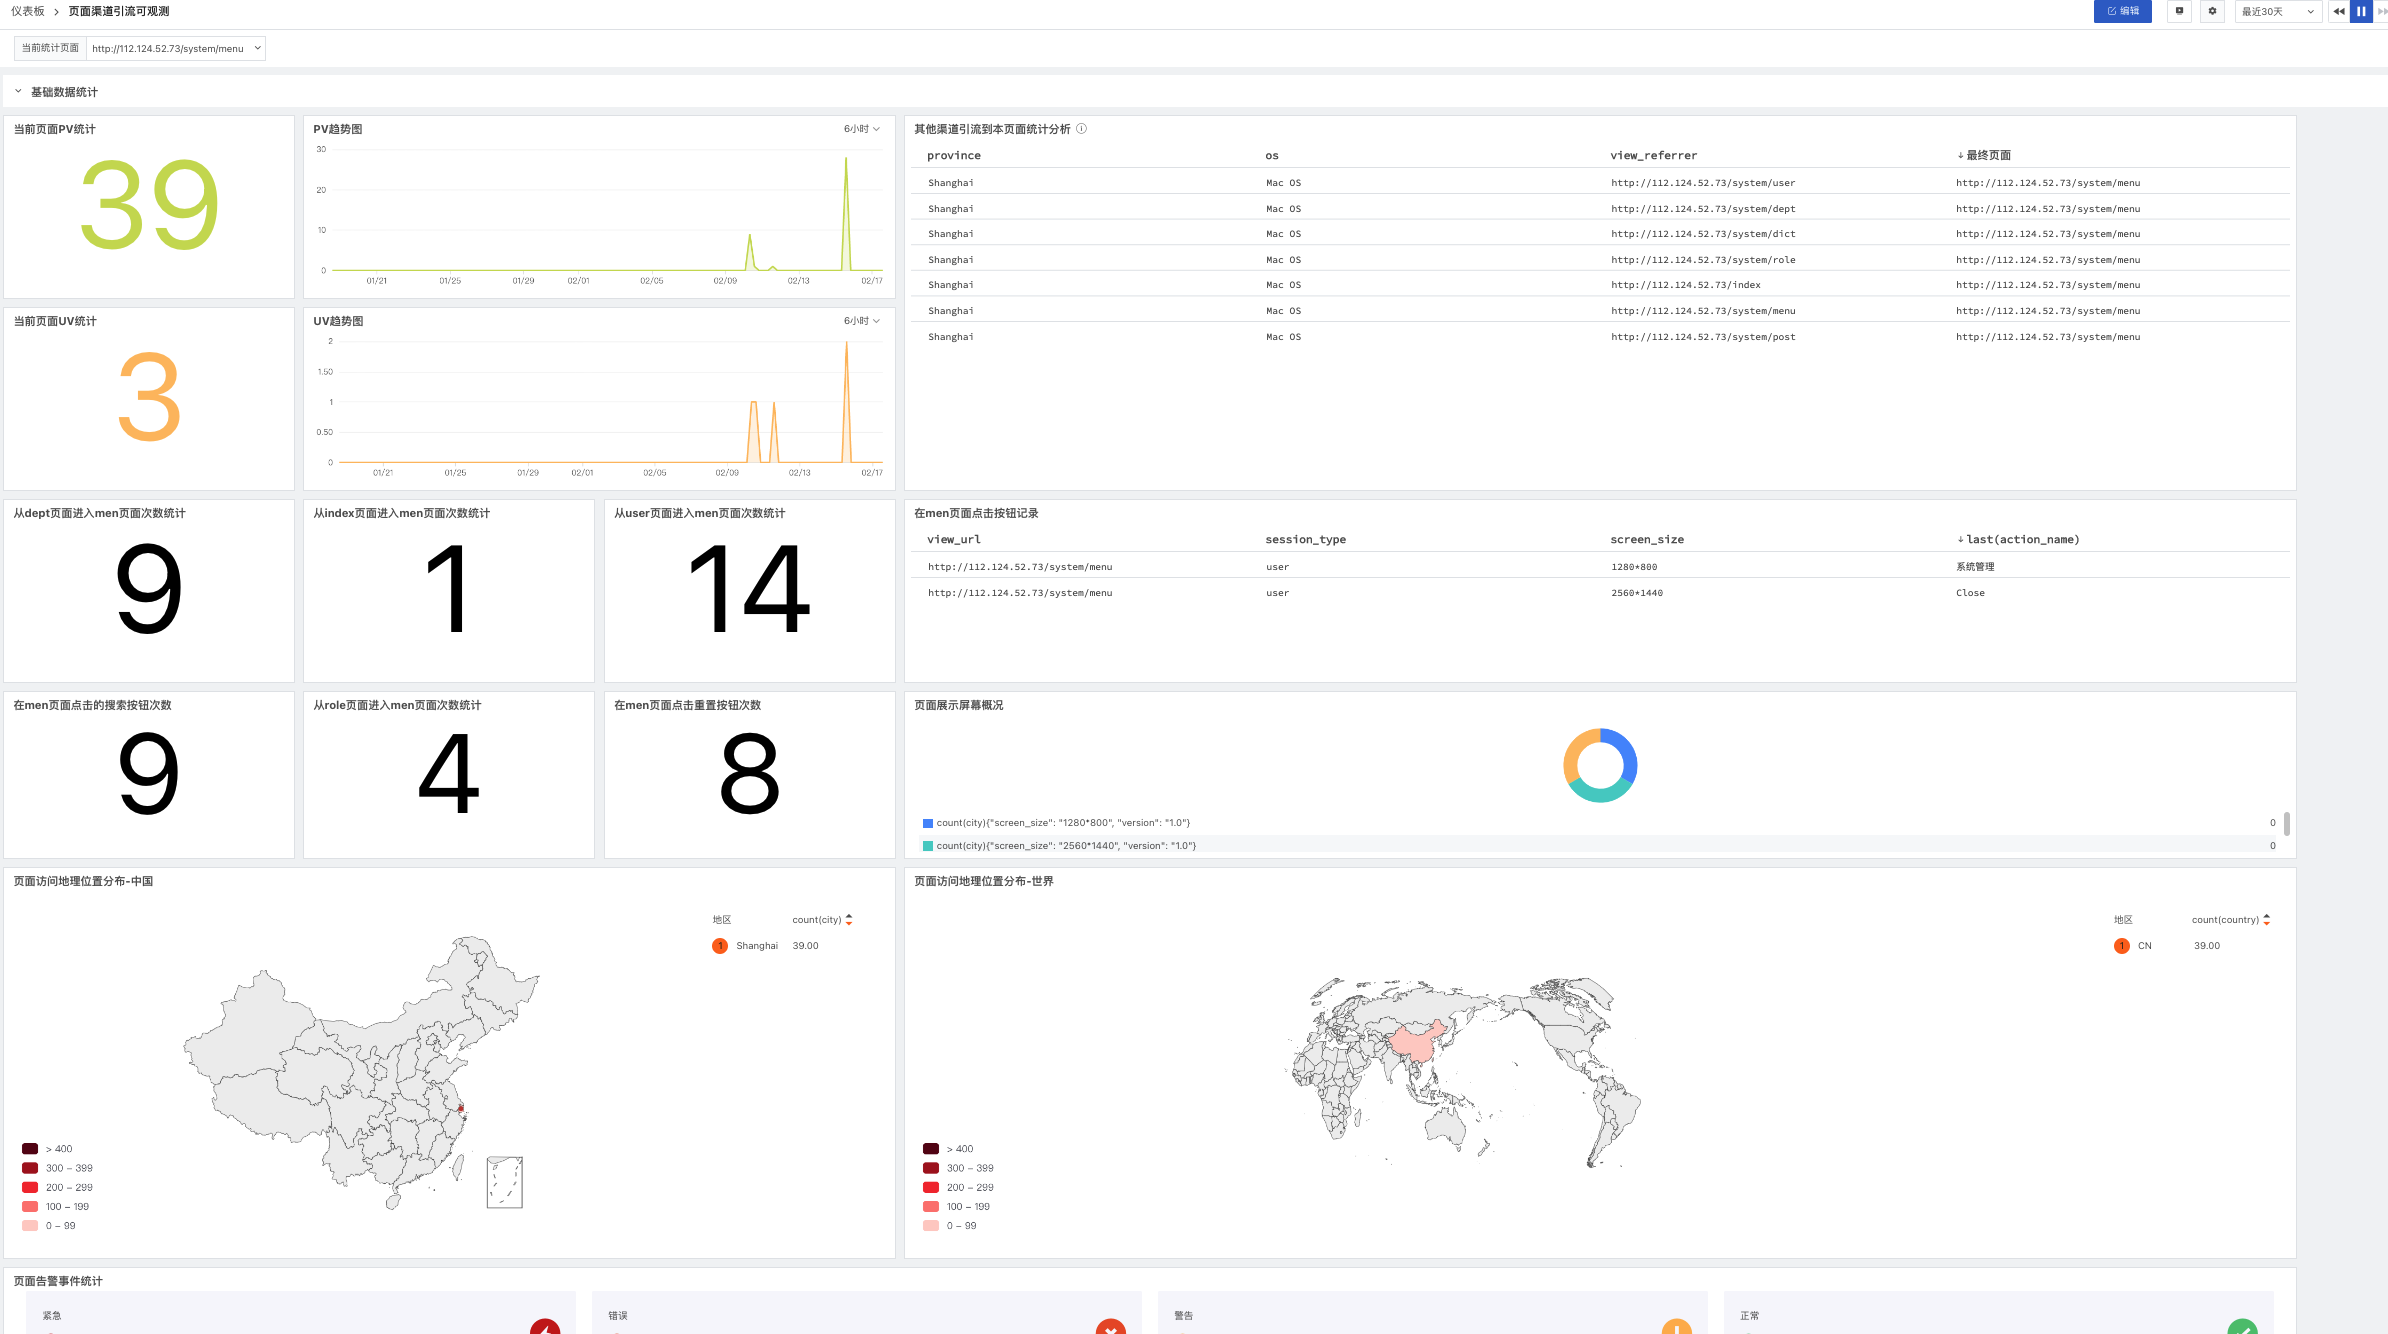
3: Final Effect
4: Implementation Steps
4.1: Integrate the RUM SDK
Choose the integration method that fits your actual scenario.
- Web integration: Web RUM Integration
- App integration: iOS RUM Integration / Android RUM Integration
- Mini program integration: Mini Program RUM Integration
4.2: Create a New Dashboard in the Scenario
a: Create a chart titled "Referral Count from Page A to Page B" (B is the campaign page)
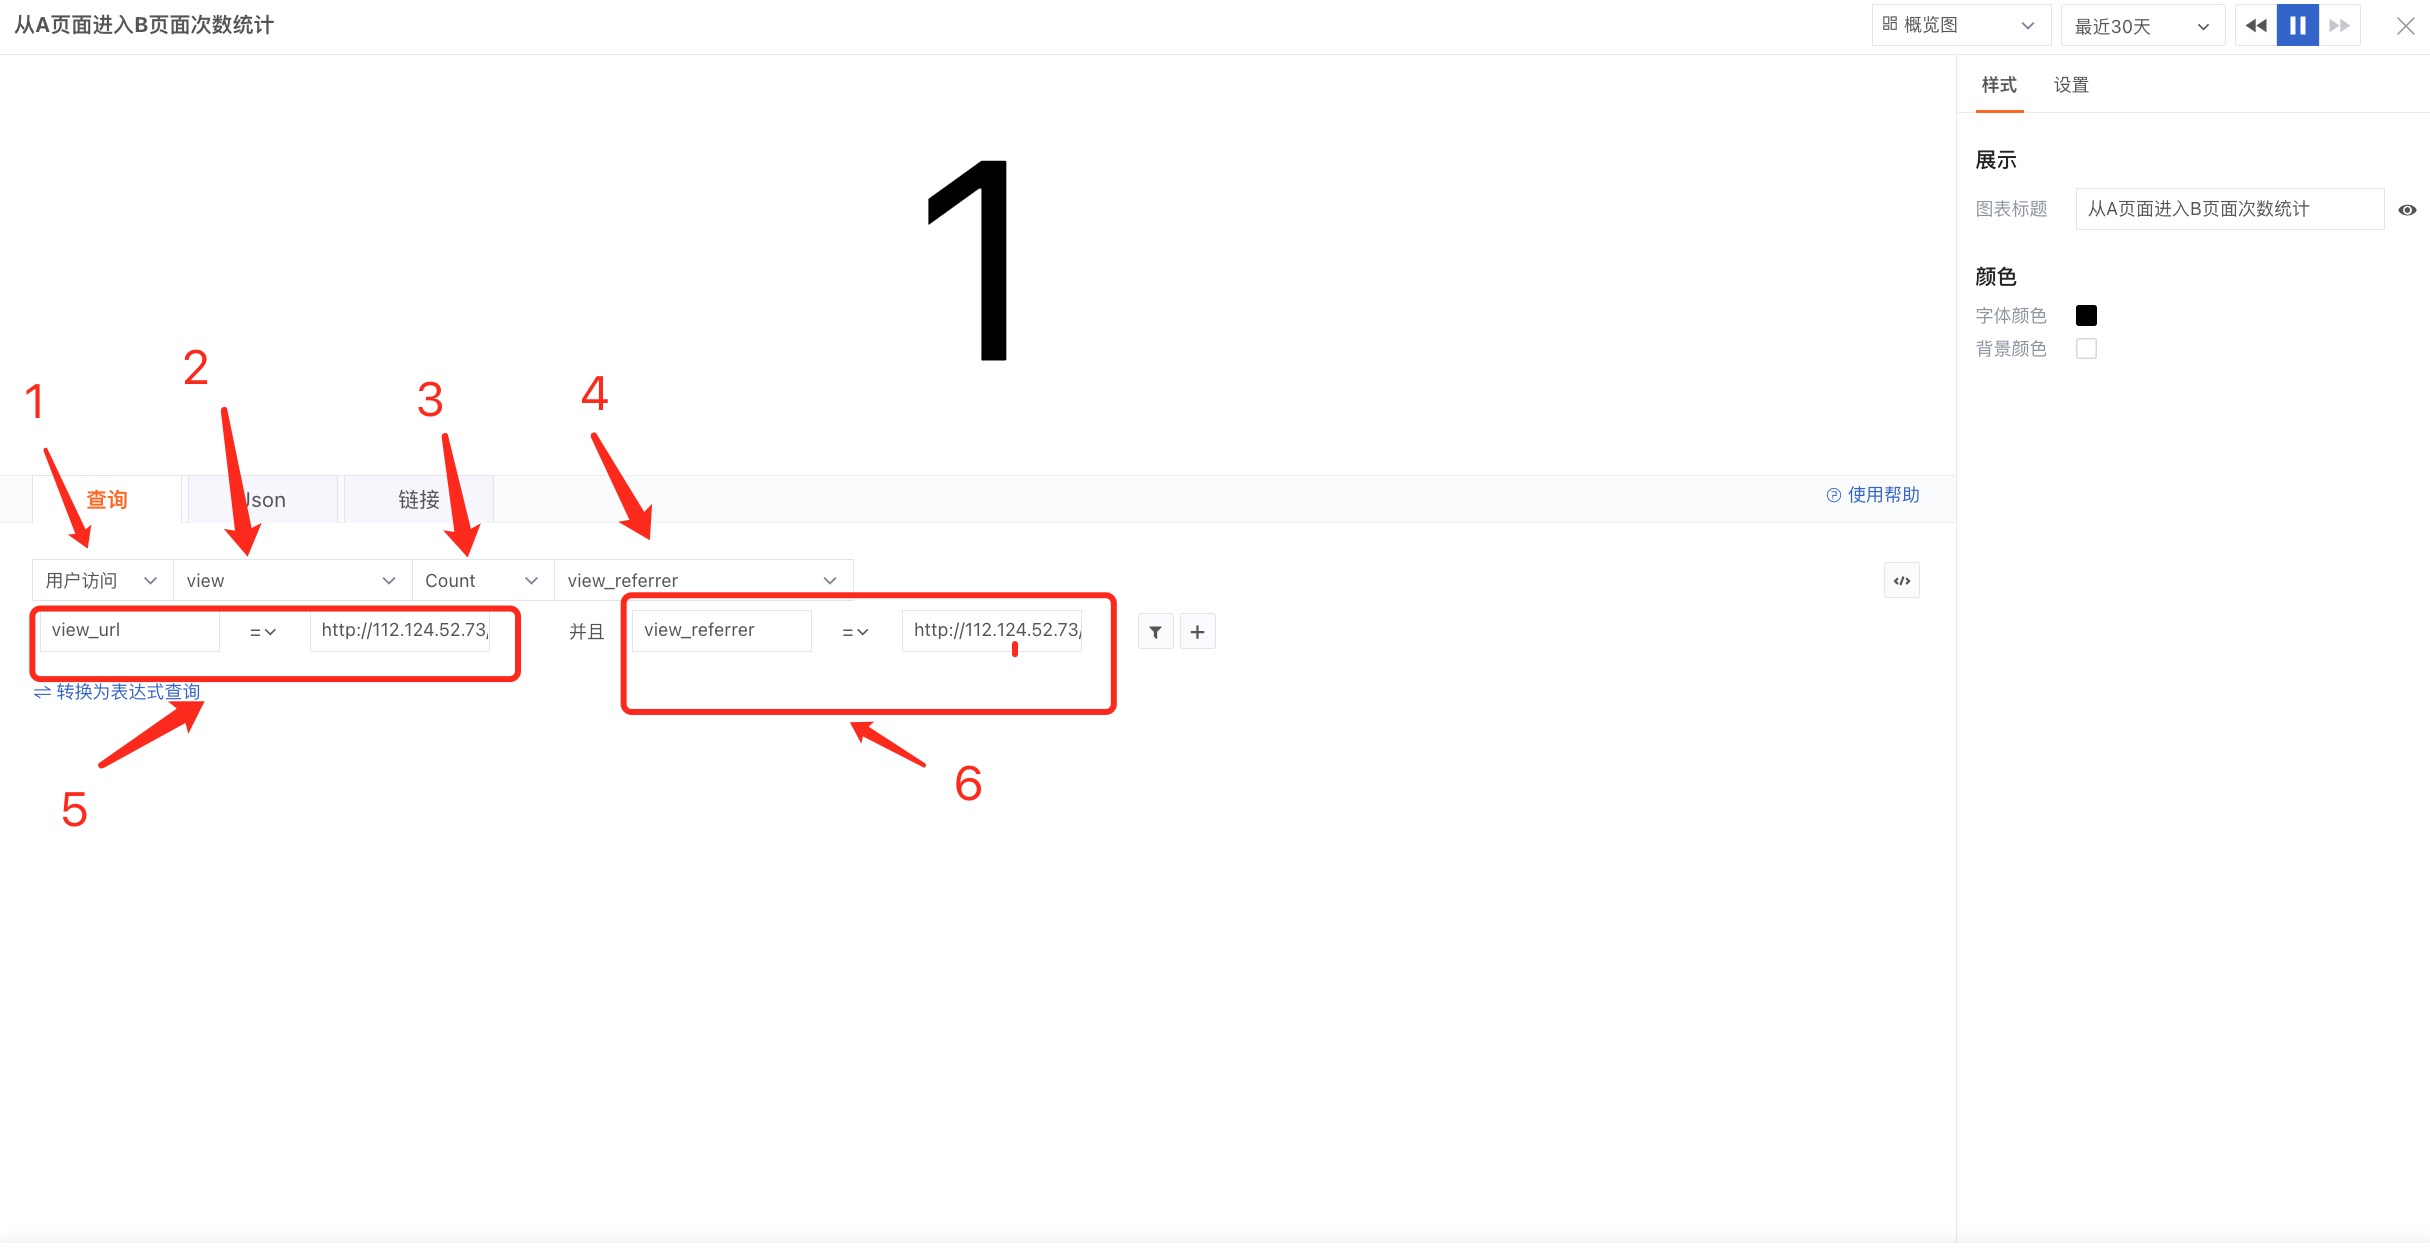
The chart records the number of times users navigated from the address entered in step 6 to the address in step 5.
- In the list, select "User Access" (RUM)
- In the list, select "view"
- In the list, select "count" – this records the count, so use count
- In the list, select "view_referrer" – this indicates the page source
- This is a filter condition: set
view_urlto the address of page B (the campaign page being monitored) - This is another filter condition: set
view_referrerto the address of page A (the source page)
Note: If you have multiple sources, e.g., C → B, simply replace the view_referrer with the address of page C, and so on.
b: Create a chart titled "Button Click Count on Page A"
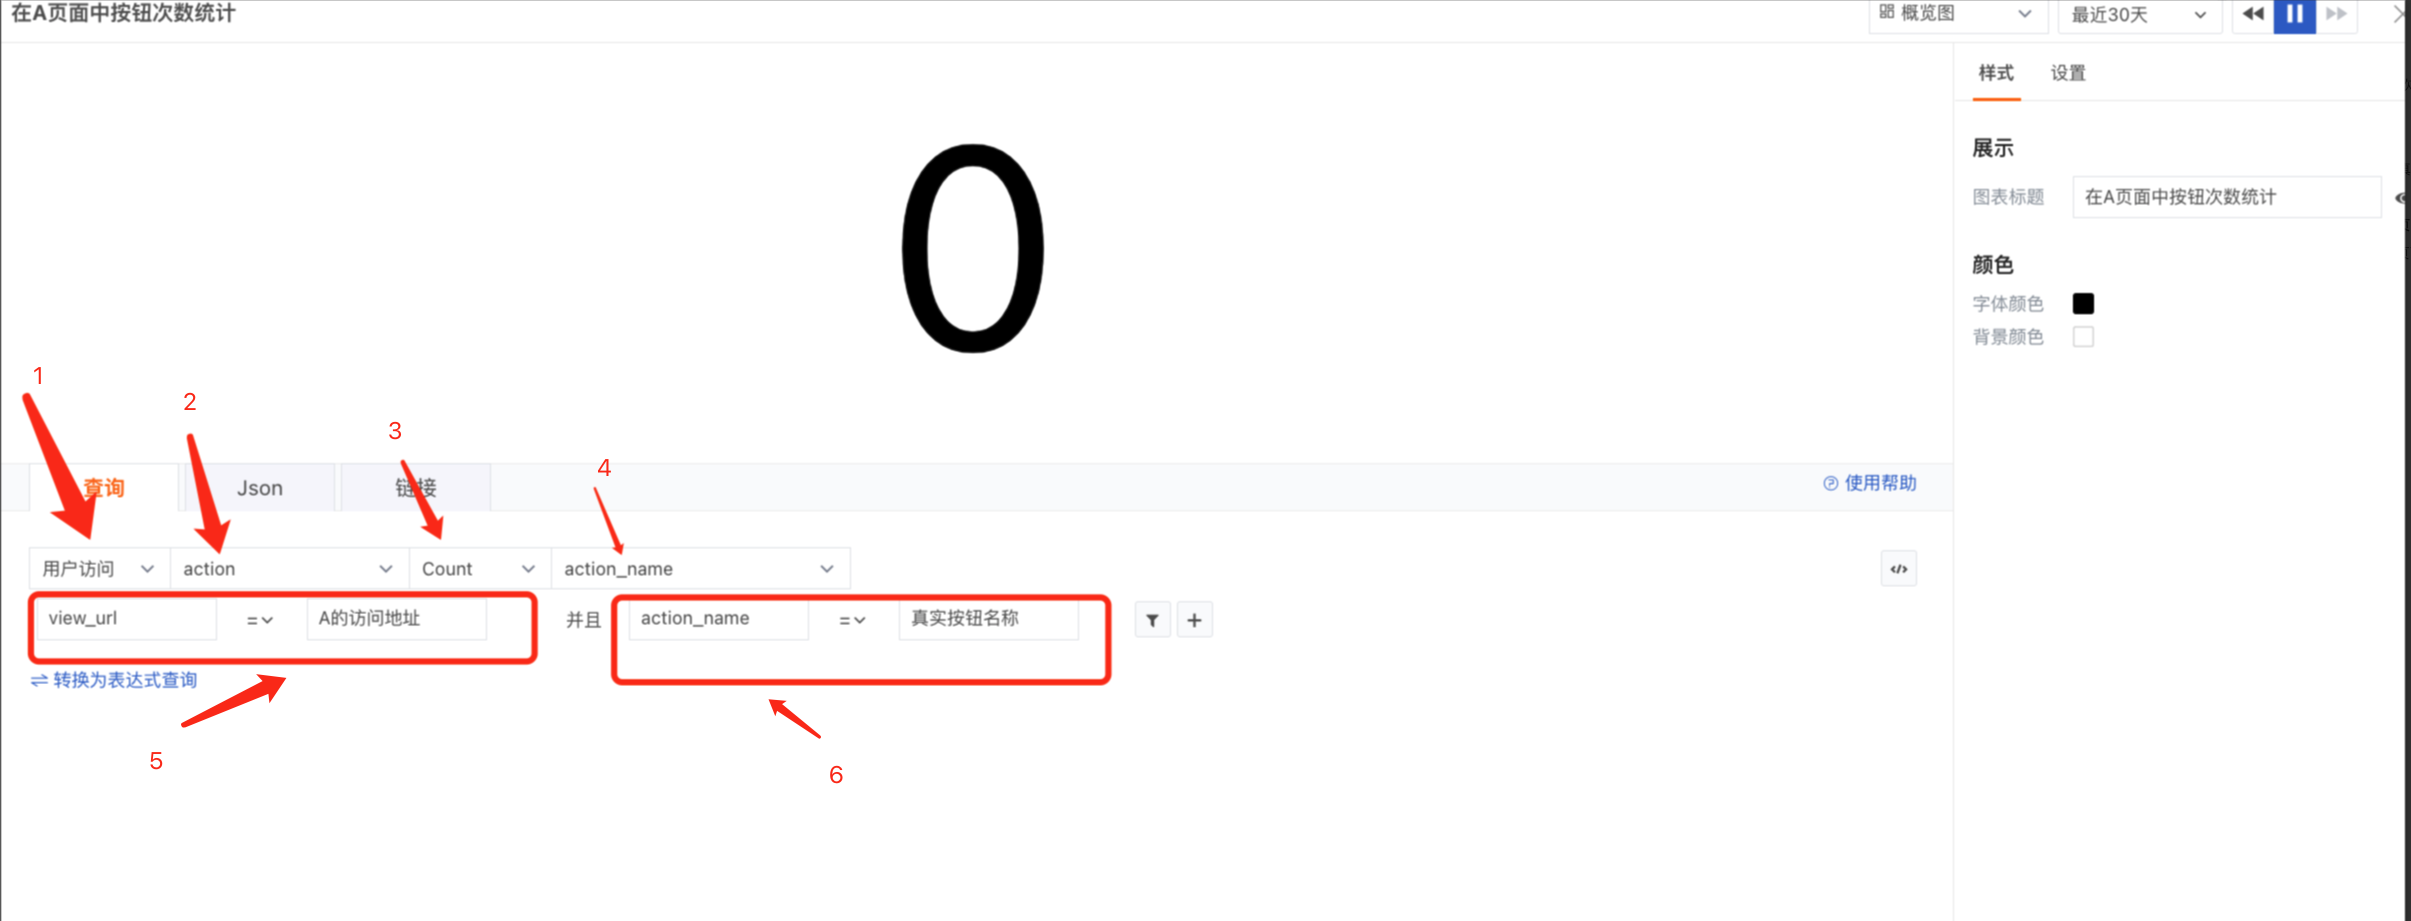
The chart records the number of times buttons were clicked on page A.
- In the list, select "User Access" (RUM)
- In the list, select "action"
- In the list, select "count" – this records the count, so use count
- In the list, select "action_name" – the button name
- This is a filter condition: set
view_urlto the address of page A (the page whose buttons you want to monitor) - This is another filter condition: set
action_nameto the display name of the button, e.g., "Manage", "Reset", "+ New"
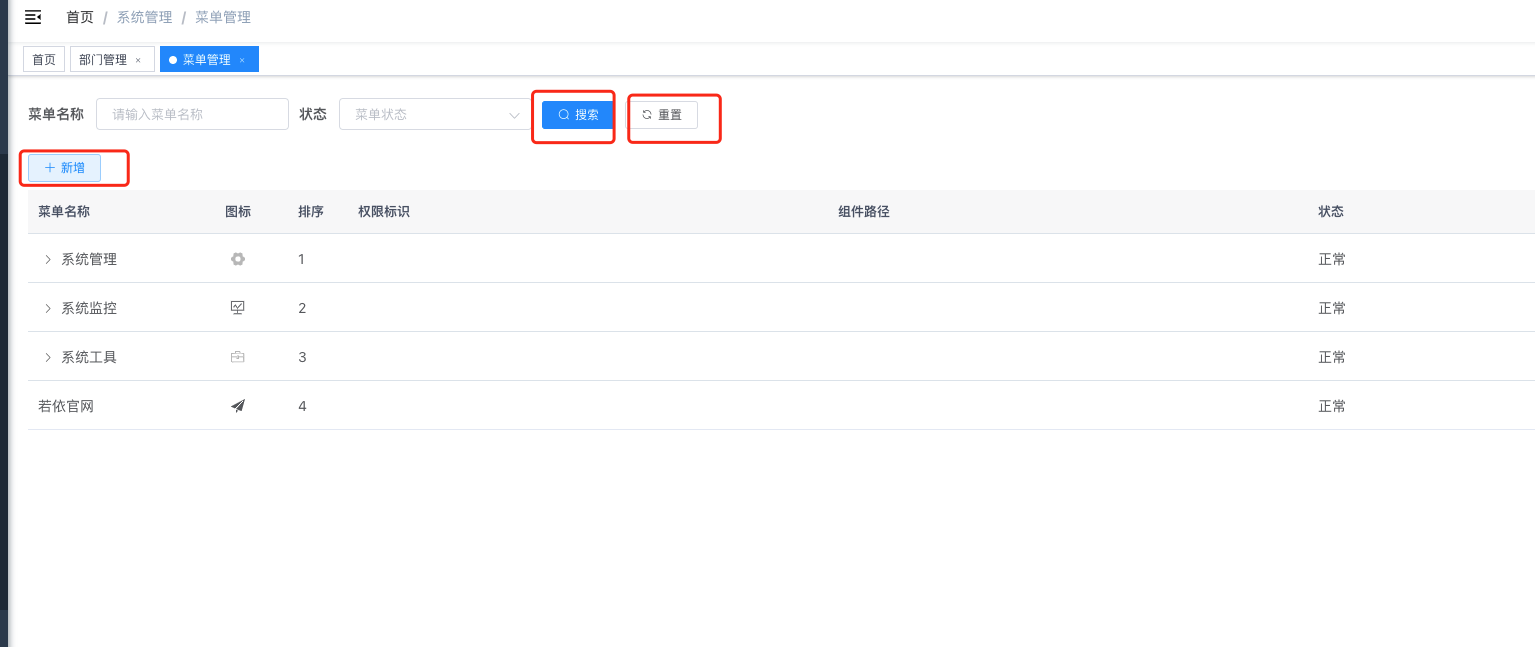
Note: If you need to track multiple buttons, repeat this process.
c: Create a map titled "Geographic Distribution of Page A Visits – China"
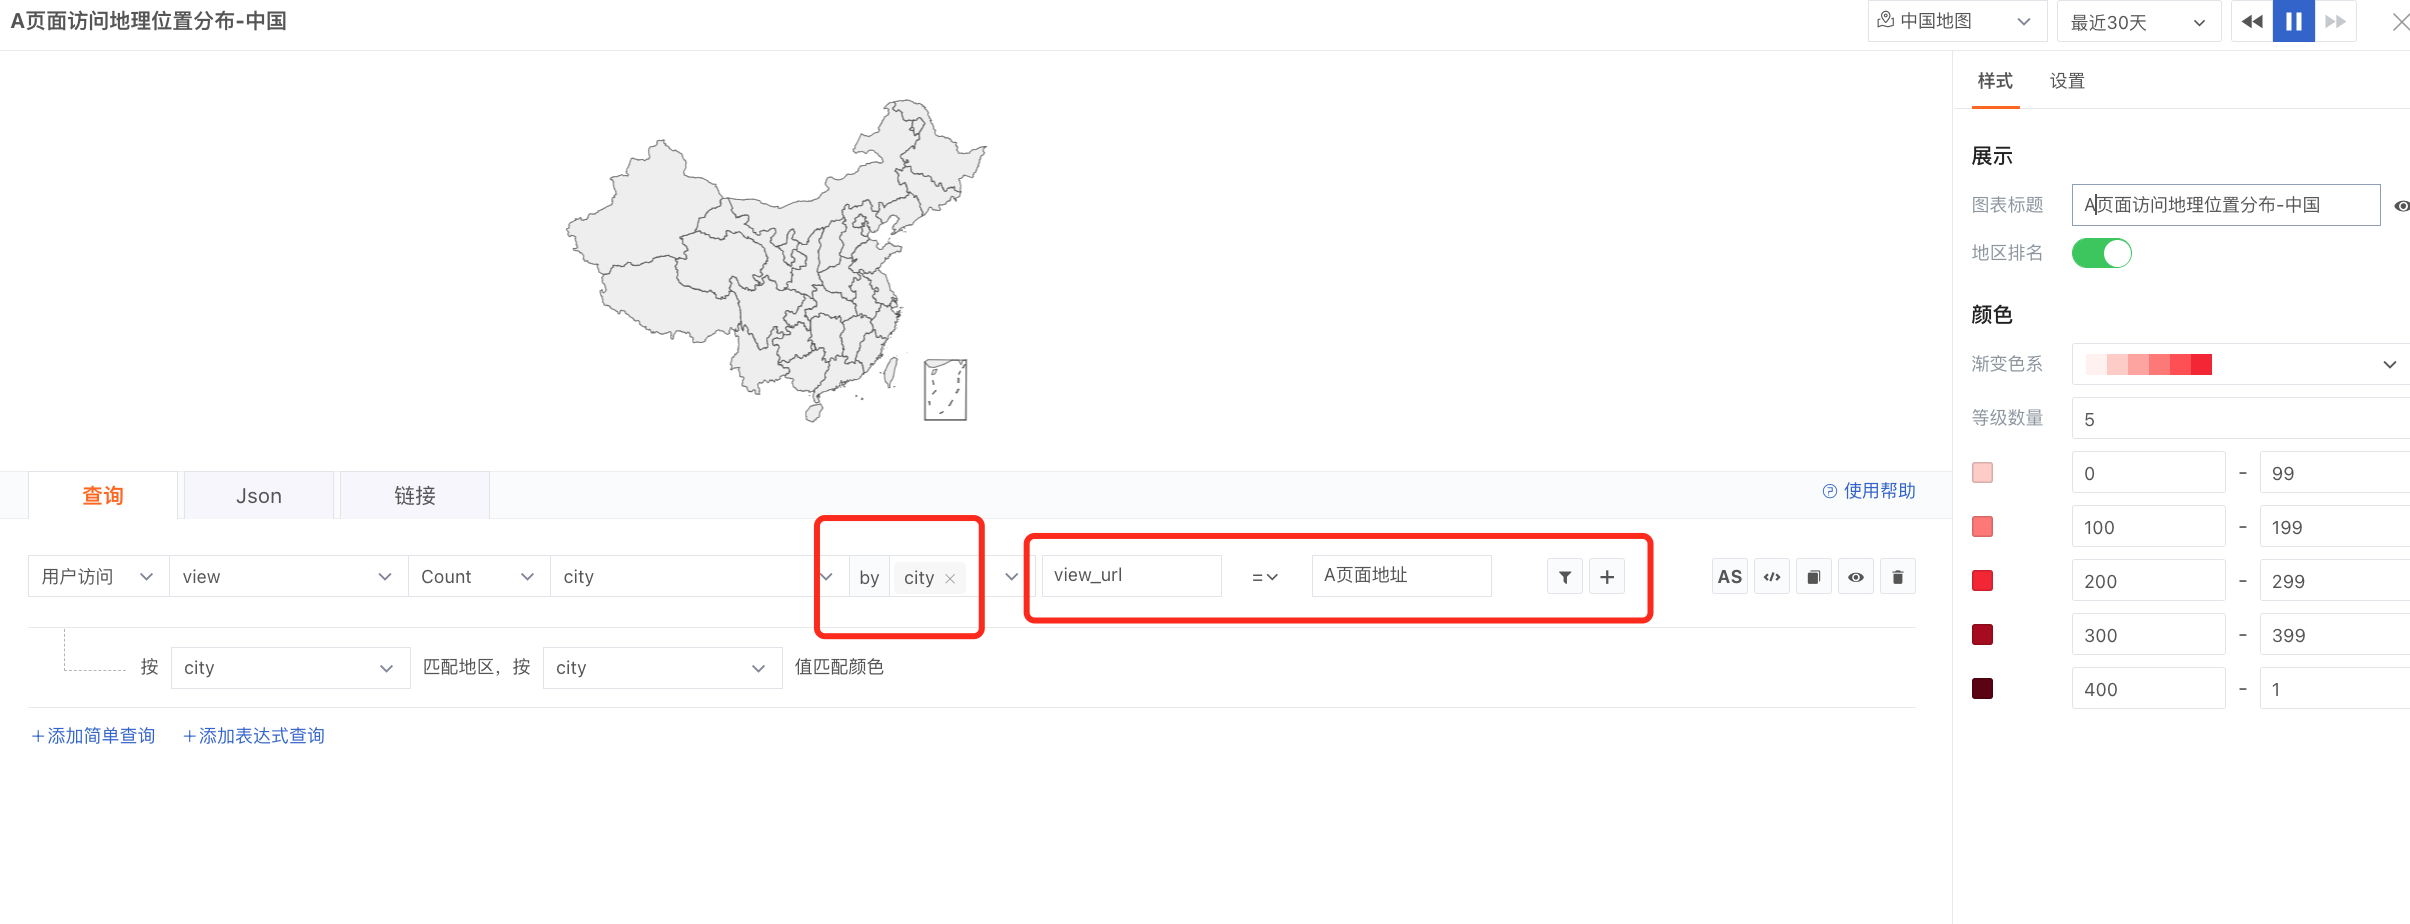
The filter condition is the address of page A.
Note: The world map is similar to the China map.
Summary
After integrating web monitoring, Guance collects a wide range of metrics. You can use these metrics to track traffic sources (which page or button the user came from) with minimal effort, enabling statistical analysis.