Security Check Explorer
- Version: 1.0.7-7-g251eead
- Release Date: 2023-04-06 11:17:57
- Supported Operating Systems: windows/amd64,windows/386,linux/arm,linux/arm64,linux/386,linux/amd64
Introduction
Guance supports you in monitoring, querying, and correlating all security check events through "Security Check". It helps you improve the quality of inspections, problem analysis, and problem resolution while promptly identifying vulnerabilities, anomalies, and risks.
Overview
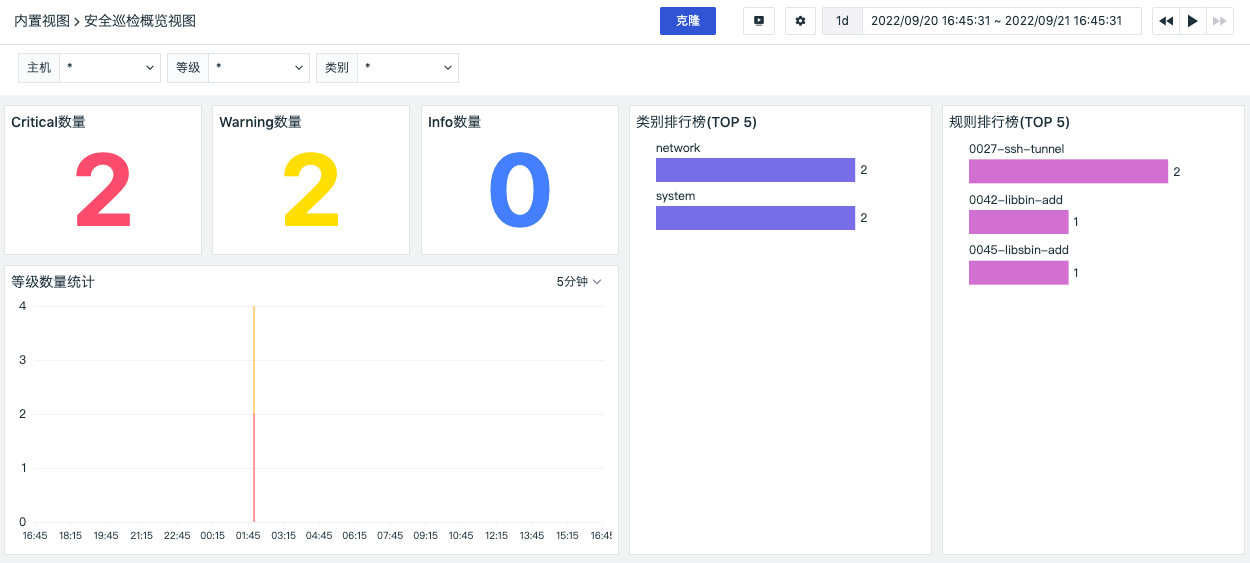
In "Security Check" - "Overview", Guance provides a default security check monitoring view for you. You can filter by HOST, security check level, and security check category to view an overview of security check events occurring on different hosts. This includes the number of security check events of different levels and visual chart analysis, as well as rankings of security check events of different categories and rules.
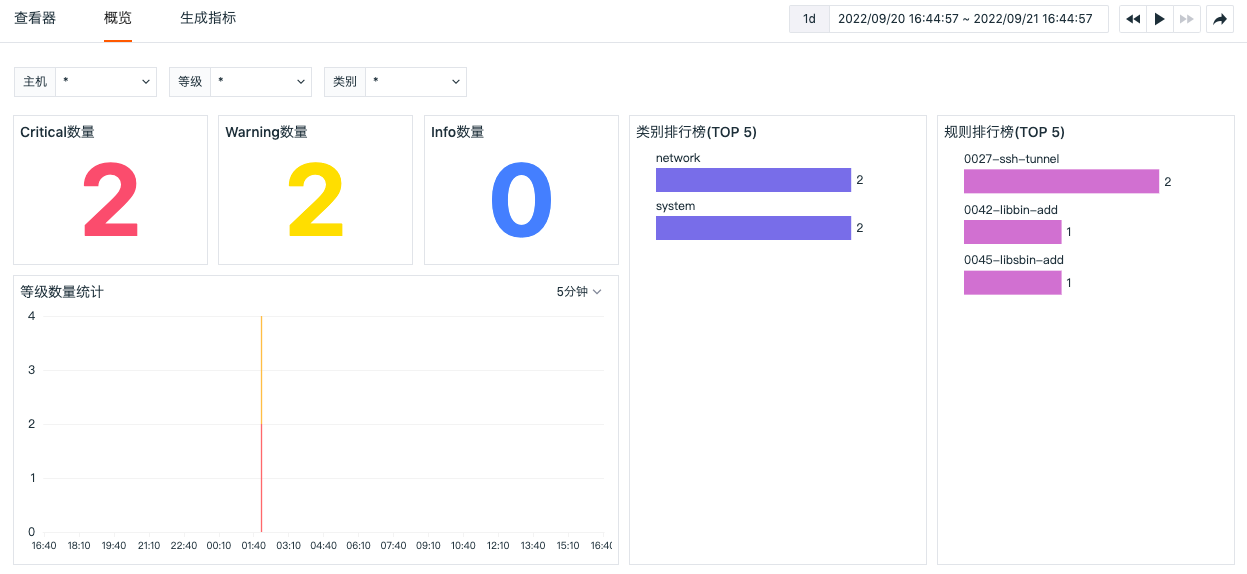
At the same time, you can jump to the corresponding built-in view page of the overview page via the "Jump" button for viewing and cloning and modifying the view. For more information, refer to Built-in Views.
Data Query and Analysis
In "Security Check" - "Explorer", you can query security check events through selecting time ranges, search keywords, and filtering methods.
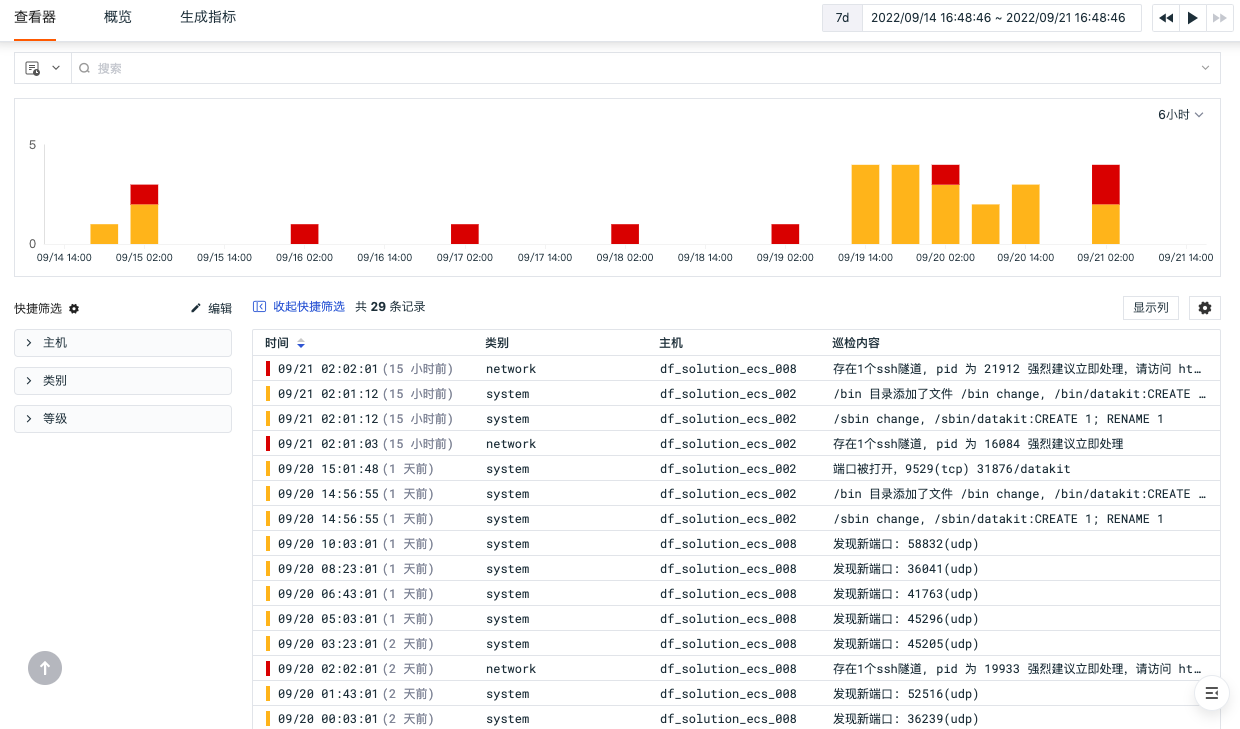
Security Check Event Statistics
Guance will count the number of security check events with different statuses based on the selected time range. You can view the number of security check events at different time points through stacked bar charts. It supports selecting different time intervals to view event statistics and exporting to dashboards, notes, or copying to the clipboard.
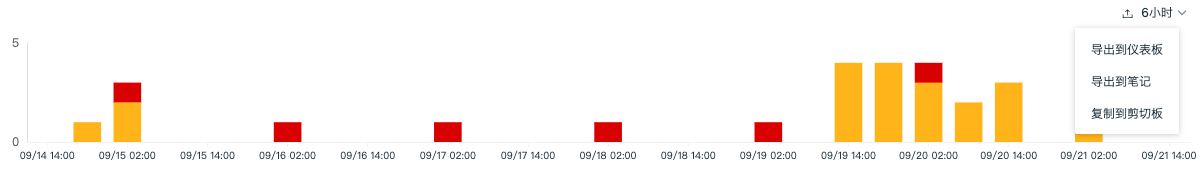
Time Widget
The Guance explorer defaults to displaying data from the last 15 minutes. Through the "Time Widget" in the upper-right corner, you can select the time range for data display.
Search and Filtering
In the explorer search bar, multiple search methods are supported, including keyword search, wildcard search, correlated search, JSON search, etc. Filtering by labels/attributes is also supported, including positive filtering, negative filtering, fuzzy matching, reverse fuzzy matching, Exist and Not exist, among others. For more details on search and filtering, refer to the documentation Explorer Search and Filter.
Quick Filters
In the quick filters section of the explorer, you can edit "quick filters" and add new filter fields. After adding, you can select field values for quick filtering. For more information on quick filters, refer to the documentation Quick Filters.
Custom Display Columns
When viewing lists, you can customize the addition, editing, deletion, and dragging of display columns via "Display Columns." When hovering over the display columns in the explorer, click the "Settings" button to support operations such as ascending order, descending order, moving columns left, moving columns right, adding columns to the left, adding columns to the right, replacing columns, adding to quick filters, adding to groups, and removing columns.
Data Export
The security check event list supports exporting current list data as a CSV file to a local device or exporting it to a scenario dashboard or note via the settings button above the list.
Save Snapshot
Guance supports creating easily accessible data copies. Through the snapshot function, you can quickly reproduce instant copied data snapshots, restoring data to a certain point in time and a certain data display logic.
You can perform searches and filters on the currently displayed data, select time ranges, add display columns, etc., then click the "Snapshot" icon in the upper-left corner of the explorer and click "Save Snapshot" to save the data content currently displayed in the explorer. In the historical snapshots, you can perform operations such as "Share Snapshot," "Copy Snapshot Link," and "Delete Snapshot." For more detailed information, refer to the documentation Snapshot.
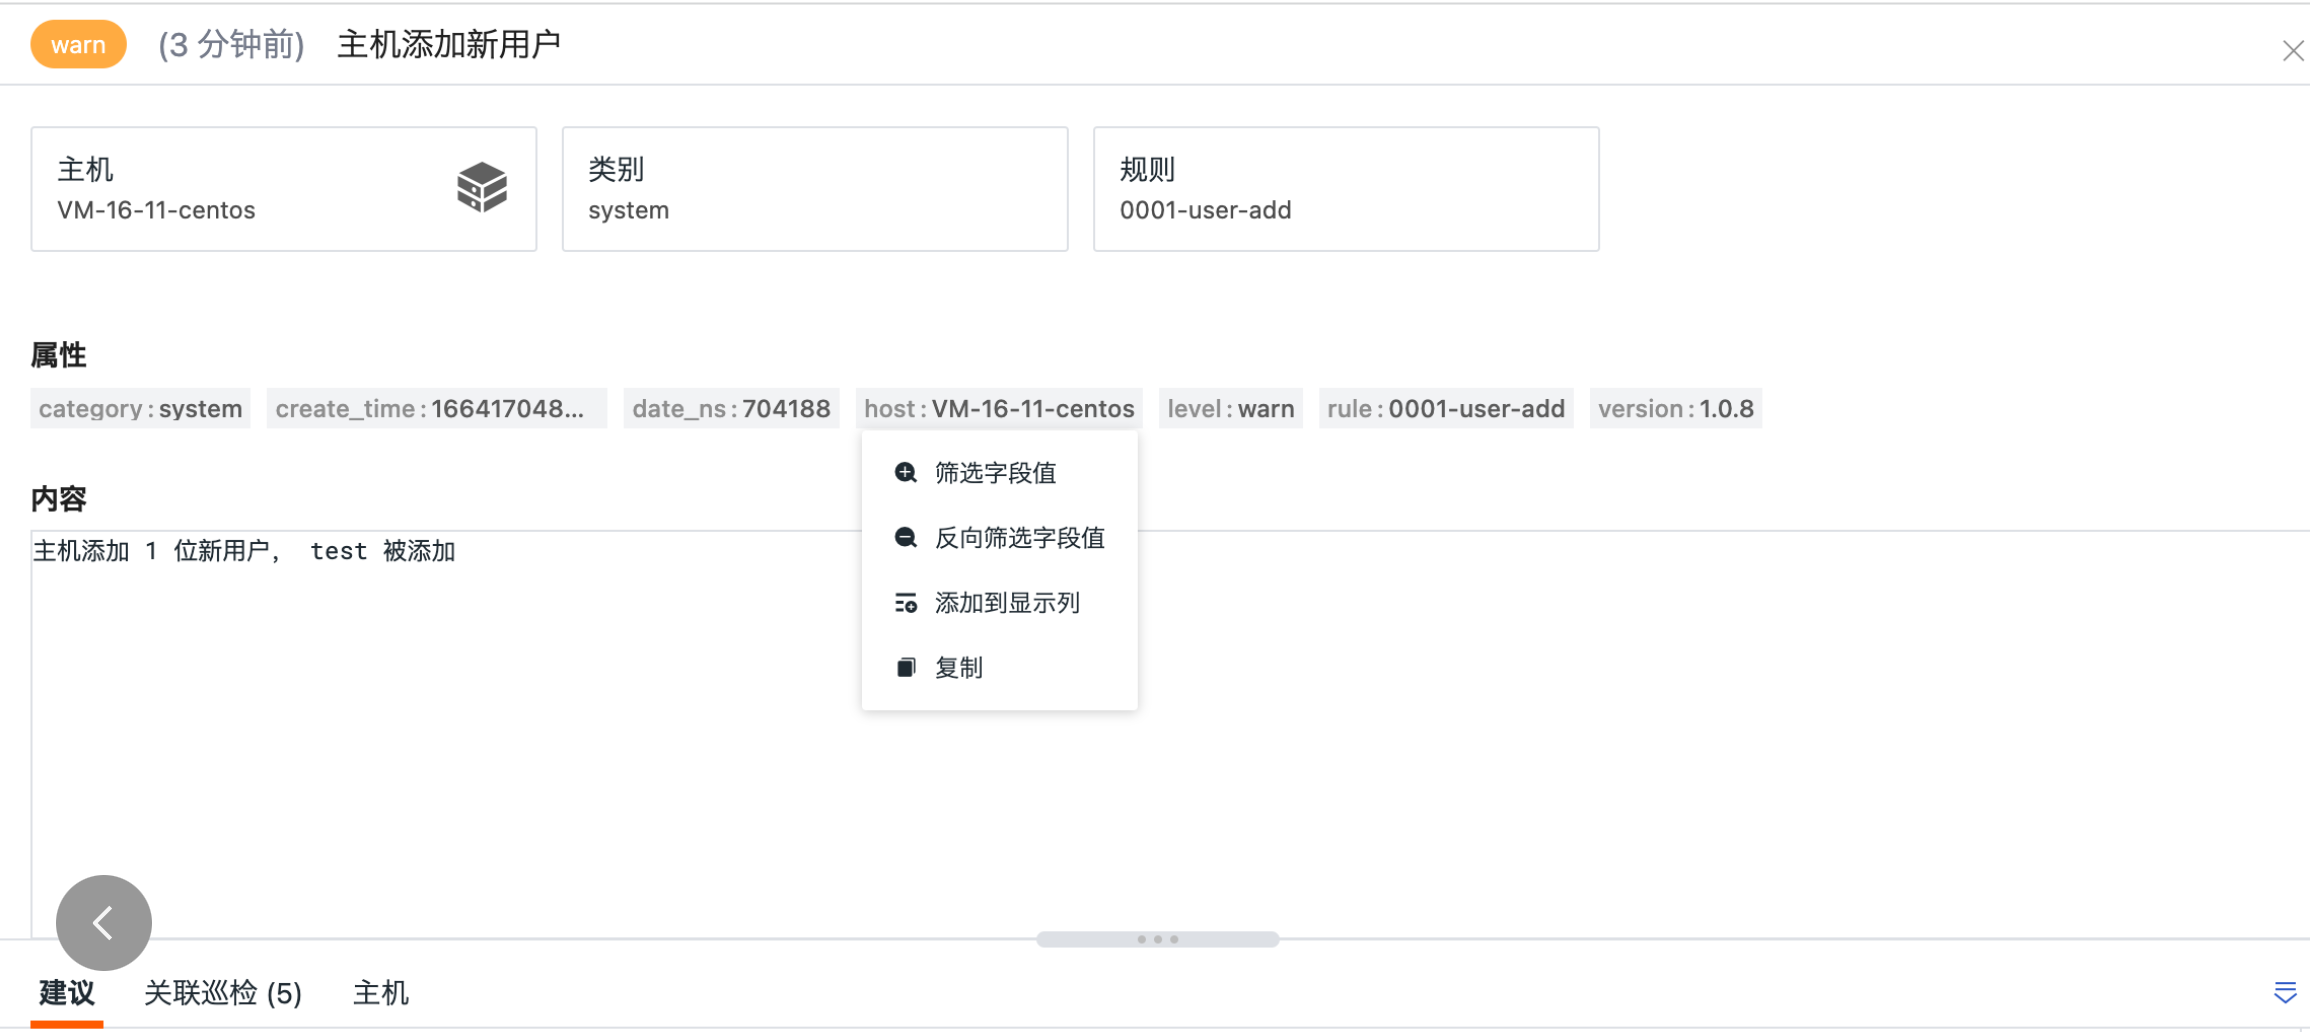
Security Check Event Details
When clicking the label "HOST" or attribute fields with your mouse, you can quickly filter and view options such as "Filter Field Values," "Reverse Filter Field Values," "Add to Display Columns," and "Copy."
- "Filter Field Values," which adds the field to the explorer to view all data related to that field.
- "Reverse Filter Field Values," which adds the field to the explorer to view data other than that field.
- "Add to Display Columns," which adds the field to the explorer list for viewing.
- "Copy," which copies the field to the clipboard.
Suggestions
Click on the security check event you want to view. In the detail page that slides out, you can view handling suggestions for this security check event, including theoretical foundations, risk items, audit methods, remedial measures, etc.

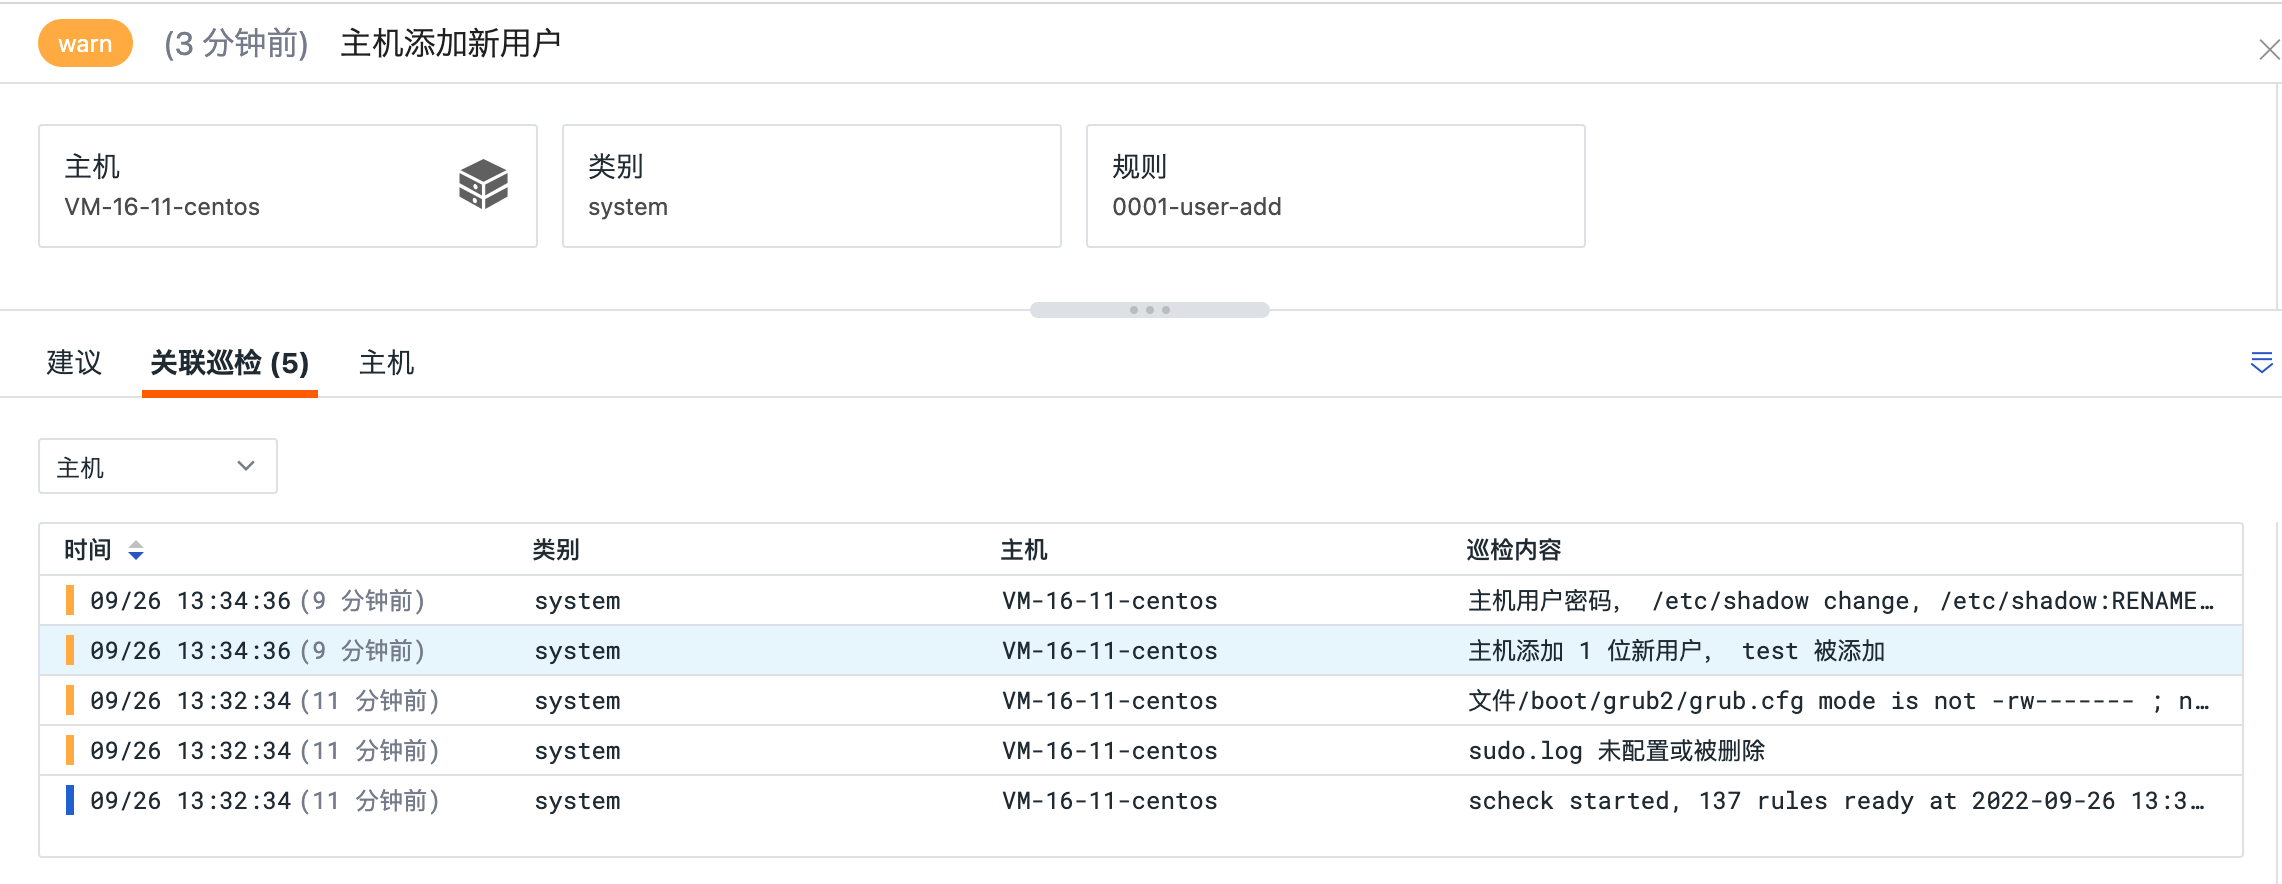
Associated Checks
In the associated checks section of the security check event detail page, you can match associated events by selecting tags (including: HOST host, category category, rule rule). At the same time, you can search for associated events based on the name and content of the event.
Associated Hosts
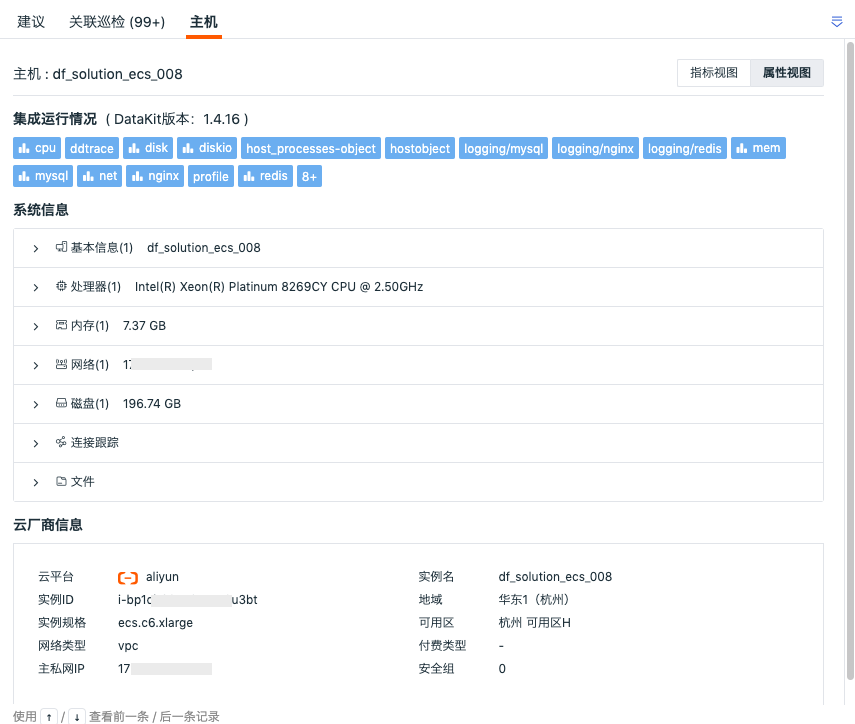
On the security check detail page, clicking "HOST" below allows you to view the metrics view and attributes view of related hosts (associated field: host).
Note: To view related hosts in process details, you need to match the "host" field; otherwise, you won't be able to see the related host's page in the process details.
- Metrics View: You can view the status of performance metrics of related hosts 30 minutes before the end of this inspection event to 30 minutes after the log ends, including CPU, memory, and other performance metric views of related hosts.
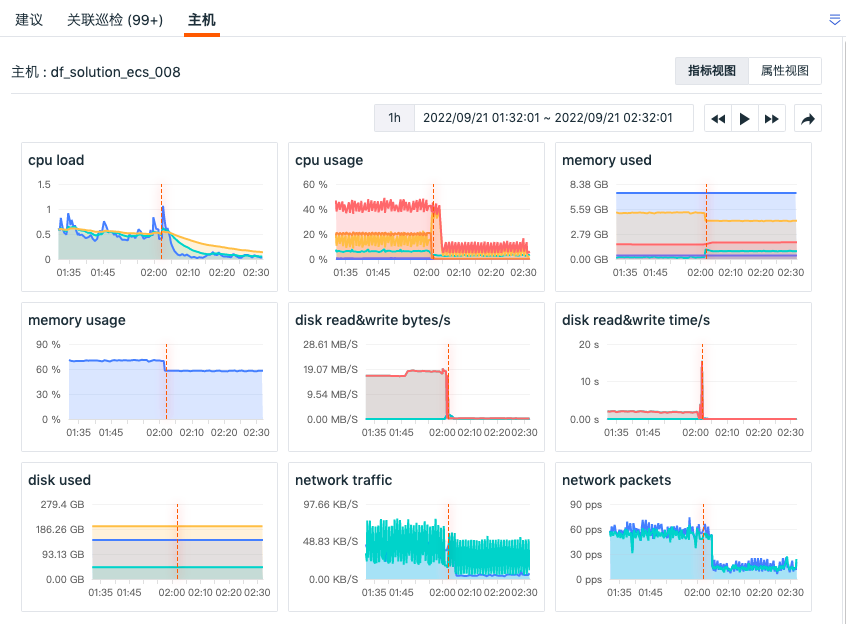
- Attributes View: Helps you trace back to the actual state of the host object when the inspection data was generated. You can view the latest object data of related hosts within 10 minutes before the end of this inspection event, including basic host information and integration operation status. If cloud host collection is enabled, you can also view cloud vendor information.
Note: Guance defaults to saving the historical data of host objects for the last 48 hours. If no host historical data corresponding to the current log time is found, you will not be able to view the attributes view of the associated host.