Best Practices for Redis Observability
What is Redis
Redis is a popular in-memory key/value data store. Known for its outstanding performance and ease of use, Redis has been adopted across various industries, including:
-
Database: Although asynchronous disk persistence is available, Redis trades persistence for speed, unlike traditional disk-based databases. Redis offers a rich set of data primitives and an exceptionally extensive command list.
-
Message Queue: Redis's blocking list commands and low latency make it a good backend for message broker services.
- In-memory Cache: Configurable key eviction policies, including the popular "Least Recently Used" (LRU) and, starting from Redis 4.0, "Least Frequently Used" (LFU) strategies, make Redis an excellent choice for a cache server. Unlike traditional caches, Redis also allows disk persistence for increased reliability.
Redis is a free, open-source product. Commercial support is available, as well as fully managed Redis as a service.
Redis is used by many high-traffic websites and applications, such as Twitter, GitHub, Docker, Pinterest, Datadog, and Stack Overflow.
Key Redis Metrics
Monitoring Redis helps you identify issues in two areas: resource problems within Redis itself, and problems occurring elsewhere in the supporting infrastructure.
In this article, we detail the most important Redis metrics in each of the following categories:
-
Performance Metrics
-
Memory Metrics
- Basic Activity Metrics
- Persistence Metrics
- Error Metrics
Performance Metrics
Besides a low error rate, good performance is one of the top-level indicators of system health. As discussed in the Memory section, poor performance is often caused by memory issues.
| Name | Description | Metric Type |
|---|---|---|
| latency | Average time Redis server takes to respond to requests | Work: Performance |
| Instantaneous_ops_per_sec | Total number of commands processed per second | Work: Throughput |
| hit rate (calculated) | keyspace_hits / (keyspace_hits + keyspace_misses) | Work: Success |
Alert Metric: latency
Latency measures the time between a client request and the actual server response. Tracking latency is the most direct way to detect performance changes in Redis. Due to Redis's single-threaded nature, outliers in the latency distribution can cause significant bottlenecks. An excessively long response time for one request increases the waiting time for all subsequent requests. Once latency is identified as a problem, several measures can be taken to diagnose and resolve performance issues.
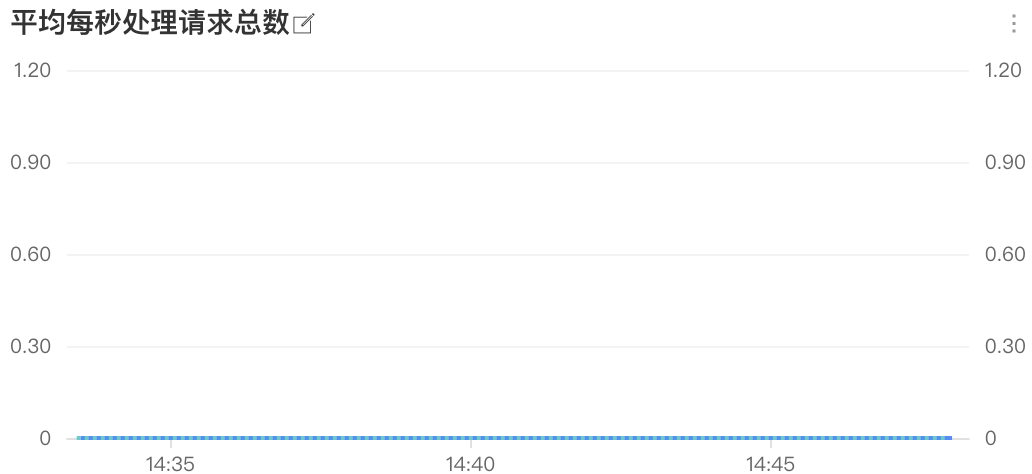
Observability Metric: Instantaneous_ops_per_sec
Tracking the throughput of processed commands is crucial for diagnosing the cause of high latency in a Redis instance. High latency can be caused by many issues, from a backlogged command queue to slow commands or overuse of the network link. You can investigate by measuring the number of commands processed per second – if this number remains almost constant, the cause is not a compute-intensive command. If one or more slow commands are causing latency issues, you will see the number of commands per second drop or stop completely. A decline in the number of commands processed per second compared to historical norms could be a sign of low command volume or a slow command blocking the system. Low command volume may be normal or could indicate an upstream problem.
Metric: hit rate
When using Redis as a cache, monitoring the cache hit rate tells you whether the cache is being used effectively. A low hit rate means clients are looking for keys that no longer exist. Redis does not directly provide a hit rate metric. We can still calculate it as follows:
A low cache hit rate can be caused by a variety of factors, including data expiration and insufficient memory allocated to Redis (which may cause key eviction). A low hit rate can increase application latency as they must fetch data from slower fallback resources.
Memory Metrics
| Name | Description | Metric Type |
|---|---|---|
| used_memory | Amount of memory used by Redis (in bytes) | Resource: Utilization |
| mem_fragmentation_ratio | Ratio of memory allocated by the OS to memory requested by Redis | Resource: Saturation |
| evicted_keys | Number of keys deleted because the maximum memory limit was reached | Resource: Saturation |
| blocked_clients | Clients blocked waiting for BLPOP, BRPOP, or BRPOPLPUSH | Other |
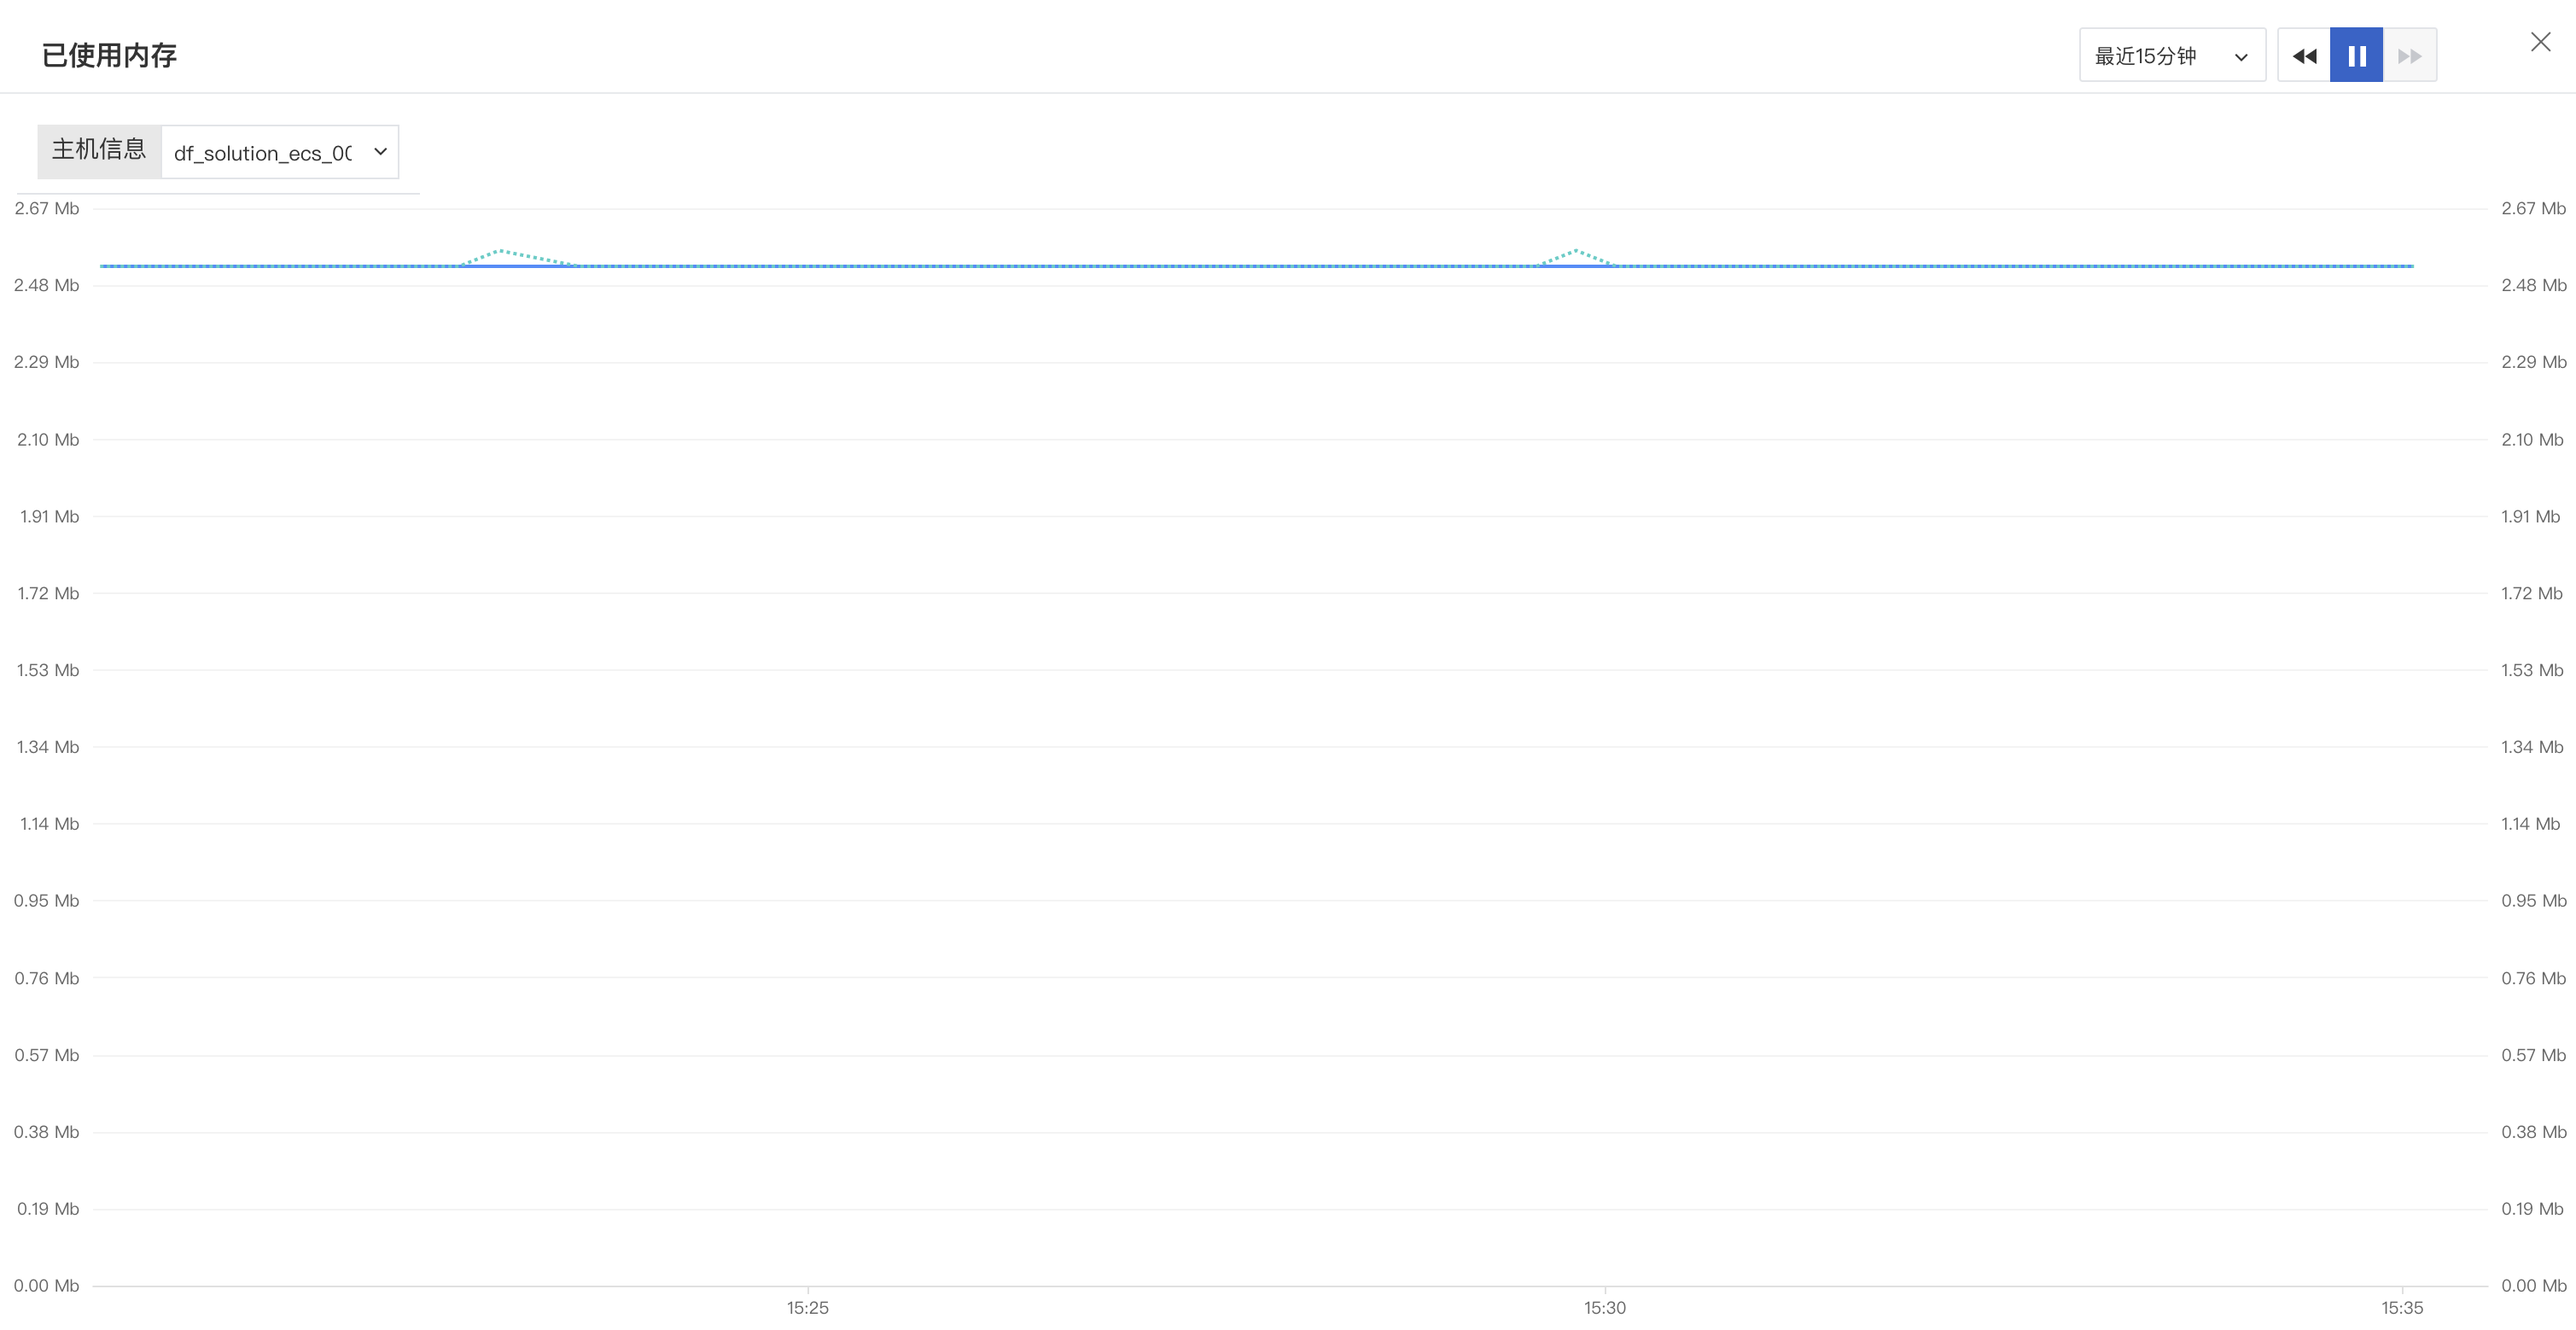
Observability Metric: used_memory
Memory usage is a key component of Redis performance. If used_memory exceeds the total available system memory, the operating system will start swapping out old/unused parts of memory. Each swapped part is written to disk, severely impacting performance. Writing to or reading from disk is 5 orders of magnitude slower (100,000x!) than from memory (0.1 µs for memory vs. 10 ms for disk).
You can configure Redis to limit itself to a specified amount of memory. Setting the maxmemory directive in the redis.conf file directly controls Redis's memory usage. Enabling maxmemory requires you to configure an eviction policy for Redis to determine how to free memory. Learn more about configuring the maxmemory-policy directive in the evicted_keys section.
Alert Metric: mem_fragmentation_ratio
The mem_fragmentation_ratio metric provides the ratio of memory used by the operating system (used_memory_rss) to the memory allocated by Redis (used_memory).
The operating system is responsible for allocating physical memory for each process. The OS virtual memory manager handles the actual mapping, mediated by the memory allocator.What does this mean? If your Redis instance has a memory footprint of 1GB, the memory allocator will first try to find a contiguous memory segment to store the data. If it cannot find a contiguous segment, the allocator must split the process's data into multiple segments, increasing memory overhead.
Tracking the fragmentation ratio is important for understanding the performance of a Redis instance. A fragmentation ratio greater than 1 indicates fragmentation is occurring. A ratio above 1.5 indicates excessive fragmentation, meaning your Redis instance is consuming 150% of the physical memory it requested. A fragmentation ratio less than 1 tells you that Redis requires more memory than is available on the system, leading to swapping. Swapping to disk will cause significant latency increases (see used_memory). Ideally, the operating system will allocate a contiguous segment in physical memory, resulting in a fragmentation ratio of 1 or greater.
If the fragmentation ratio on a server exceeds 1.5, restarting the Redis instance will allow the OS to reclaim memory that was previously unusable due to fragmentation. In this case, an alert as a notification might be sufficient.
However, if the fragmentation ratio of your Redis server is below 1, you may need to issue an alert as a page so that you can quickly increase available memory or reduce memory usage.
Starting with Redis 4, when Redis is configured to use the included jemalloc copy, the new active defragmentation feature can be used. This tool can be configured to start when fragmentation reaches a certain level and will begin copying values into contiguous memory regions and releasing old copies, reducing fragmentation while the server is running.
Alert Metric: evicted_keys (Cache Only)
If you are using Redis as a cache, you may want to configure it to automatically evict keys when the maximum memory limit is reached. If you are using Redis as a database or queue, it is better to replace eviction, in which case you can skip this metric.
Tracking key eviction is important because Redis processes each operation sequentially, meaning evicting a large number of keys can lead to lower hit rates, resulting in longer latency. If you are using TTL, you may not want eviction of keys. In this case, if the metric is consistently greater than zero, your instance may experience increased latency. Most other configurations that do not use TTL will eventually run out of memory and start evicting keys. As long as your response times are acceptable, a steady eviction rate is acceptable.
You can configure the key expiration policy using the command:
where policy is one of the following:
- noeviction: Returns an error when the memory limit is reached and the user tries to add additional keys.
- volatile-lru: Removes the least recently used key among those with an expire set.
- volatile-ttl: Removes the key with the shortest remaining time to live among those with an expire set.
- volatile-random: Removes a random key among those with an expire set.
- allkeys-lru: Removes the least recently used key from the entire keyspace.
- allkeys-random: Removes a random key from the entire keyspace.
- volatile-lfu: Added in Redis 4, removes the least frequently used key among those with an expire set.
- allkeys-lfu: Added in Redis 4, removes the least frequently used key from the entire keyspace.
Note: For performance reasons, when using LRU, TTL, or Redis 4 (LFU) policies, Redis does not actually sample the entire keyspace. Redis first samples a random subset of the keyspace and then applies the eviction policy to that sample. Typically, newer (>=3) versions of Redis adopt an LRU sampling strategy that is closer to true LRU. The LFU policy can be tuned by setting, for example, the amount of time that must pass before an item's access level is decremented. See Redis documentation for more details.
Observability Metric: blocked_clients
Redis provides several blocking commands that operate on lists. BLPOP, BRPOP, and BRPOPLPUSH are blocking variants of the commands LPOP, RPOP, and RPOPLPUSH, respectively. When the source list is non-empty, the commands execute as expected. However, when the source list is empty, the blocking commands wait until the source is populated or a timeout is reached.
An increase in the number of blocked clients waiting for data can be a symptom of a problem. Latency or other issues may prevent the source list from being filled. While blocked clients themselves do not warrant an alert, if you see this metric consistently non-zero, you should investigate.
Basic Activity Metrics
Note: This section includes metrics that use the terms "master" and "slave". Except when referencing specific metric names, this article replaces them with "primary" and "replica".
| Name | Description | Metric Type |
|---|---|---|
| connected_clients | Number of clients connected to Redis | Resource: Utilization |
| connected_slaves | Number of replicas connected to the current primary instance | Other |
| master_last_io_seconds_ago | Time (in seconds) since the last interaction between the replica and the primary instance | Other |
| keyspace | Total number of keys in the database | Resource: Utilization |
Alert Metric: connected_clients
Since access to Redis is typically mediated by applications (users do not usually access the database directly), the number of connected clients will have reasonable upper and lower bounds in most cases. If the number falls outside the normal range, it may indicate a problem. If it is too low, an upstream connection may have been lost; if it is too high, a large number of concurrent client connections may overwhelm the server's ability to process requests.
In any case, the maximum number of client connections is always a limited resource – whether constrained by the operating system, Redis's configuration, or network limits. Monitoring client connections helps you ensure sufficient resources are available for new clients or to manage sessions.
Alert Metric: connected_slaves
If your database is read-intensive, you may be using the primary-replica database replication feature available in Redis. In this case, monitoring the number of connected replicas is critical. If the number of connected replicas changes unexpectedly, it may indicate that the primary has gone down or there is a problem with the replica instance.
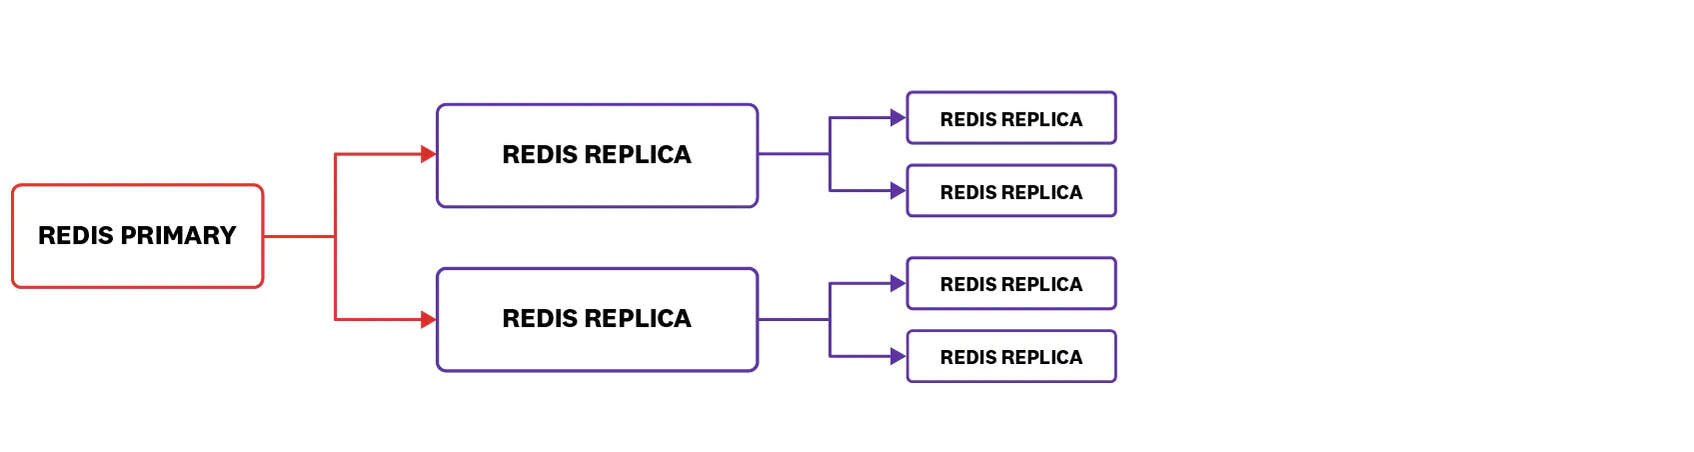
Note: In the diagram above, the Redis primary database will show it has two connected replicas, and the first child will each report that they also have two connected replicas. Since the secondary replicas are not directly connected to the Redis primary, they are not included in the count of replicas connected to the primary.
Alert Metric: master_last_io_seconds_ago
When using Redis's replication feature, replica instances periodically check in with their primary instance. A long period without communication may indicate a problem with your primary Redis server, replica server, or both. You also risk the replica serving stale data that may have been changed since the last sync. Due to the way Redis performs synchronization, minimizing disruptions in primary-replica communication is critical. When a replica reconnects to the primary after a disruption, it sends a SYNC command to attempt a partial synchronization of only the commands lost during the disruption. If this is not possible, the replica requests a full SYNC, which causes the primary to immediately start background saving the database to disk while buffering all new commands that modify the dataset. Once the background save is complete, the data is sent to the client along with the buffered commands. Each time a replica performs a SYNC, it causes a significant increase in latency on the primary instance.
Notable Metric: keyspace
Tracking the number of keys in the database is generally a good idea. As an in-memory data store, the larger the keyspace, the more physical memory Redis requires to ensure optimal performance. Redis will continue to add keys until the maximum memory limit is reached, at which point Redis begins evicting keys at the same rate as new keys are added.
If you are using Redis as a cache and see a saturated keyspace (as shown in the diagram above) along with a low hit rate, your clients may be requesting stale or evicted data. Tracking your keyspace_misses over time will help you pinpoint the cause.
Alternatively, if you are using Redis as a database or queue, volatile keys may not be recommended. As the keyspace grows, you may want to consider adding memory to the box or splitting the dataset across hosts, if possible. Adding more memory is a simple and effective solution. When the required resources exceed what a single box can provide, you can combine the resources of multiple computers by partitioning or sharding the data. With a partitioning plan, Redis can store more keys without eviction or swapping. However, implementing a partitioning plan is more challenging than swapping in a few memory sticks.
Persistence Metrics
| Name | Description | Metric Type |
|---|---|---|
| rdb_last_save_time | Unix timestamp of the last save to disk | Other |
| rdb_changes_since_last_save | Number of changes made to the database since the last dump | Other |
Enabling persistence may be necessary, especially when using Redis's replication feature. Since replicas blindly replicate any changes made to the primary instance, if the primary restarts (without persistence), all replicas connected to it will replicate its now-empty dataset.
If you are using Redis as a cache or in a use case where data loss is less critical, persistence may not be needed.
Important Metrics to Monitor: rdb_last_save_time and rdb_changes_since_last_save
Generally, it is good to be aware of the volatility of your dataset. If the server fails, an excessively long interval between writes to disk can lead to data loss. Any changes made to the dataset between the last save time and the failure time will be lost.
Monitoring rdb_changes_since_last_save gives you deeper insight into the volatility of your data. If your dataset does not change much during that interval, a long interval between writes is not a problem. Tracking both metrics gives you a good idea of how much data you would lose if a failure occurred at a given point in time.
Error Metrics
Note: This section includes metrics that use the terms "master" and "slave". Except when referencing specific metric names, this article replaces them with "primary" and "replica".
Redis error metrics can alert you to anomalous conditions. The following metrics track common errors:
| Name | Description | Metric Type |
|---|---|---|
| rejected_connections | Number of connections rejected due to reaching the maxclient limit | Resource: Saturation |
| keyspace_misses | Number of failed key lookups | Resource: Errors / Other |
| master_link_down_since_seconds | Time (in seconds) the link between the primary and replica servers has been down | Resource: Errors |
Alert Metric: rejected_connections
Redis can handle many active connections, with 10,000 client connections available by default. The maximum number of connections can be set to a different value by changing the maxclient directive in redis.conf. If your Redis instance is currently at the maximum number of connections, any new connection attempts will be rejected.
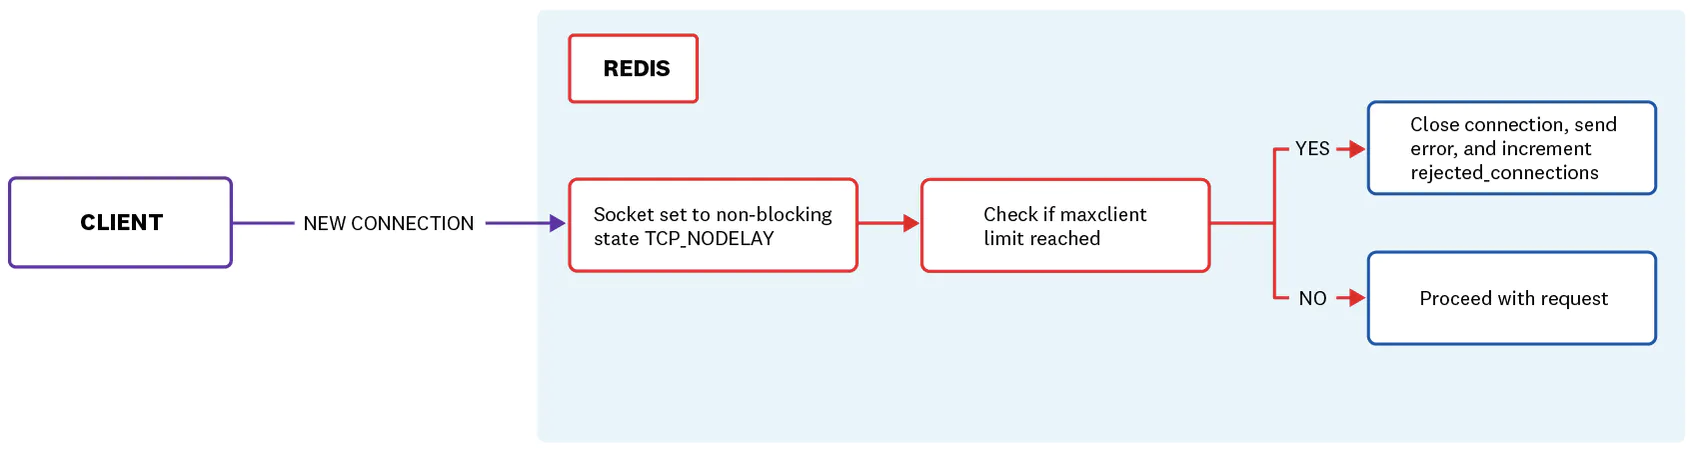
Note that your system may not support the number of connections you request with the maxclient directive. Redis checks with the kernel to determine the number of available file descriptors. If the number of available file descriptors is less than maxclient + 32 (Redis reserves 32 file descriptors for its own use), the maxclient directive will be ignored and the number of available file descriptors will be used.
Alert Metric: keyspace_misses
Every time Redis looks up a key, only two results are possible: the key exists, or the key does not exist. Looking up a non-existent key causes the keyspace_misses counter to increment. A non-zero value for this metric indicates that clients are trying to look up keys that do not exist in the database. If Redis is not used as a cache, keyspace_misses should be zero or near zero. Note that any blocking operation (BLPOP, BRPOP, and BRPOPLPUSH) called on an empty key will cause keyspace_misses to increment.
Alert Metric: master_link_down_since_seconds
This metric is only available when the connection between the primary and its replica is lost. Ideally, this value should never be greater than zero – the primary and replica databases should maintain continuous communication to ensure the replica does not serve stale data. Large intervals between connections should be addressed. Remember that upon reconnection, your primary Redis instance will need to dedicate resources to update the data on the replica, which can cause increased latency.
Conclusion
In this article, we covered some of the most useful metrics you can monitor to keep tabs on your Redis server. If you are just getting started with Redis, monitoring the metrics in the list below will give you a good understanding of the health and performance of your database infrastructure:
-
Number of commands processed per second
-
Latency
- Memory fragmentation ratio
- Evictions
- Rejected clients
Over time, you will recognize additional metrics that are particularly relevant to your own infrastructure and use cases. Of course, what you monitor will depend on the tools you have and the metrics available.