Understanding MySQL
Author: Liu Rui
As the backbone of business operations, databases heavily influence application architecture and performance. While application service performance can be improved by horizontal scaling of the services themselves, database performance ultimately determines the application's fate. As the king of databases, MySQL is used across almost all industries. As business volume grows, improper use of SQL and a large number of slow queries can cripple the application, making observability crucial.
MySQL Integration
MySQL Integration Documentation
MySQL Monitoring
MySQL-related metrics are monitored from four main perspectives:
- Overview
- Active User Information
- InnoDB
- Lock Information
Overview
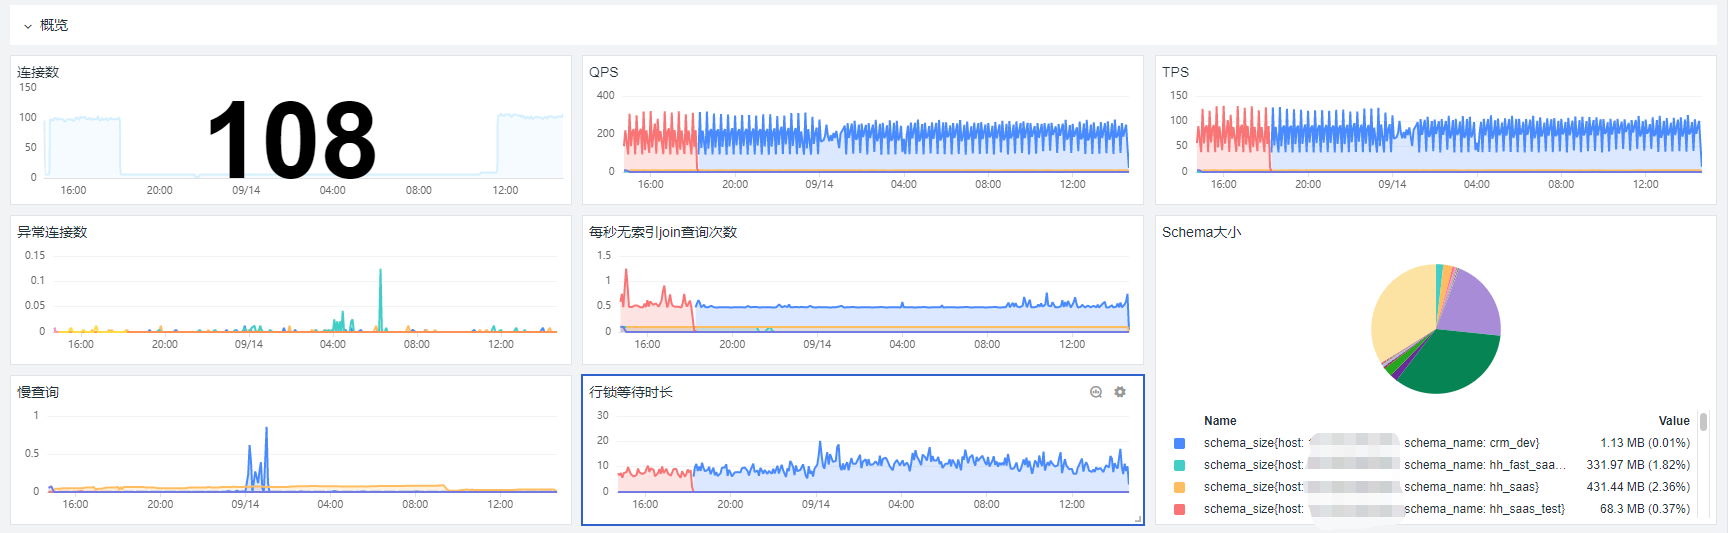
The Overview section provides a high-level analysis of MySQL from dimensions such as connection count, QPS, TPS, abnormal connection count, number of joins without indexes per second, Schema size distribution, slow queries, and lock wait time.
Active User Information
Have you ever paid attention to MySQL connections? Let's start with an error:
We know that MySQL connections can be long-lived or short-lived. The process of establishing a connection itself involves significant overhead, so long-lived connections are generally preferred. However, using long-lived connections can increase memory usage because MySQL uses temporary memory to manage connection objects during query execution. These connection object resources are only released when the connection is closed. If a large number of long-lived connections accumulate, memory usage can increase, potentially causing the system to forcibly kill the process, leading to abnormal MySQL service restarts.
For long-lived connections, they need to be disconnected periodically. You can determine whether a connection is a long-lived persistent connection by checking the memory it occupies. Additionally, after executing a large operation, you can call mysql_reset_connection to reinitialize the connection resources.
Typically, a MySQL connection is established for each user request. If a request operation takes a long time to complete, connections can pile up, rapidly consuming the database's connection pool. In other words, if there are SQL statements in the database that have not finished executing for a long time, they will keep the connection occupied and not release it. Meanwhile, application requests keep flooding into the database, causing the connection pool to be exhausted quickly.
In the context of cloud-native and microservices, database connection requirements are becoming increasingly stringent. Therefore, MySQL connections can easily become a bottleneck for applications. Too many connections can cause the CPU on the MySQL server to spike and also lead to business interruptions because the application cannot obtain more connections. Real-time monitoring allows us to quickly identify database bottlenecks and even find details about each user's connections, such as the current number of connections for a user and the cumulative number of connections.
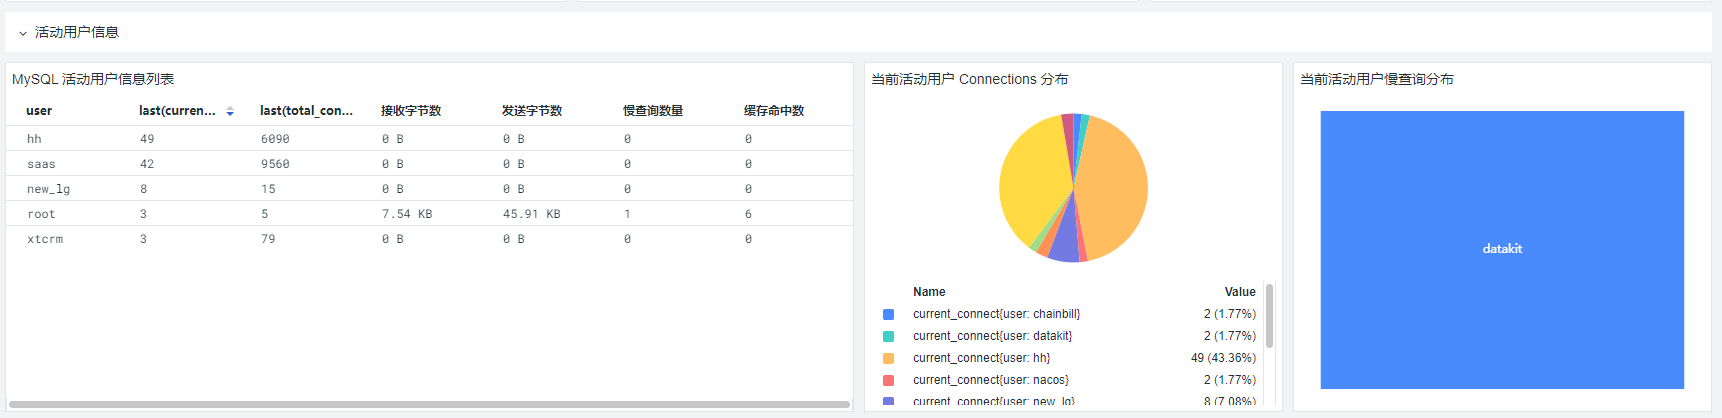
Based on current connection information, we can optimize MySQL accordingly:
- Increase the maximum number of connections
- Implement master-slave replication with read/write splitting
- Split business logic across multiple database instances
- Increase or decrease caching to reduce queries
- And so on
InnoDB
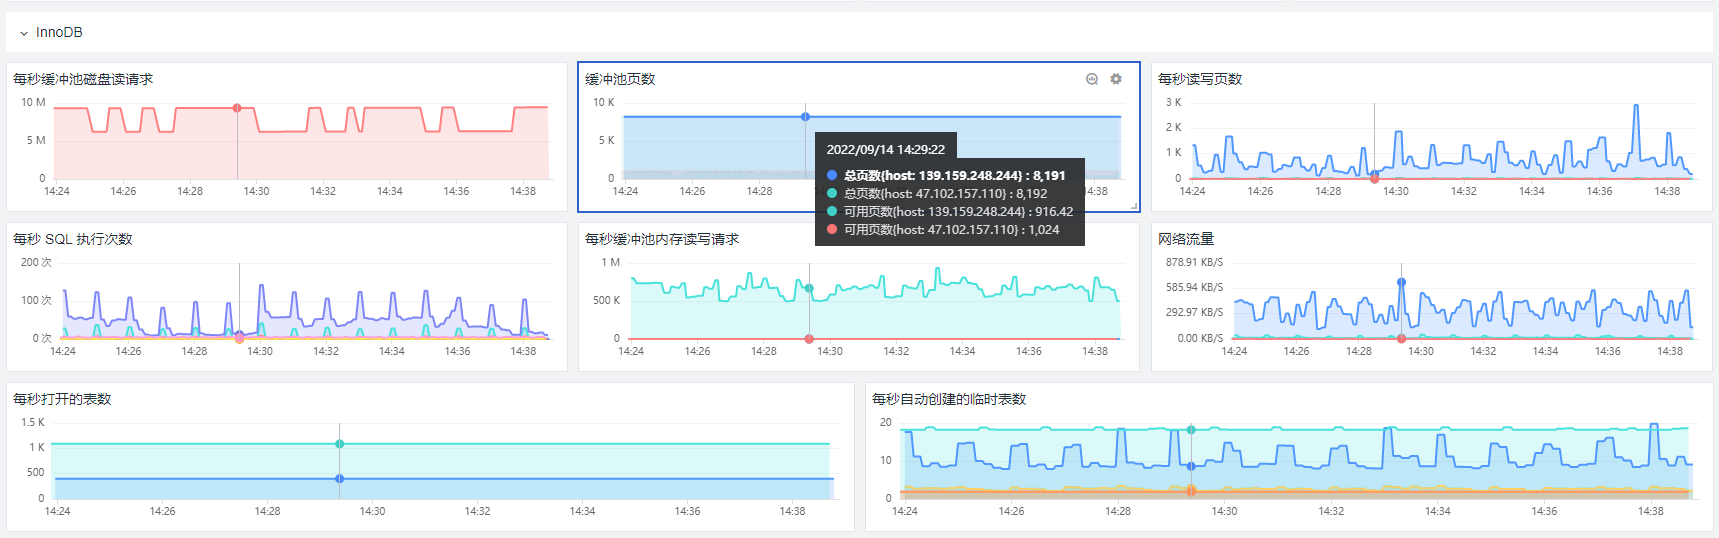
Enable InnoDB metric collection by configuring the innodb=true parameter in mysql.conf.
Lock Information

MySQL Slow Queries
For production business systems, slow queries are also a type of fault and risk. Once a fault occurs, it can make the system unavailable and impact production. When there are many slow queries and the SQL execution is slower, the CPU or IO resources consumed will also be greater. Therefore, to resolve and avoid such faults, focusing on the slow queries themselves is key.
There are currently two methods to optimize slow queries:
Enable slow query log, collect the slow query log, and manually run
EXPLAINon the slow SQL statements.Use Guance to enable DBM (Database Monitoring) for MySQL to collect database performance metrics. It will automatically select some SQL statements with high execution time, obtain their execution plans, and collect various performance metrics during actual execution.
MySQL slow log
Broadly Defined Slow Queries
Most commonly, we refer to narrow slow queries, i.e., queries that exceed a predefined time threshold, such as queries that do not return results within 10 seconds (default). In addition to this, there are other situations that can cause slow queries and can also be marked as slow queries:
- Queries that return a large result set.
- Frequently executed queries that do not use indexes.
Enabling Slow Query Log
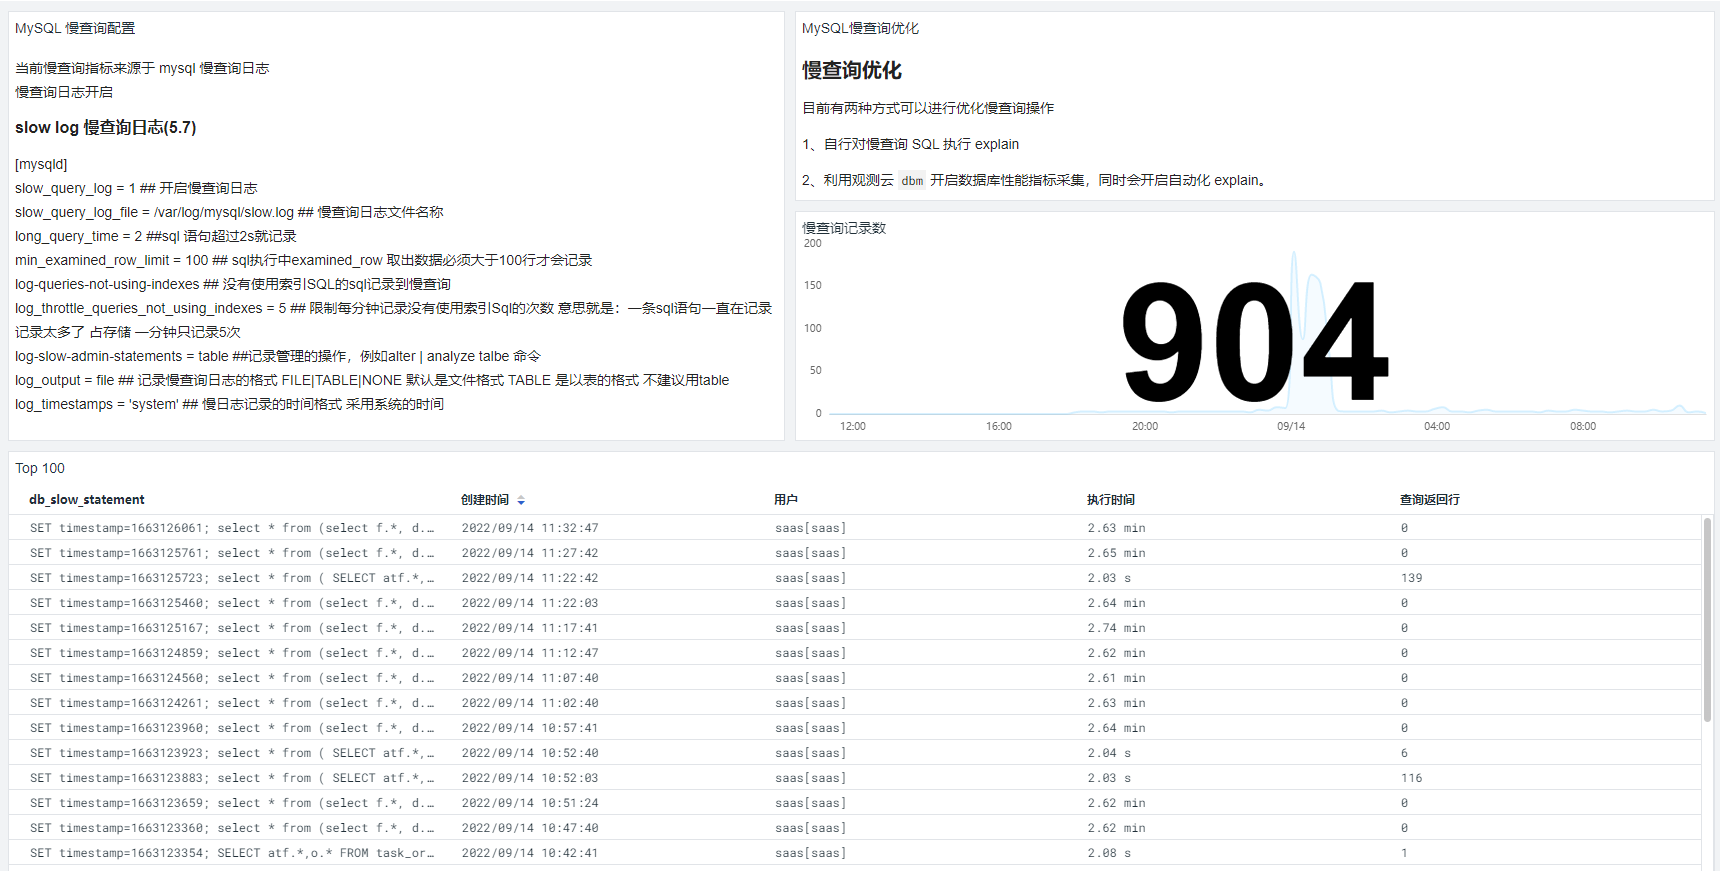
The following configuration enables slow query logging in MySQL 5.7:
#### slow log  慢查询日志 ####
slow_query_log = 1 ## 开启慢查询日志
slow_query_log_file = /var/log/mysql/slow.log ## 慢查询日志文件名称
long_query_time = 2 ##sql 语句超过2s就记录
# min_examined_row_limit = 100 ## sql执行中examined_row 取出数据必须大于100行才会记录
#log-queries-not-using-indexes ## 没有使用索引SQL的sql记录到慢查询
log_throttle_queries_not_using_indexes = 5 ## 限制每分钟记录没有使用索引Sql的次数 意思就是:一条sql语句一直在记录 记录太多了 占存储 一分钟只记录5次
log-slow-admin-statements = table ##记录管理的操作,例如alter | analyze talbe 命令
log_output = file ## 记录慢查询日志的格式 FILE|TABLE|NONE 默认是文件格式 TABLE 是以表的格式 不建议用table
log_timestamps = 'system' ## 慢日志记录的时间格式 采用系统的时间
This records the top 100 slow query statements. To view more slow queries, you can check the Log Explorer for more log information.
MySQL DBM
Database performance metrics mainly come from MySQL's built-in database performance_schema, which provides a method to obtain the internal execution status of the server at runtime. Through this database, DataKit can collect various metric statistics of historical query statements, query execution plans, and other related performance metrics. The collected performance metric data is saved as logs with sources mysql_dbm_metric, mysql_dbm_sample, and mysql_dbm_activity.
Enabling DBM allows direct collection of database performance metrics. For collector configuration, refer to: MySQL
[[inputs.mysql]]

# 开启数据库性能指标采集
dbm = true

...

# 监控指标配置
[inputs.mysql.dbm_metric]
  enabled = true

# 监控采样配置
[inputs.mysql.dbm_sample]
  enabled = true

# 等待事件采集
[inputs.mysql.dbm_activity]
  enabled = true
...
mysql_dbm_metric View
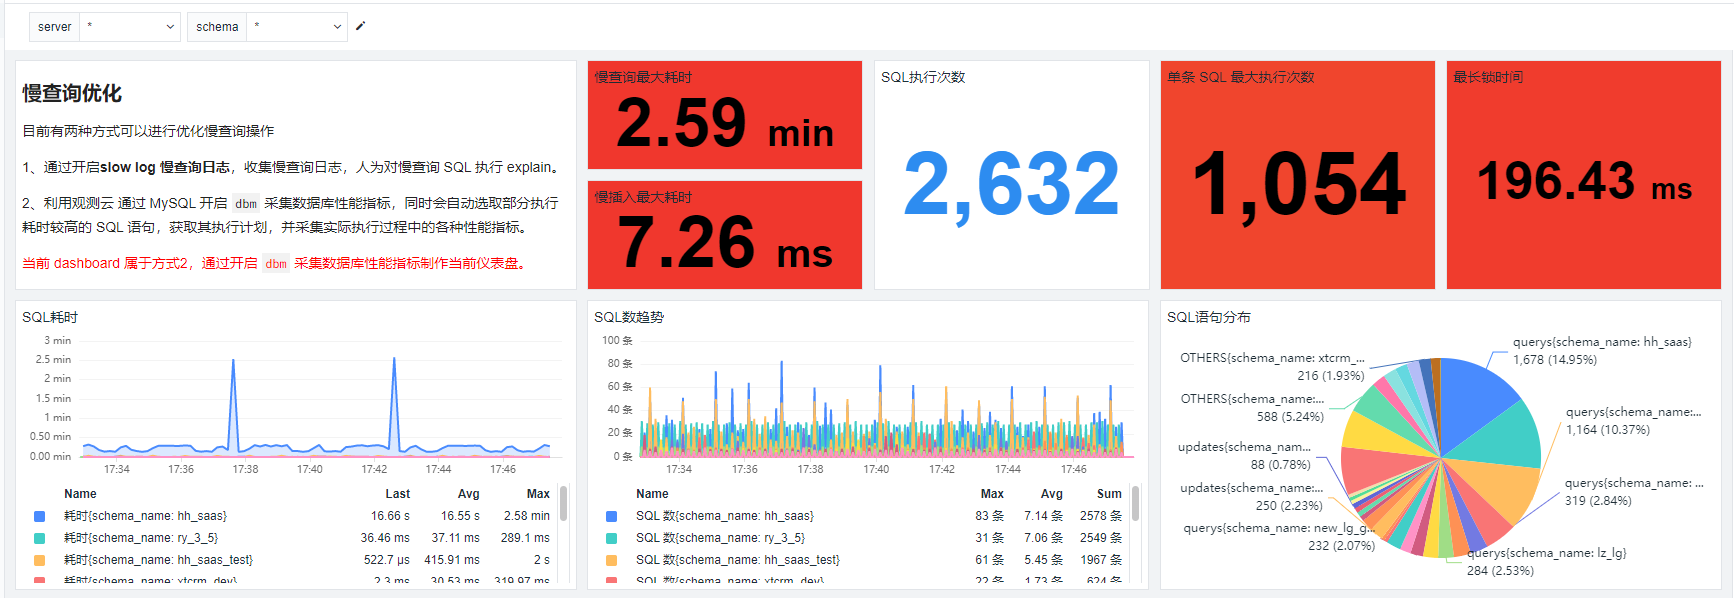
With DBM enabled, the collected database performance metrics can be visually analyzed in the view: maximum slow query duration, maximum slow insert duration, number of slow query SQL executions, maximum execution count for a single SQL (execution frequency), maximum lock time, etc.
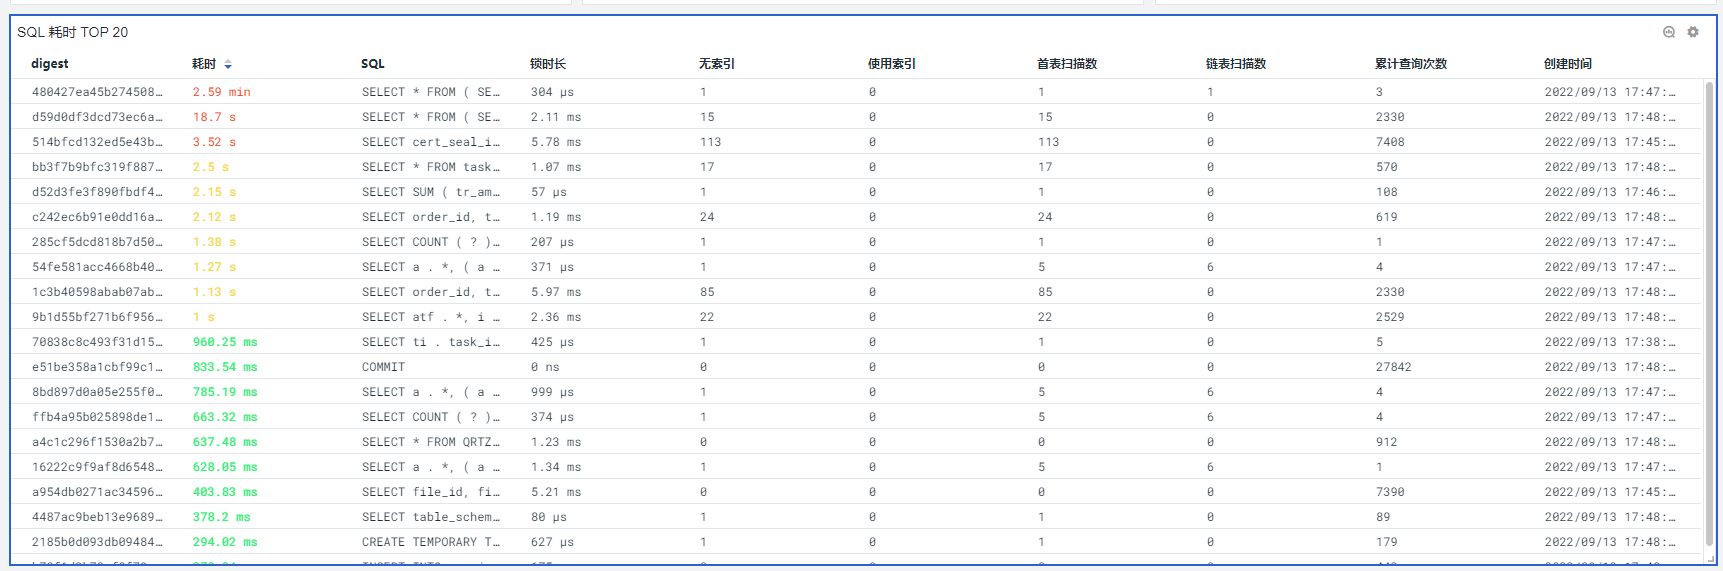
In the view 【SQL 耗时 TOP 20 】, the top 20 slow SQL queries are sorted in descending order by query time. You can adjust the parameters to display the desired TOP N.
mysql_dbm_activity View
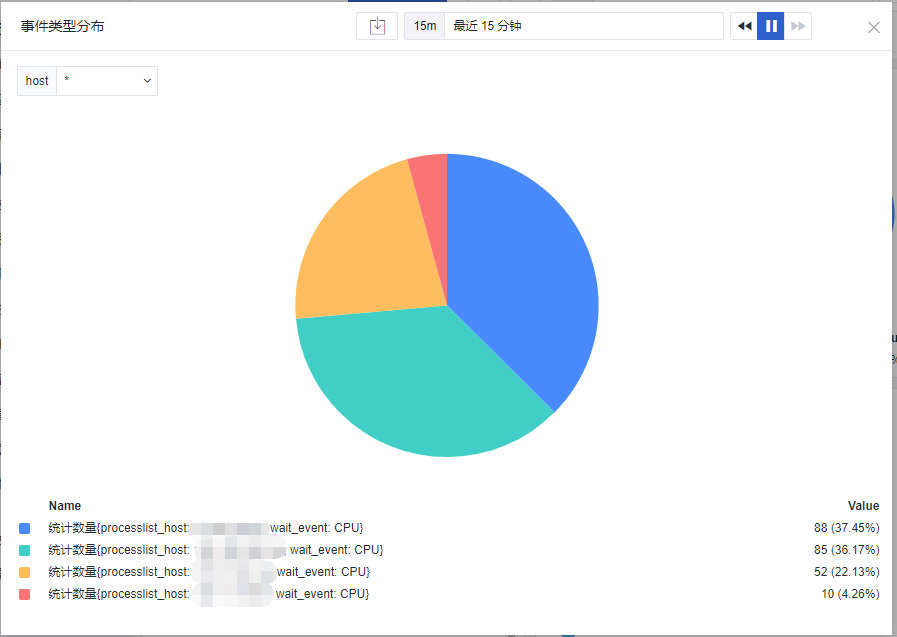
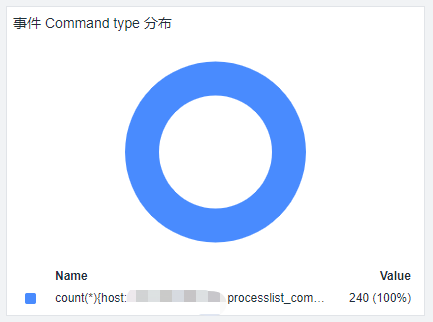
By constructing the mysql_dbm_activity view, you can observe the current number of SQL statements being executed, event type distribution (whether the current event is a CPU event or a User sleep event, etc.), event status distribution (e.g., Sending data, Creating sort index, etc.), event Command Type distribution (e.g., whether the current command is Query or Sleep), and the event list.
Event Type Distribution
Refers to the type of events during SQL processing:
- CPU
- User sleep
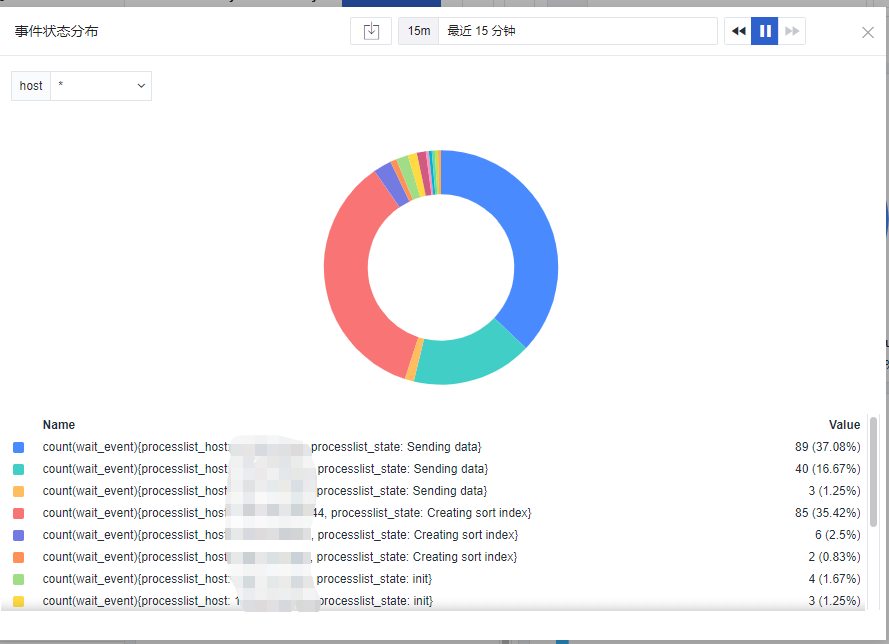
Event Status Distribution
The distribution of status types for currently processing SQL statements. The main status types are:
- init: Initial execution
- Sending data: Sending data
- Creating sort index: Creating a sort index
- freeing items: Freeing current items
- converting HEAP to MyISAM: Converting heap to MyISAM
- query end: Query completed
- Opening tables: Opening tables
- statistics: Statistics
Event Command Type Distribution
The distribution of Command Types for currently processing SQL statements. The main types are:
- query: Query. The
querytype should be analyzed together with theevent status. - sleep: Sleeping, not yet scheduled.
- daemon: Running as a daemon.
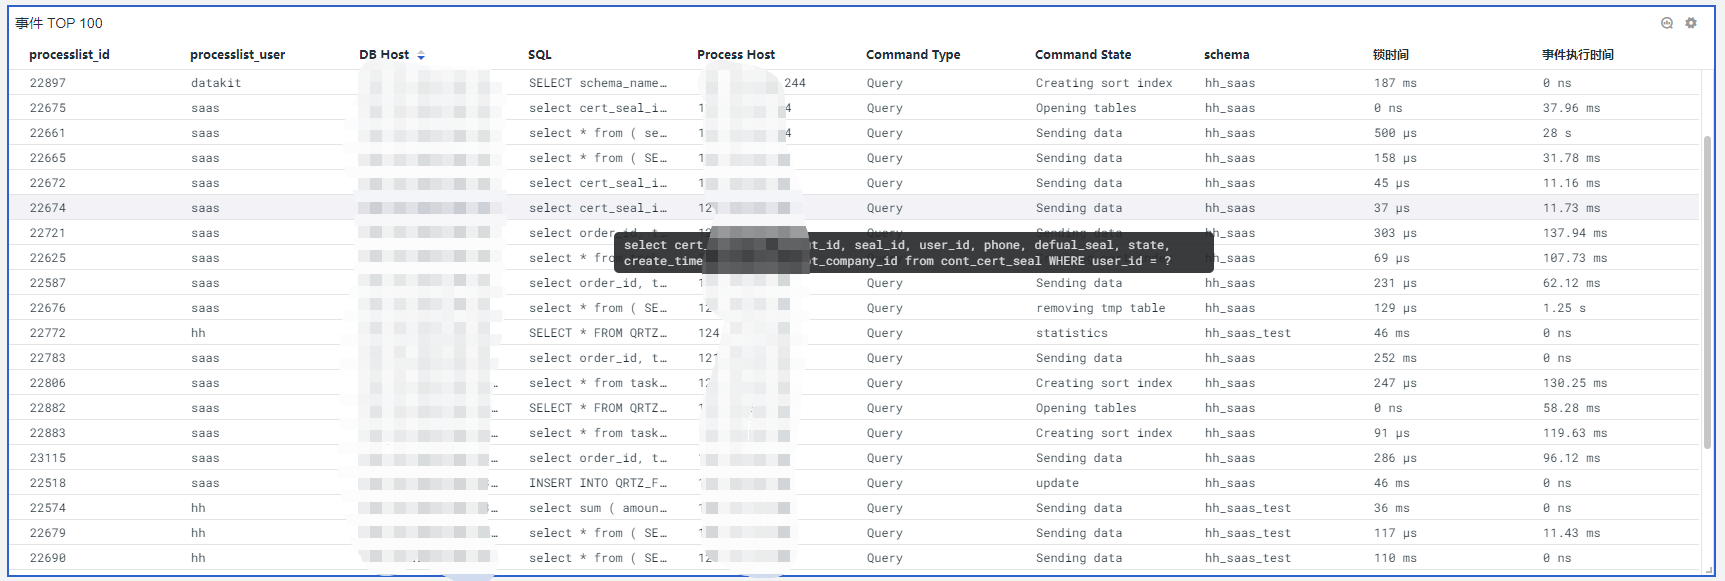
Event List
Top 100 events, including event ID (processlist_id), processlist_user (user to which the event belongs), DB Host (event host), SQL (executing SQL statement), process Host (host that initiated the event), event type, event status, and event execution time.
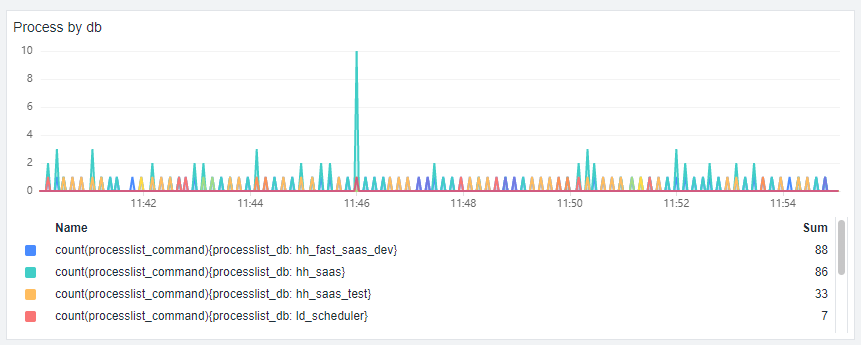
View Process Event Trends by Schema
Analyze the pressure on a schema by viewing the event trend for that schema.
View Templates
[MySQL 监控视图]
[MySQL Activity]
[MySQL dbm Metric]
[MySQL 慢查询]