Idle Cloud Resource Inspection
Background
Cloud computing, as a new IT service model, has developed rapidly, providing convenient, fast, and flexible IT infrastructure and application services for enterprises and individuals, bringing high efficiency and economy. However, as cloud resources gradually become the main part of enterprise data centers, the problem of huge waste of cloud resources becomes increasingly significant. Especially within enterprises, due to demand fluctuations and isolation between departments, some cloud resources cannot be fully utilized, forming a large number of idle resources. This situation can directly increase the cost of an enterprise's cloud services, reduce resource efficiency, and possibly lower security and performance levels. To better manage and optimize idle cloud resources and improve the benefits and utilization rate of cloud computing usage, performing idle cloud resource inspections is very necessary. Through inspections, unnecessary resources in current cloud services can be discovered and handled in time, avoiding unnecessary expenses, data leaks, poor performance, and other issues caused by long-term unused resources.
Prerequisites
- Self-built DataFlux Func Guance Special Edition or subscribe to DataFlux Func (Automata)
- In Guance "Management / API Key Management", create an API Key for operations.
Note: If you consider using a cloud server for offline deployment of DataFlux Func, please ensure it is with the same operator and region as your currently used Guance SaaS deployment same operator same region.
Starting the Inspection
In the self-built DataFlux Func, install "Guance Self-Built Inspection (Idle Cloud Resource Inspection)" via the "Script Market" and complete the activation by configuring the Guance API Key according to the instructions.
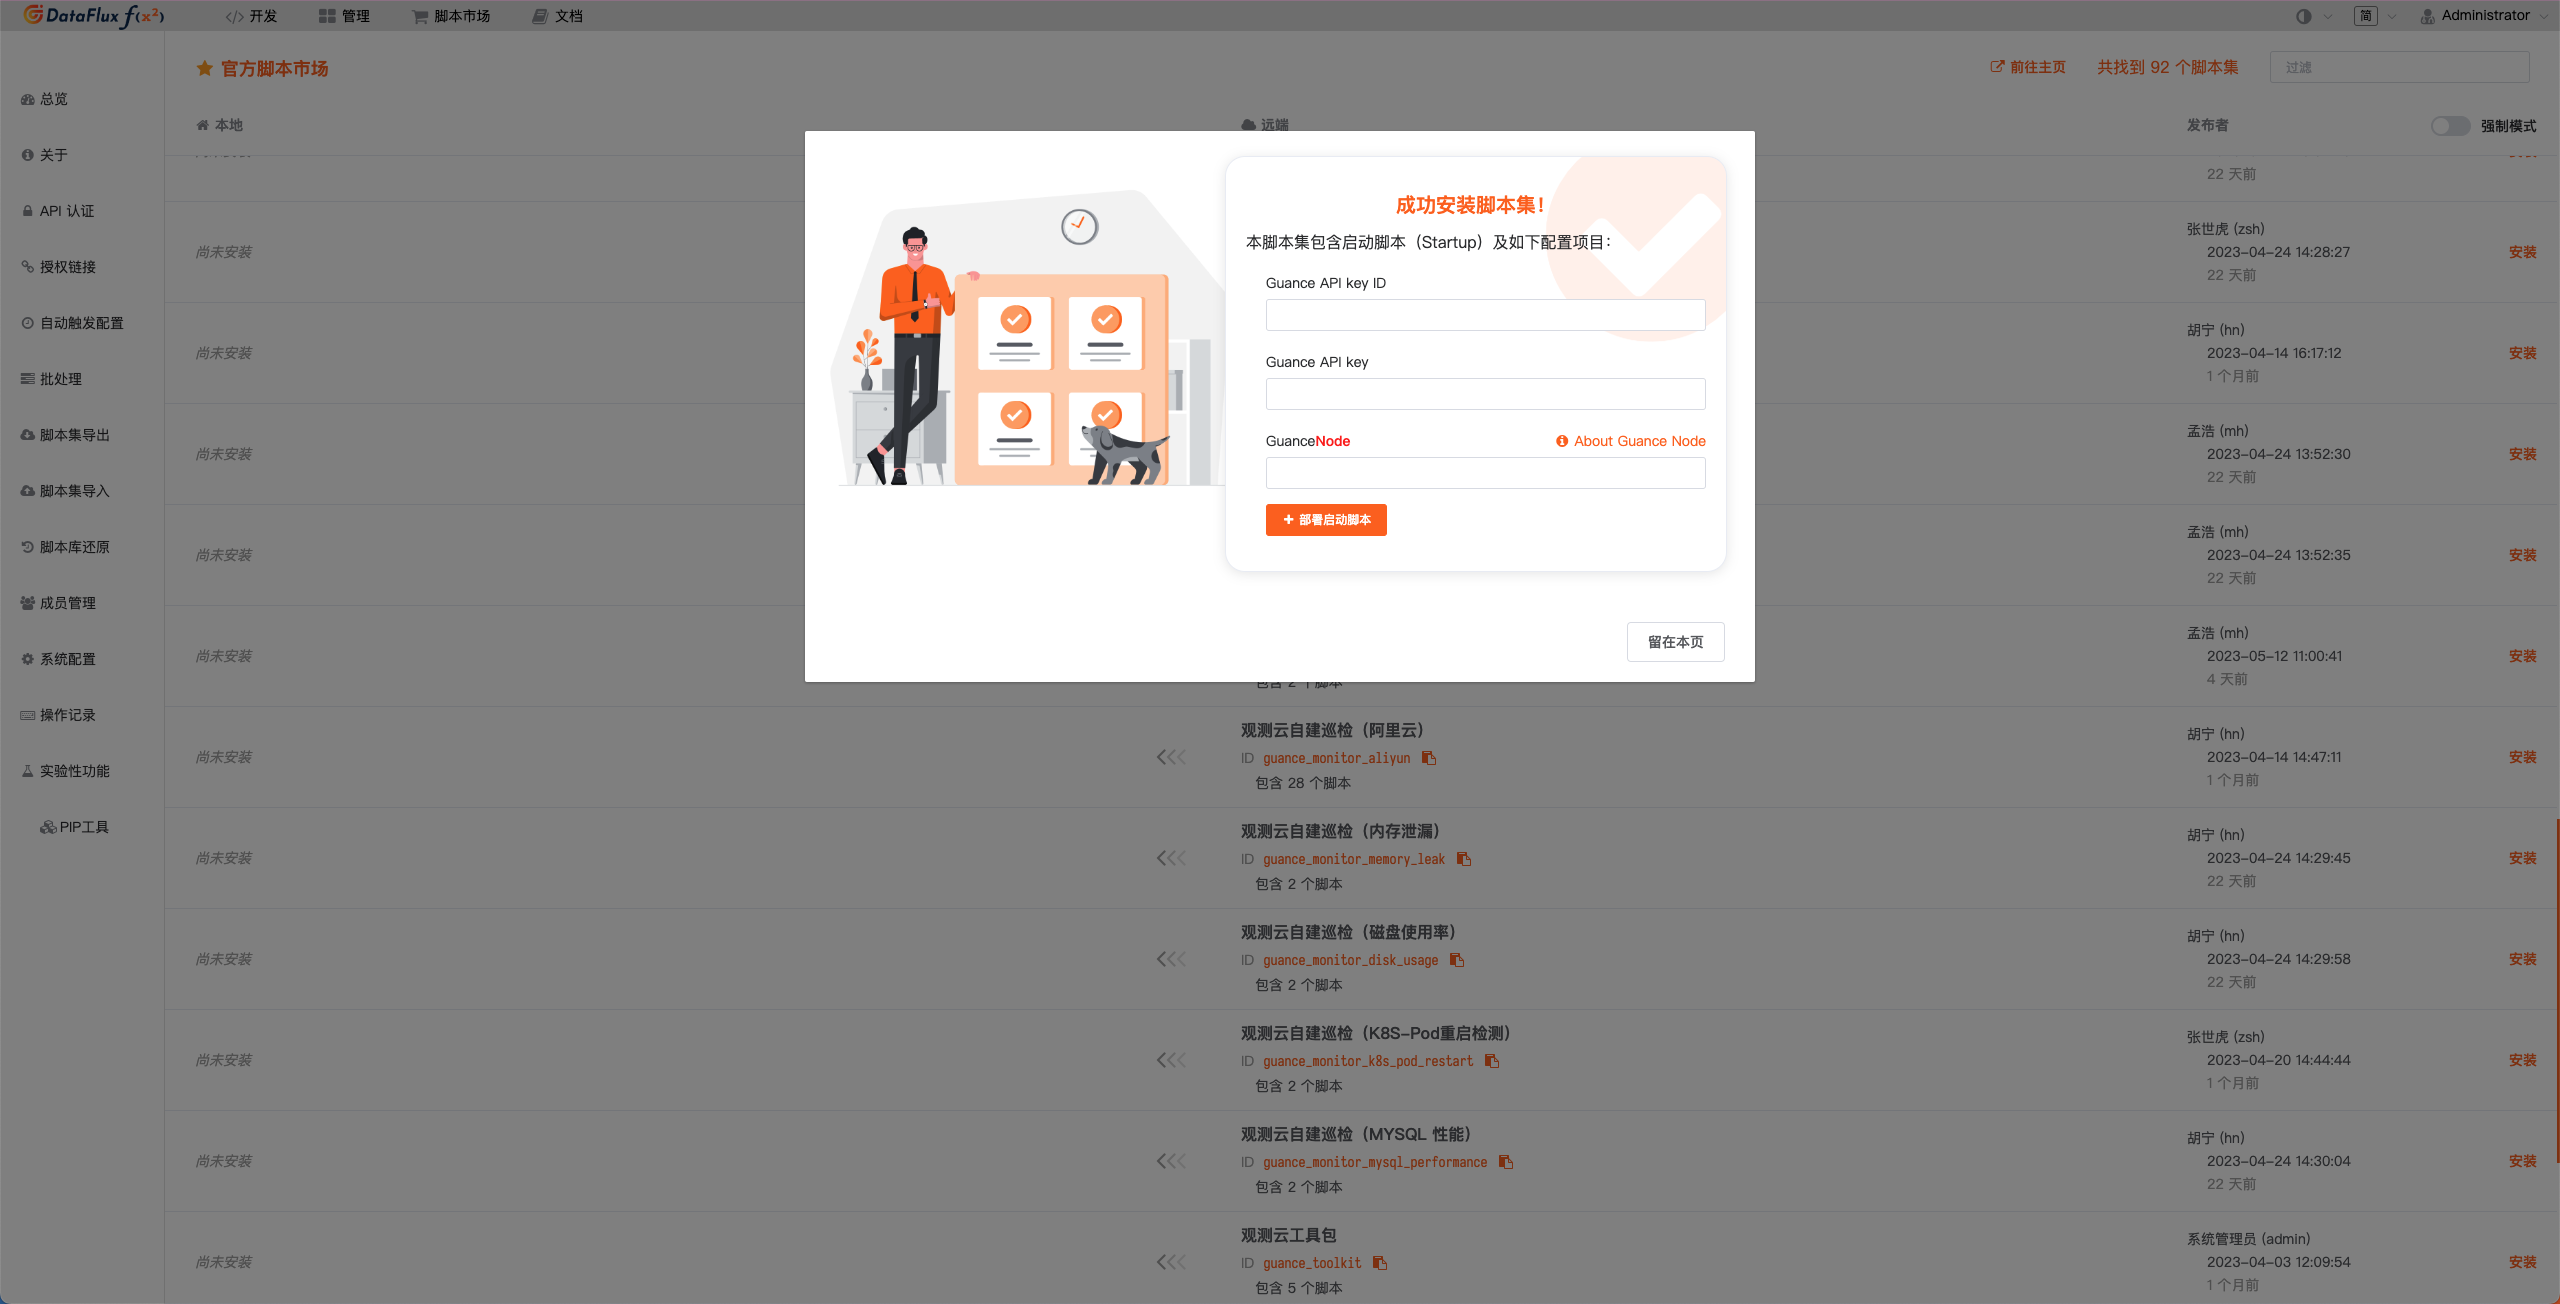
In the DataFlux Func Script Market, select the inspection scenario you want to start, click Install, configure the Guance API Key and GuanceNode then choose to deploy and start the script.
Note: If you need to inspect idle resources from different cloud vendors, additional collectors must be enabled.
AWS: Guance Integration (AWS-EC2 Collection), Guance Integration (AWS-CloudWatch Collection) - mem
Huawei: Guance Integration (Huawei Cloud - Cloud Monitoring Collection)
Tencent: Guance Integration (Tencent Cloud - Cloud Monitoring Collection)
Alibaba: Guance Integration (Alibaba Cloud - Cloud Monitoring Collection)
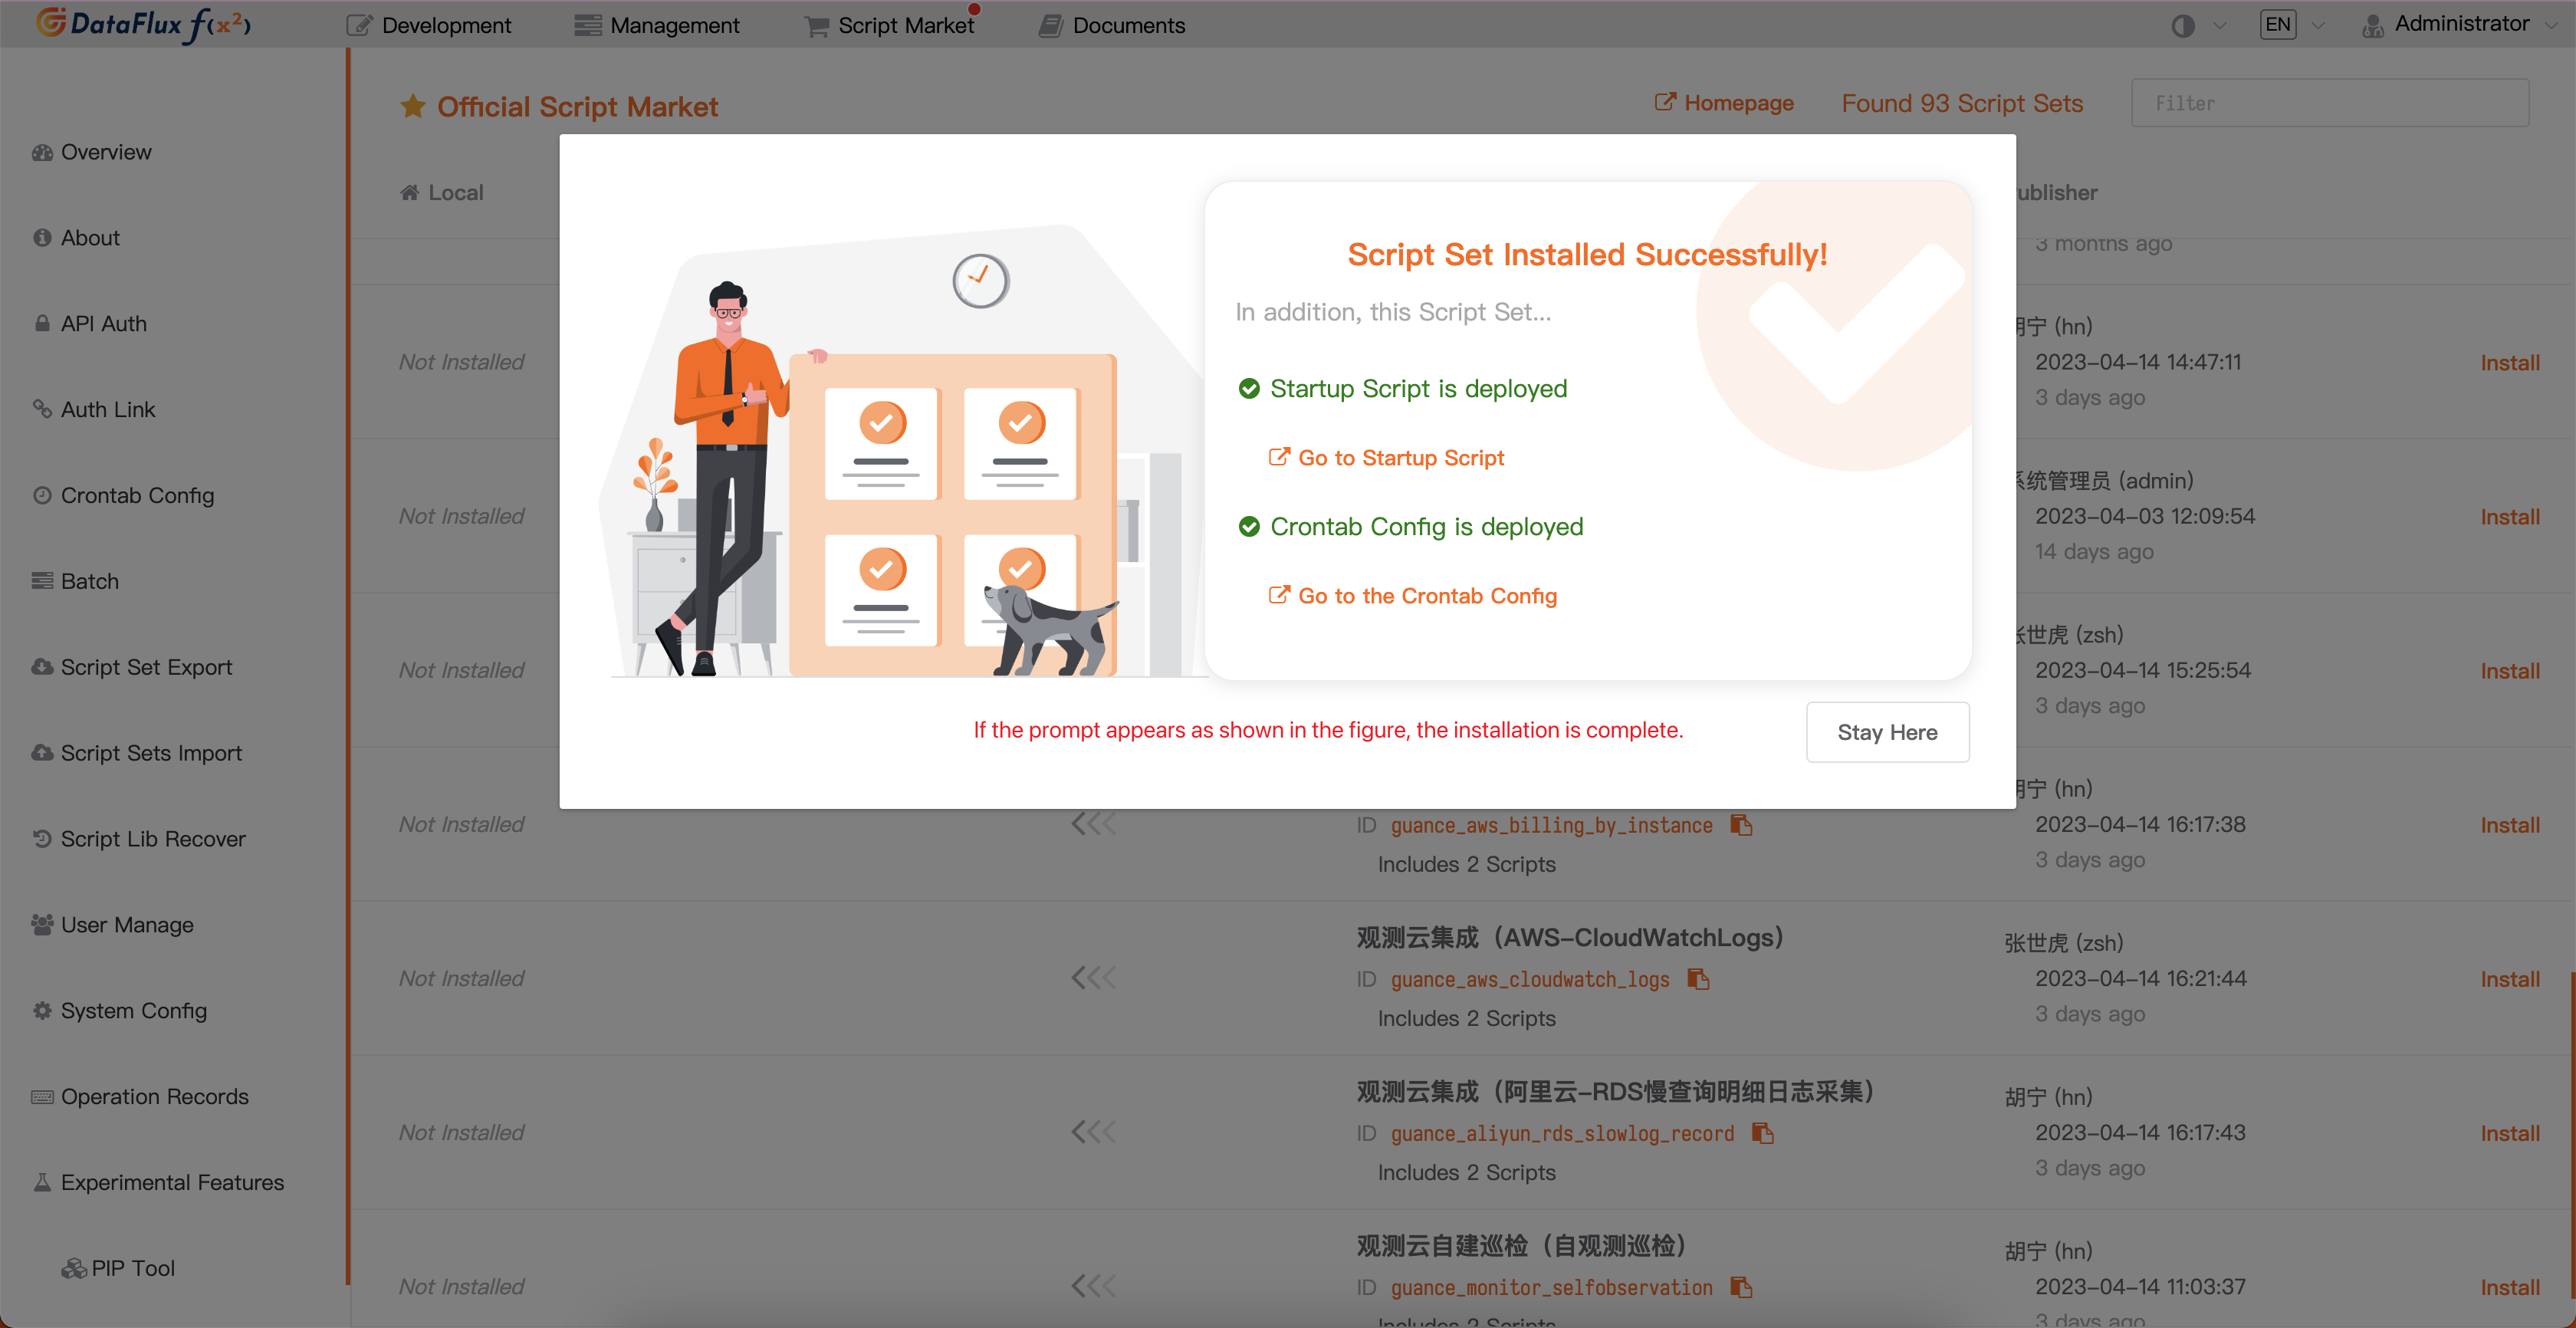
After the startup script deployment succeeds, it will automatically create the startup script and automatic trigger configuration, allowing you to directly jump to and view the corresponding configuration through the link.
Configuring the Inspection
In the Guance Studio Monitoring - Intelligent Inspection module or the automatically created startup script in DataFlux Func, configure the inspection conditions you wish to filter. You can refer to the two configuration methods below.
Configuration of Inspection in Guance
Enable/Disable
Idle cloud resource inspection is by default in the "Enabled" state and can be manually "Disabled". Once enabled, it will perform inspections on the configured cloud vendors.
Editing
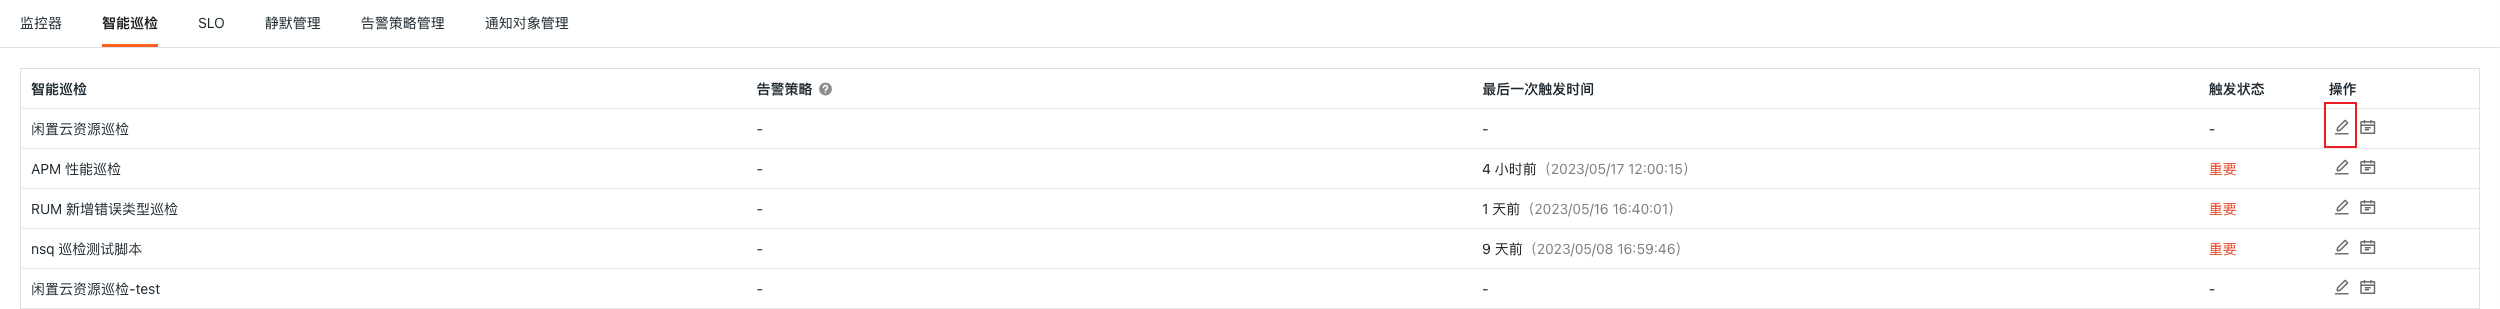
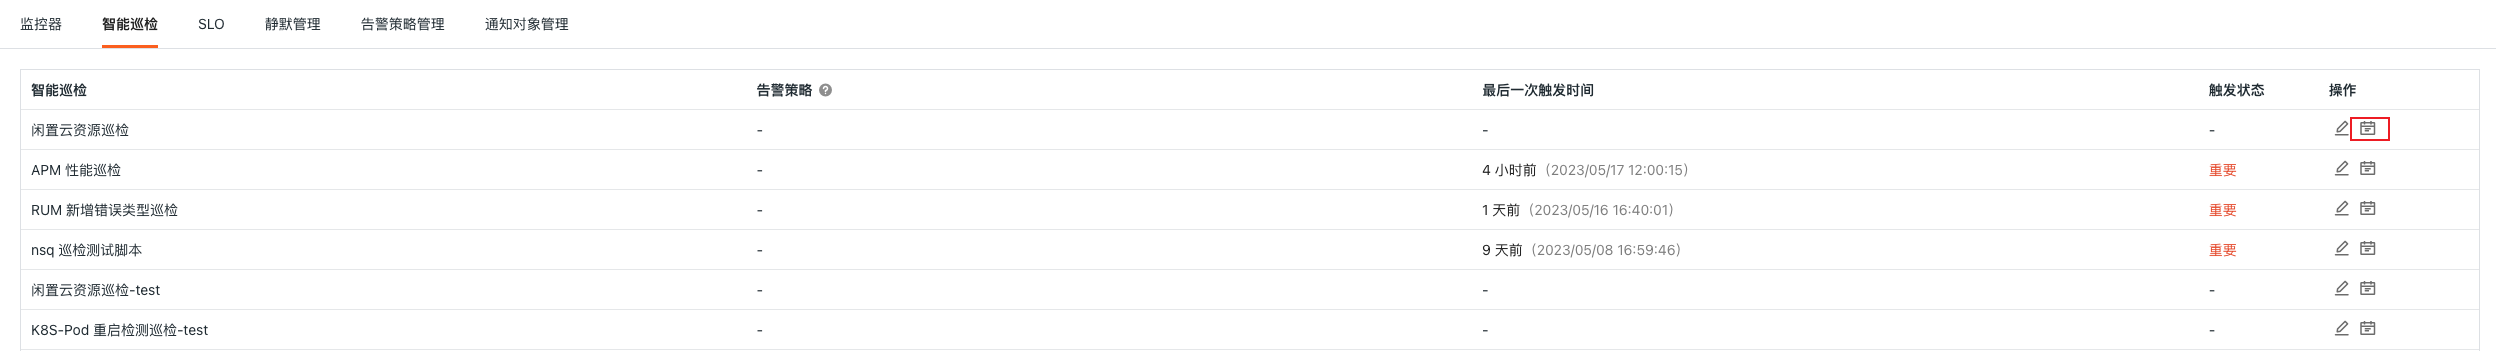
The intelligent inspection "Idle Cloud Resource Inspection" supports users manually adding filtering conditions. Click the Edit button under the operation menu on the right side of the intelligent inspection list to edit the inspection template.
- Filtering Conditions: Configure the information of the cloud vendor(s) to be inspected (it is recommended to configure different cloud vendors separately).
- Alert Notifications: Supports selecting and editing alert strategies, including event levels to notify, notification targets, and alert silence cycles.
To configure entry parameters, click Edit and fill in the corresponding detection objects in the parameter configuration and save to start the inspection:
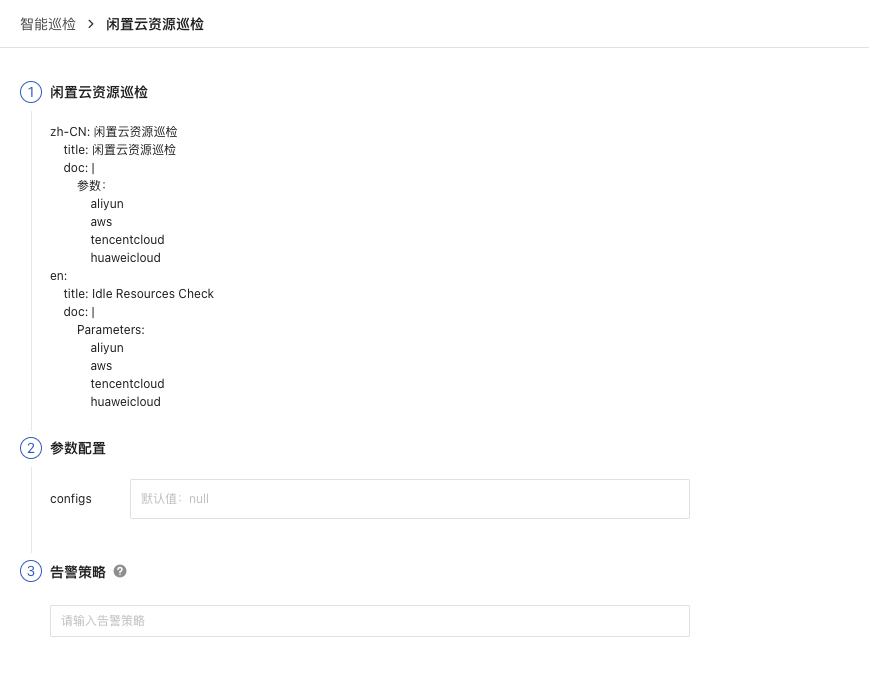
You can refer to the following configurations:
Viewing Events
Based on Guance inspection algorithms, intelligent inspection will find corresponding idle cloud resources from the configured cloud vendors. For abnormal resource idling situations, intelligent inspection will generate corresponding events. Click the View Related Events button under the operation menu on the right side of the intelligent inspection list to view corresponding abnormal events.
Event Details Page
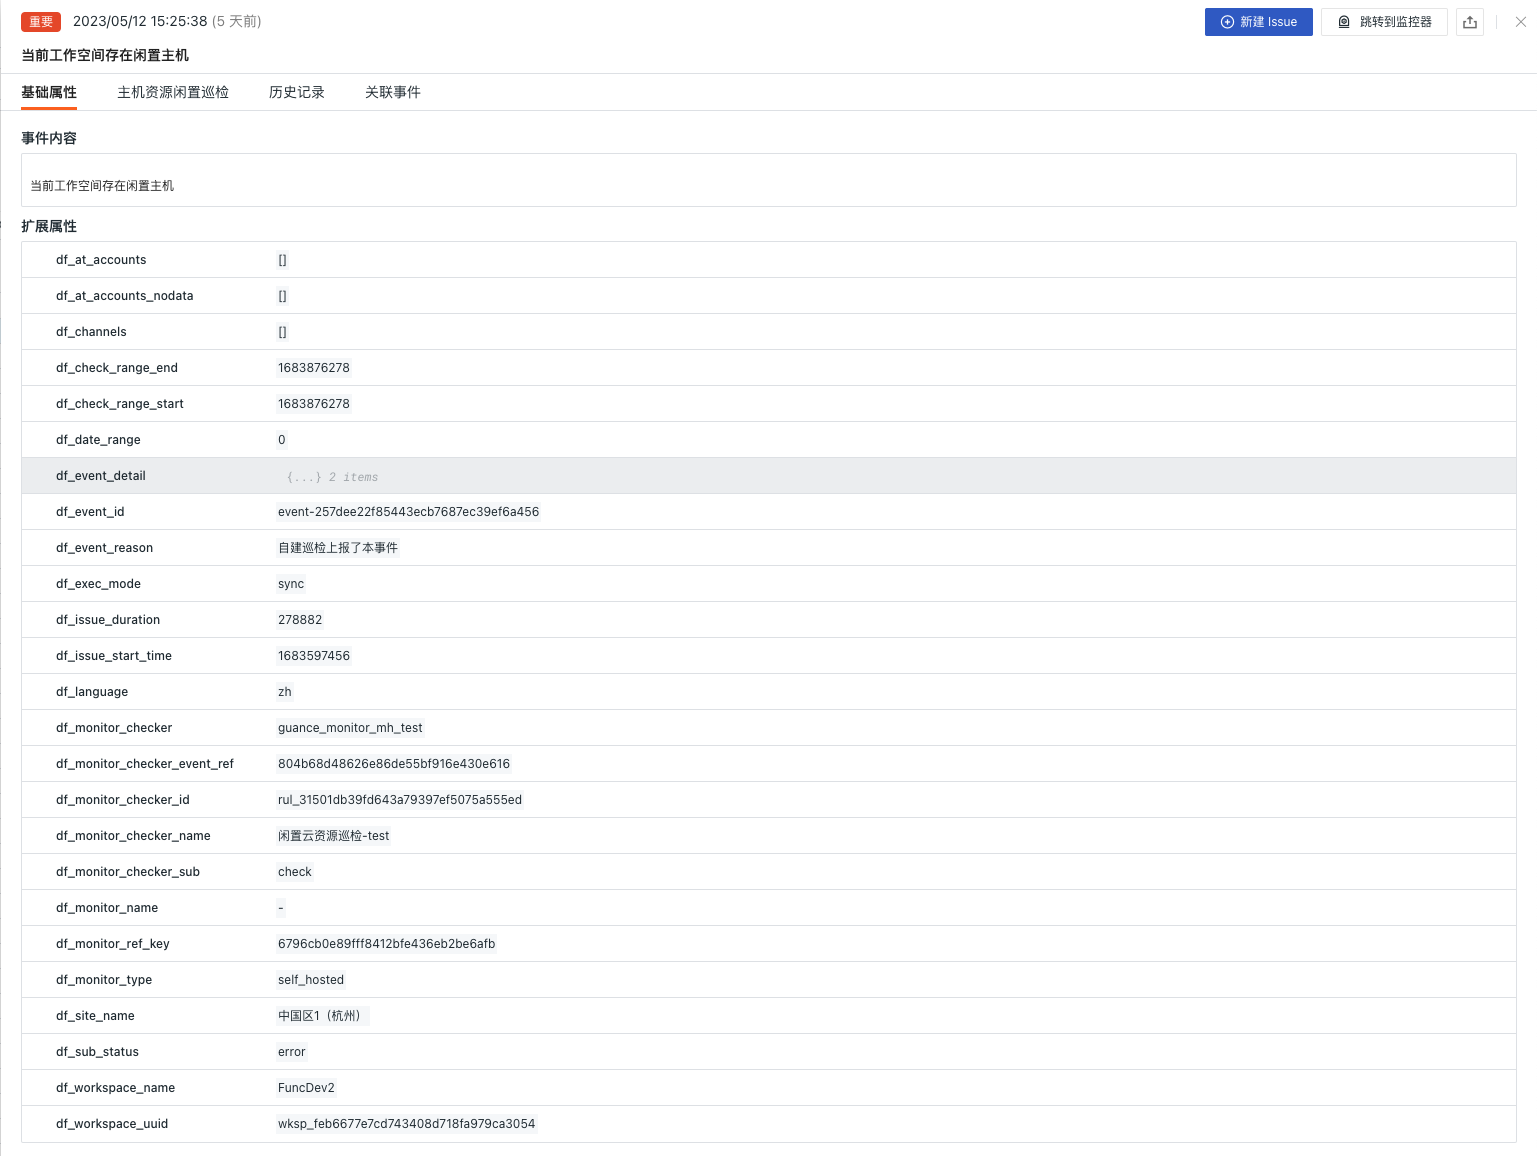
Clicking Event, you can view the details page of the intelligent inspection event, including event status, the time of anomaly occurrence, anomaly name, basic attributes, event details, alert notifications, historical records, and related events.
- Clicking the small icon "View Monitor Configuration" in the upper-right corner of the detail page allows you to view and edit the configuration details of the current intelligent inspection.
Basic Attributes
- Detection Dimensions: Based on the filtering conditions configured in the intelligent inspection, it supports copying
key/value, adding to filters, and viewing related logs, containers, processes, security checks, traces, user analysis, synthetic tests, and CI data. - Extended Attributes: After selecting extended attributes, it supports copying in
key/valueform, forward/reverse filtering.
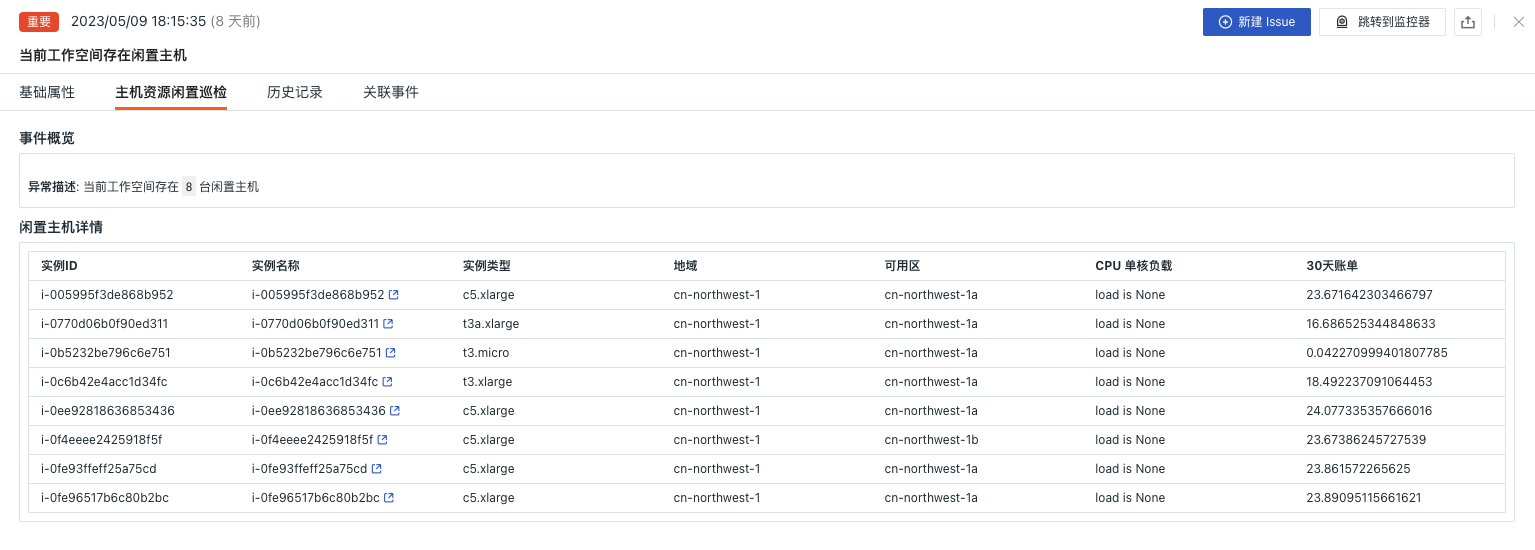
Event Details
- Event Overview: Describes the object and content of the abnormal inspection event.
- Idle Host Details: View the situation of idle hosts and consumption under the current cloud account.
Note: When querying fails for some host resource catalog data in the workspace and detailed host information cannot be obtained, please check whether the resource catalog data reporting is correct.
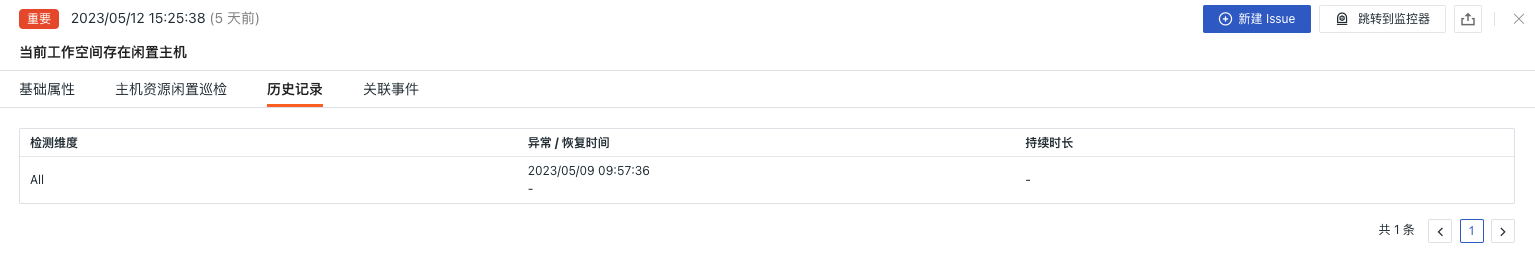
Historical Records
Supports viewing the detection object, abnormal/recovery time, and duration.
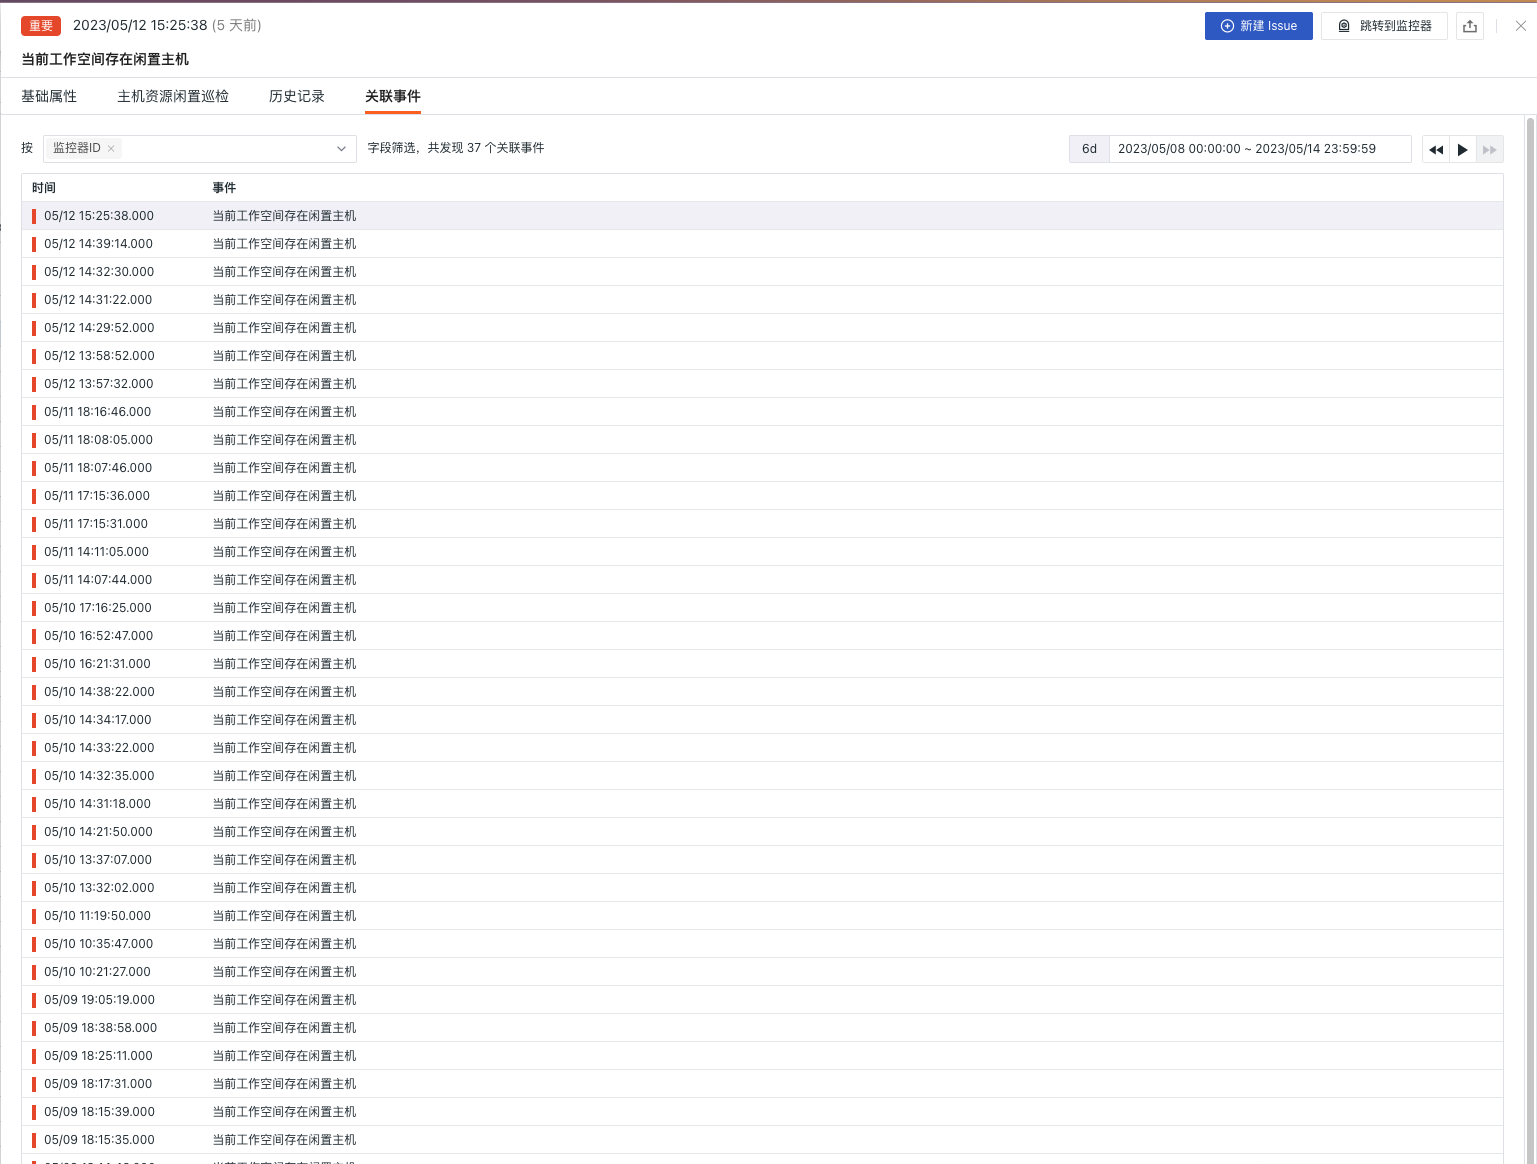
Related Events
Supports viewing associated events through filtering fields and selected time component information.
Common Issues
1. How to configure the detection frequency of idle cloud resource inspections
In the self-built DataFlux Func, when writing custom inspection processing functions, add fixed_crontab='0 * * * *', timeout=900 in the decorator, and then configure it in "Management / Automatic Trigger Configuration."
2. Why might there be no anomaly analysis during idle cloud resource inspections
When there is no anomaly analysis in the inspection report, please check the data collection status of the current datakit.
3. Under what circumstances will idle cloud resource inspection events be generated
When it is found that the average CPU utilization per hour over the past 48 hours < 1% and the average memory usage per hour over the past 48 hours < 10% and the total in/out tcp traffic per hour over the past 48 hours is less than 10M.
4. During the inspection process, if previously normal scripts encounter abnormal errors
Please update the referenced script set in the DataFlux Func Script Market. You can view the update records of the Script Market through the Change Log to facilitate immediate script updates.
5. During the upgrade of the inspection script, if the corresponding script set in Startup shows no changes
First delete the corresponding script set, then click the Upgrade button and configure the corresponding Guance API key to complete the upgrade.
6. After enabling inspections, how to determine if the inspection is effective
In "Management / Automatic Trigger Configuration," view the corresponding inspection status. The status should first be Enabled, and secondly, you can verify if there are any issues with the inspection script by clicking Execute. If the message "Executed successfully xxx minutes ago" appears, the inspection is running normally and is effective.