Idle HOST Inspection
Background
As businesses grow, the amount of resource usage also increases, leading to larger enterprise data centers and making the problem of significant waste from idle hosts even more prominent. Especially within enterprises, due to fluctuations in demand and isolation between departments, some hosts are not fully utilized, resulting in a large amount of idle resources. This situation can directly increase the cloud service costs for enterprises, reduce resource efficiency, and possibly lower security and performance levels.
Prerequisites
- Self-built DataFlux Func Guance Special Edition or subscribe to DataFlux Func (Automata)
- In Guance's "Manage / API Key Management," create an API Key for operations.
Note: If you consider using a cloud server for offline deployment of DataFlux Func, ensure it is with the same operator and region as the current SaaS deployment of Guance. Refer to Same Operator Same Region.
Start Inspection
In your self-built DataFlux Func, install the "Guance Self-Built Inspection (Idle Host Inspection)" via the "Script Market" and configure the Guance API Key according to the instructions to start.
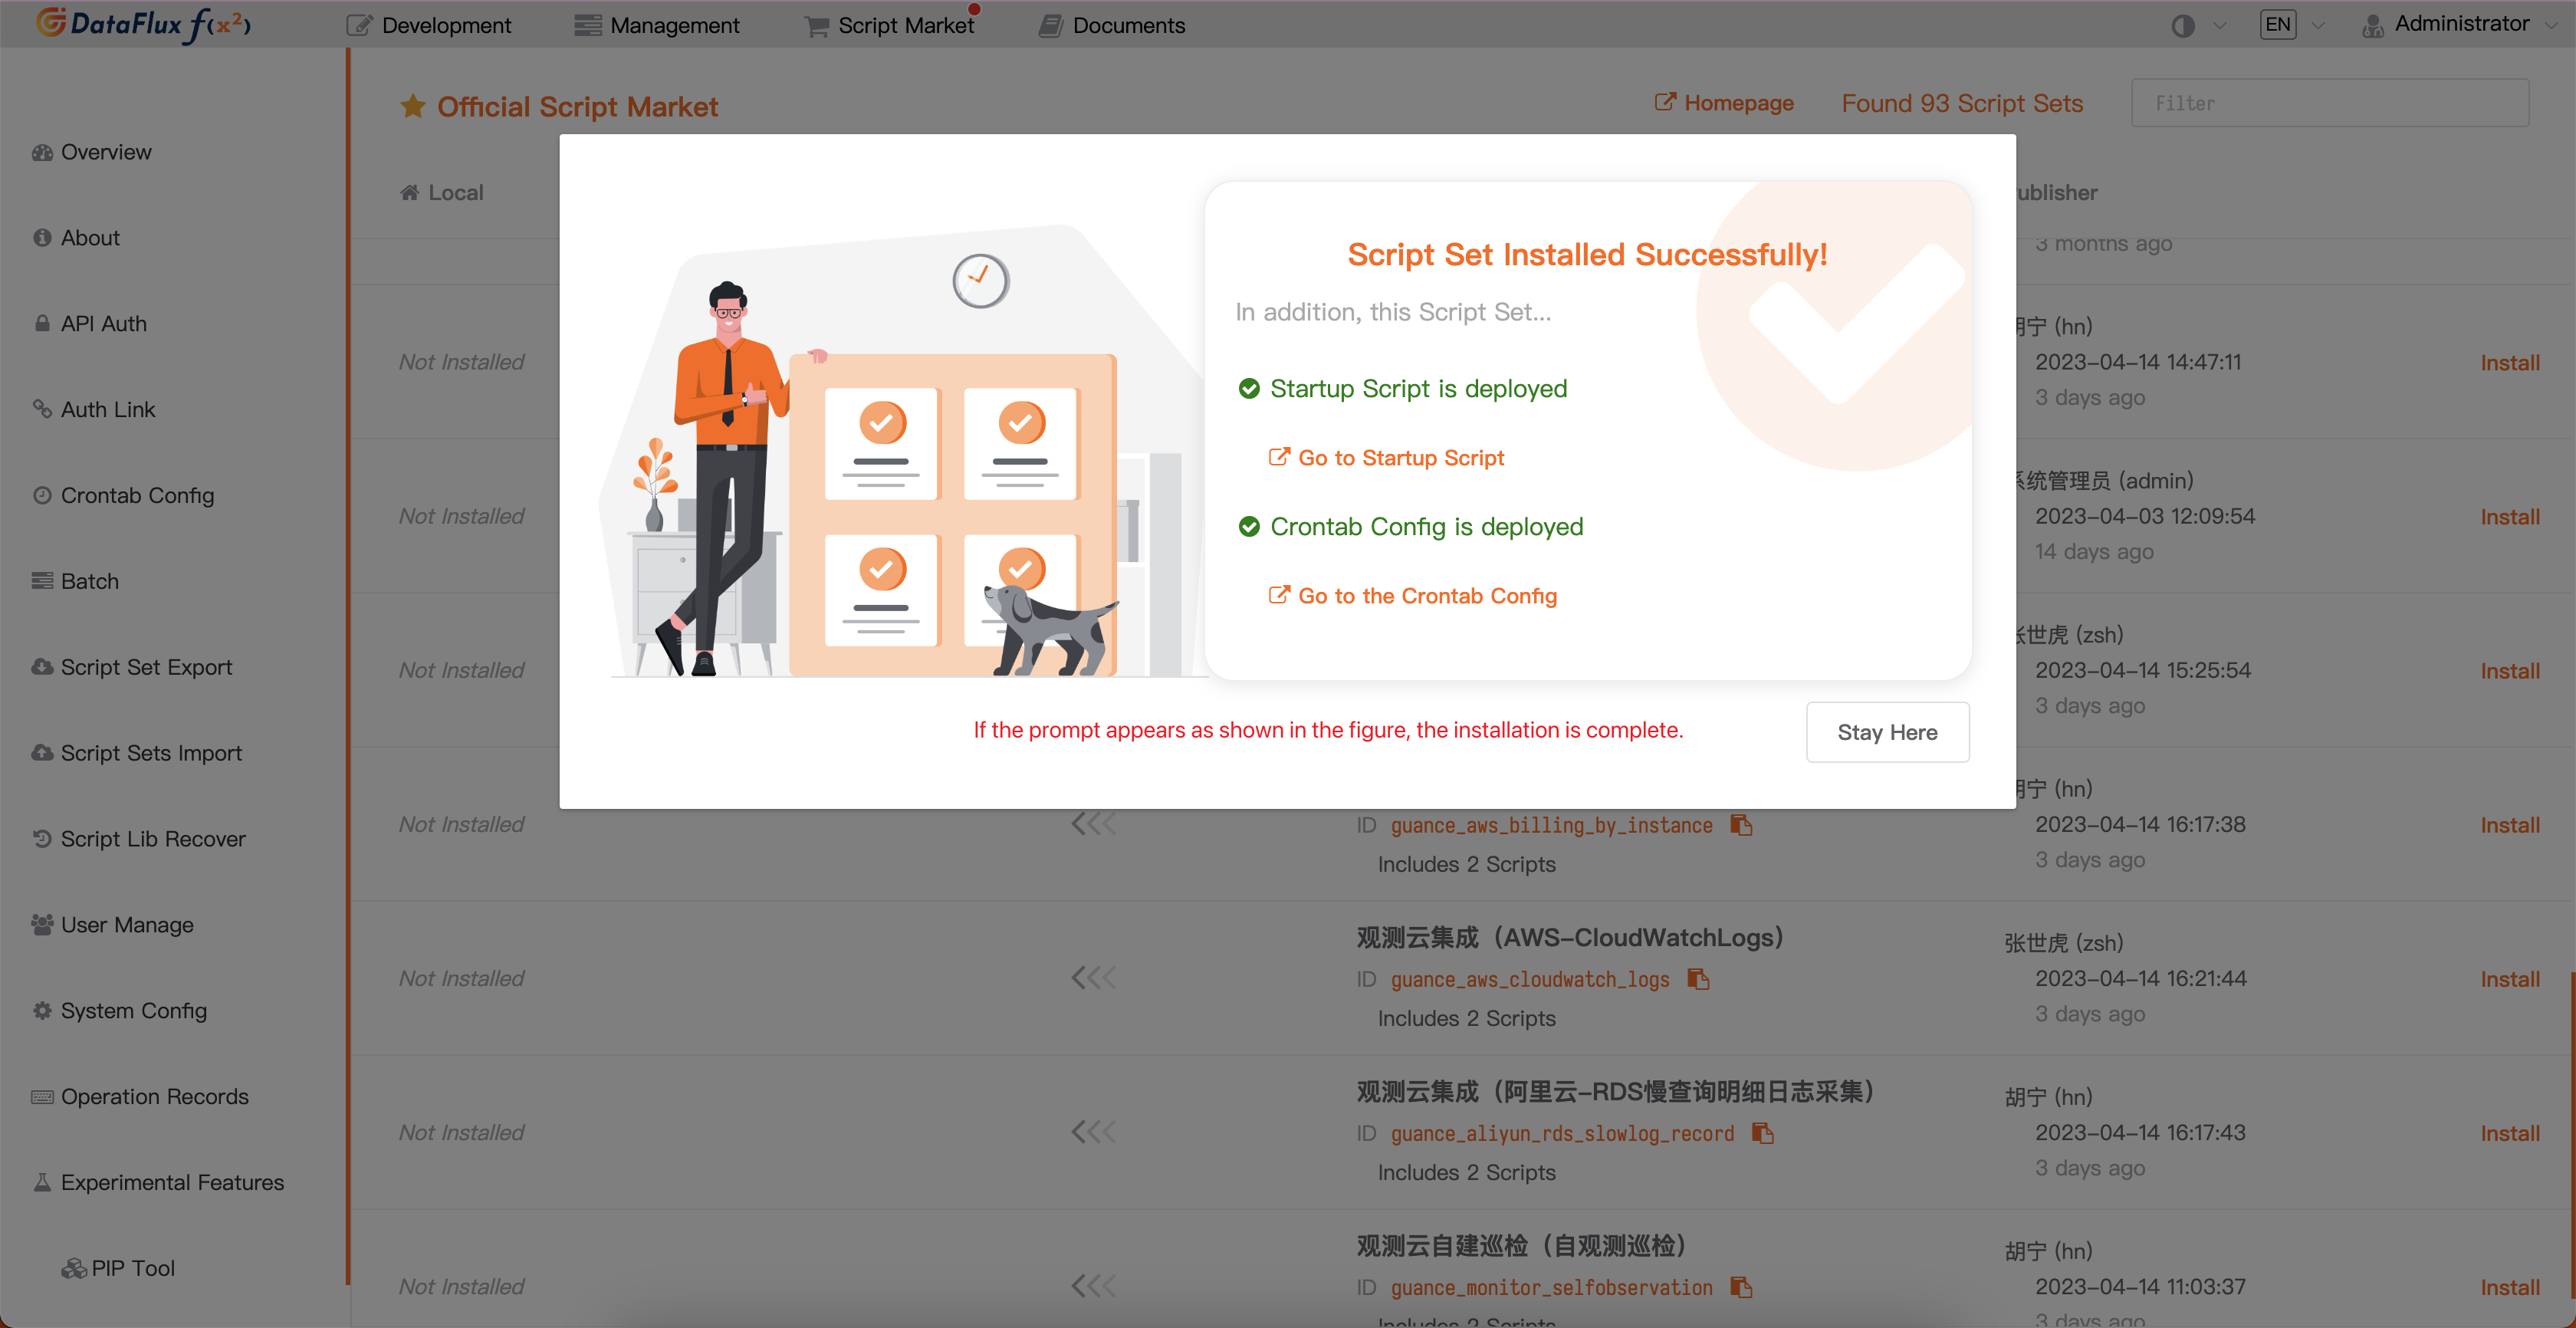
In the DataFlux Func Script Market, select the required inspection scenario to click on installation, configure the Guance API Key and GuanceNode then choose to deploy and start the script.
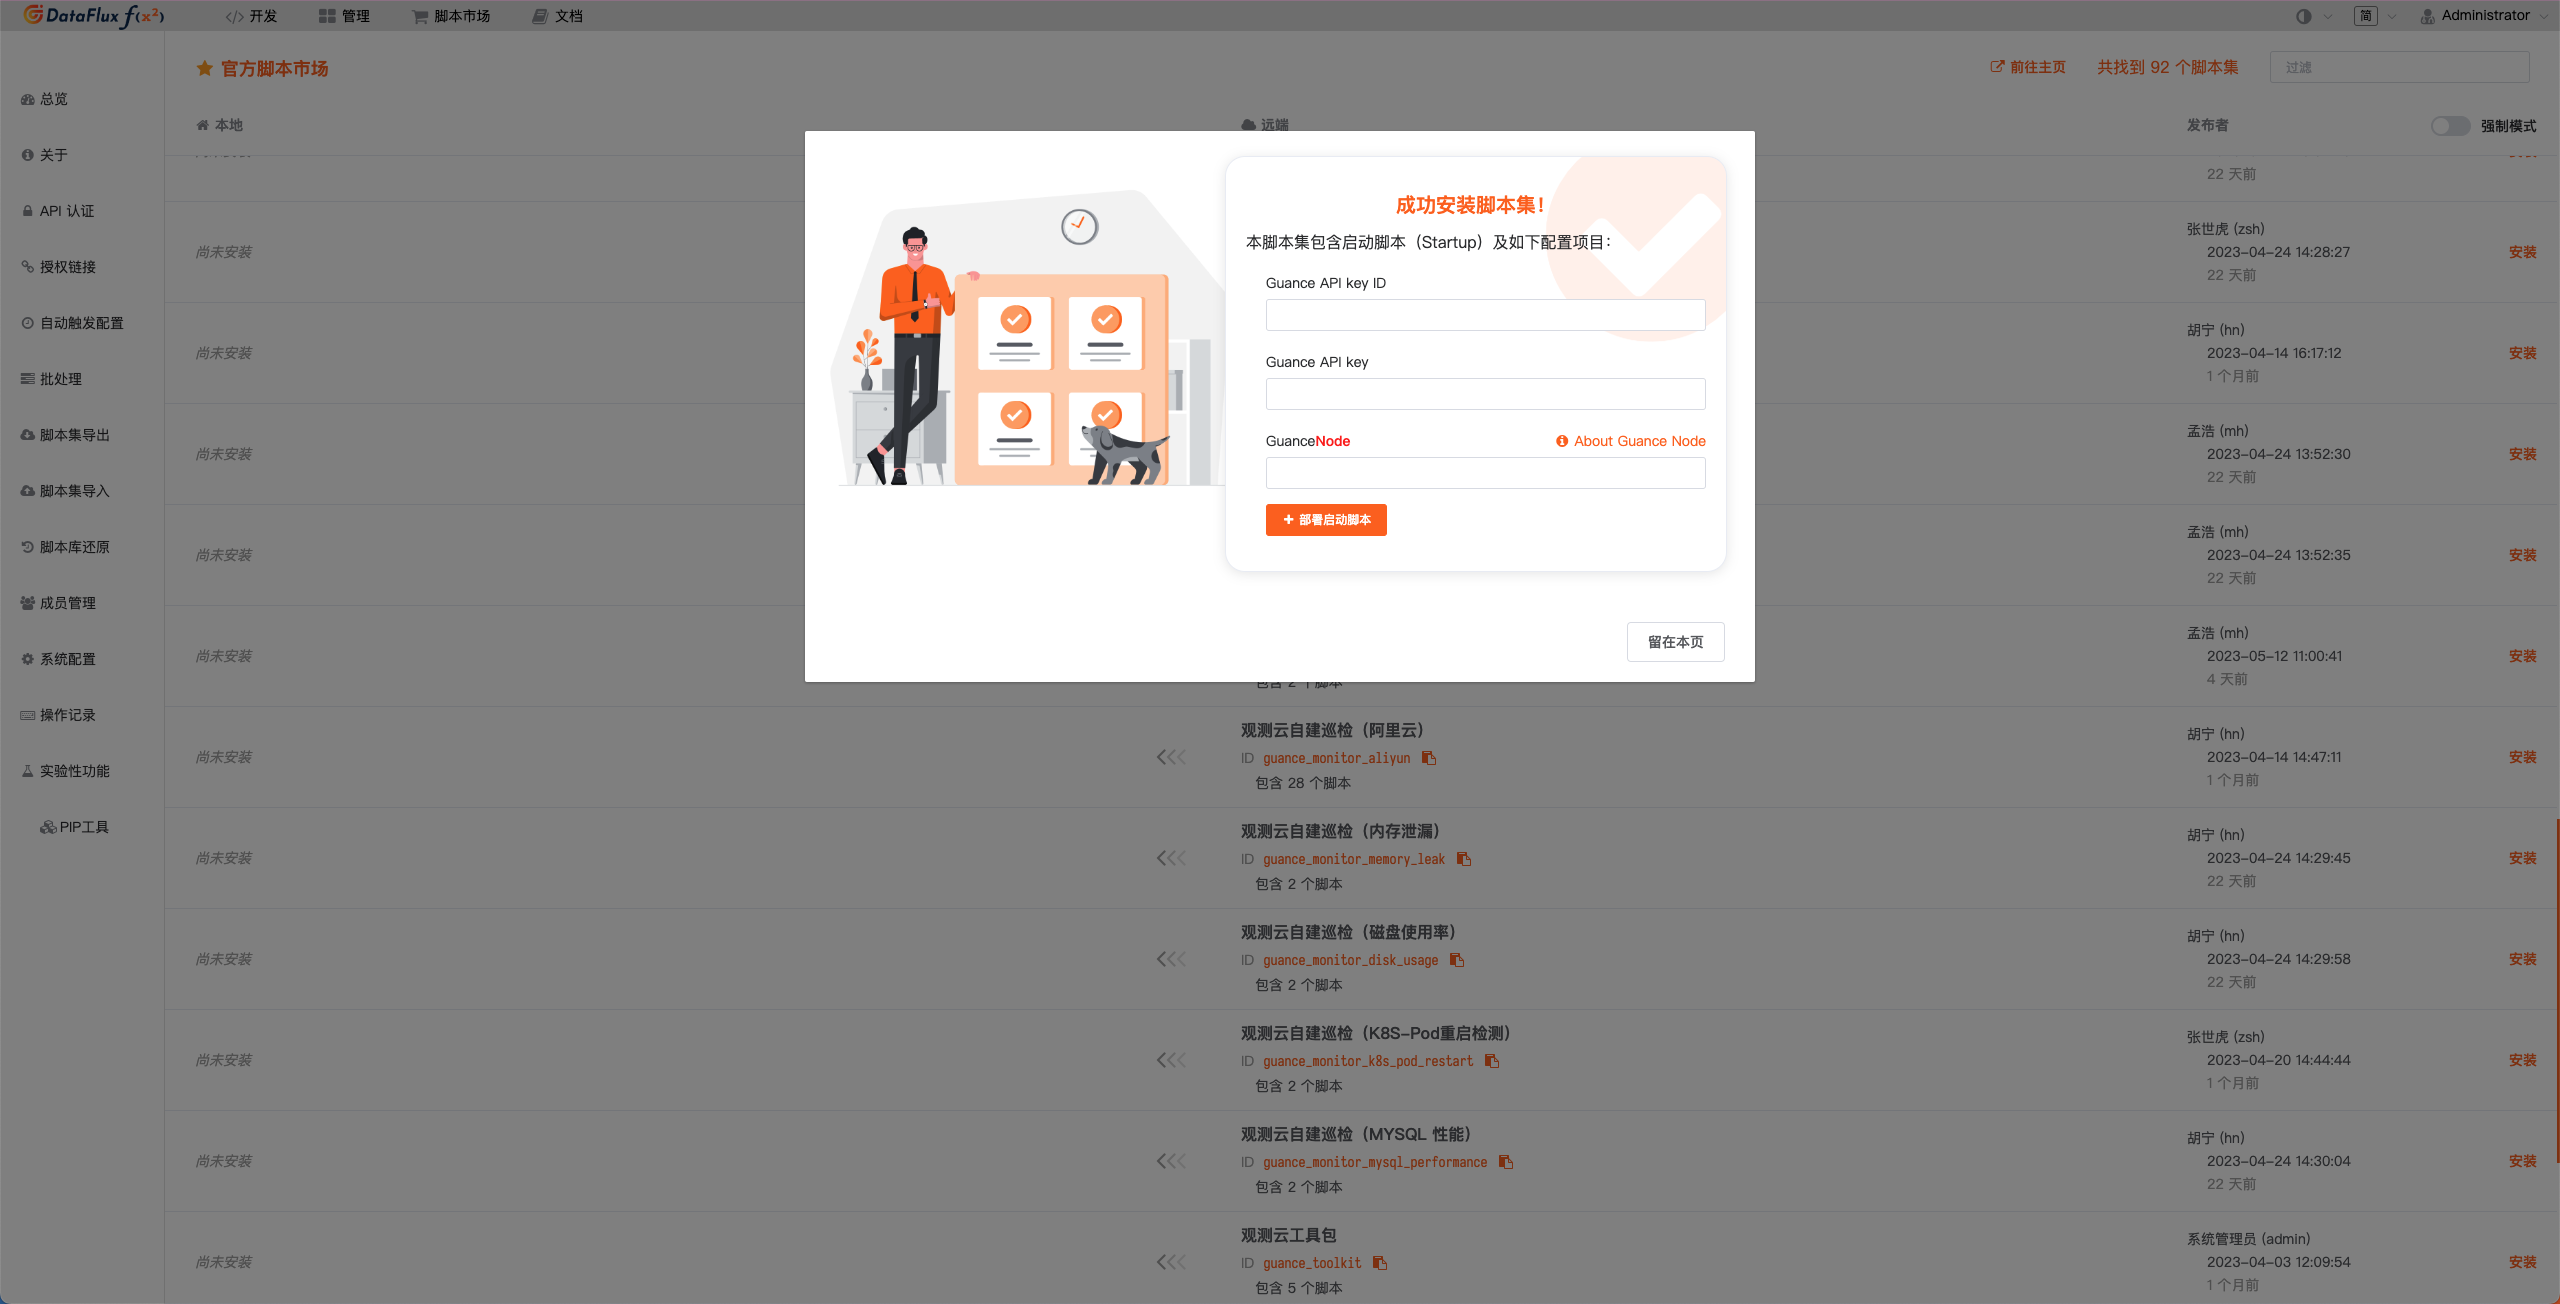
After successfully deploying the startup script, it will automatically create the startup script and auto-trigger configuration. You can directly jump to view the corresponding configuration through the link.
Configure Inspection
Configuration of Inspection in Guance
Enable/Disable
The idle host inspection is by default "Enabled" and can be manually "Disabled." After enabling, it will inspect the configured list of idle host inspections.
Edit
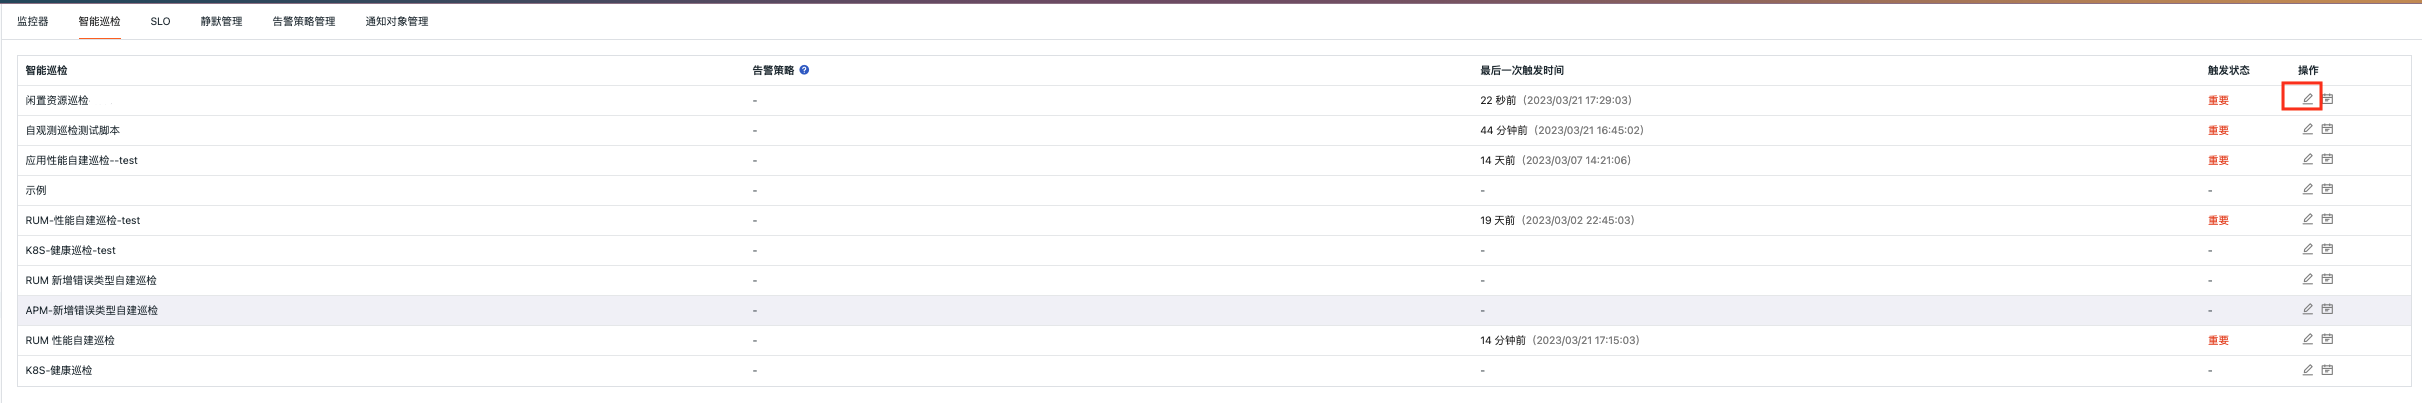
The "Idle Host Inspection" supports users adding manual filtering conditions. Under the operation menu on the right side of the intelligent inspection list, click the Edit button to edit the inspection template.
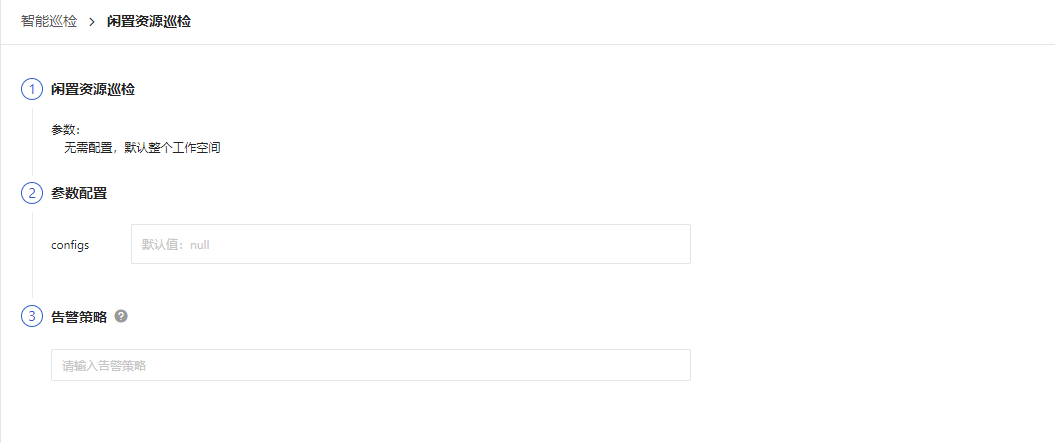
- Filtering Conditions: No parameters need to be configured; by default, it inspects all cloud hosts in the workspace.
- Alert Notifications: Supports selecting and editing alert strategies, including event severity level, notification targets, and alert mute periods.
To configure the entry parameters, click Edit, fill in the corresponding detection objects in the parameter configuration, and save to start the inspection:
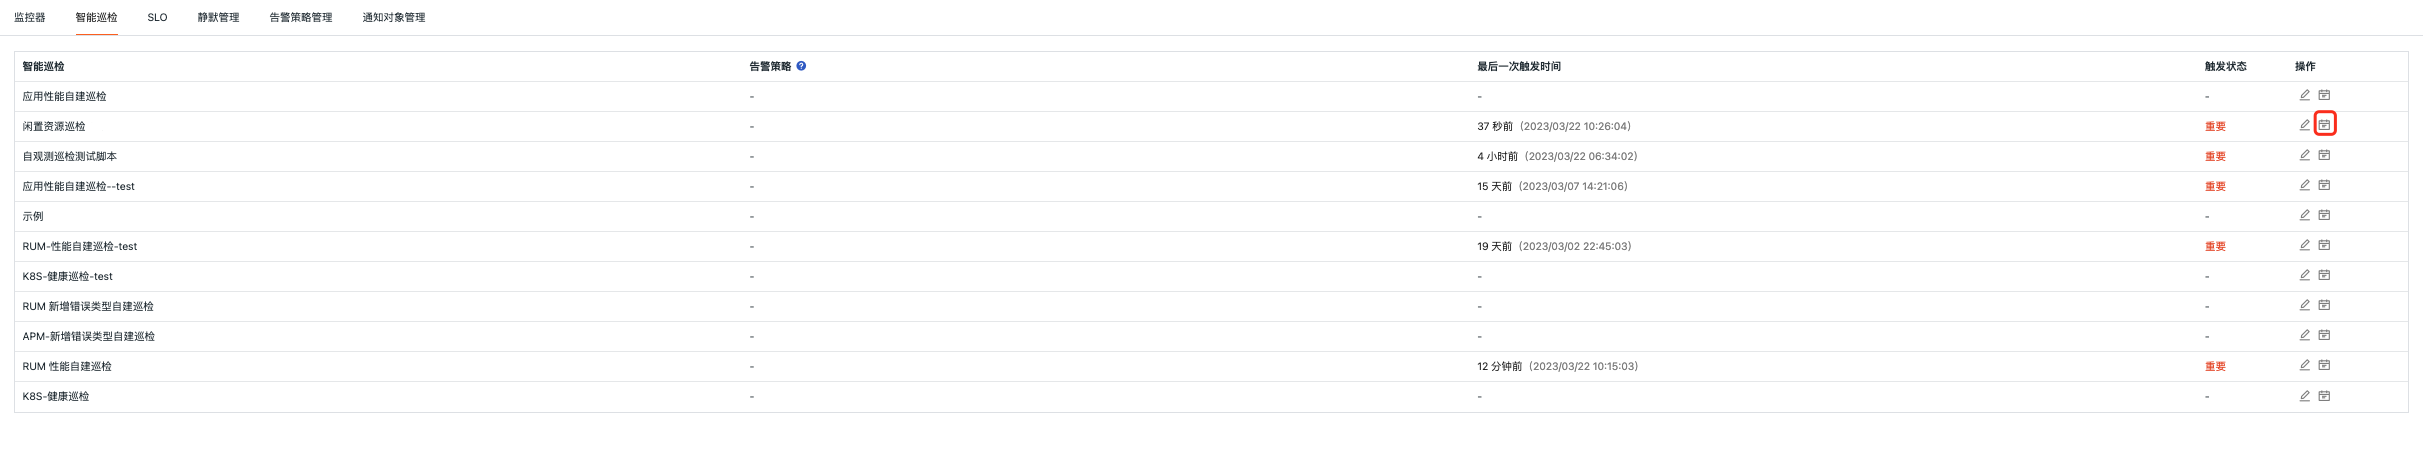
View Events
Guance inspects the status of the hosts in the current workspace. When it detects that a host is idle, the intelligent inspection generates a corresponding event. Under the operation menu on the right side of the intelligent inspection list, click the View Related Events button to view the corresponding abnormal events.
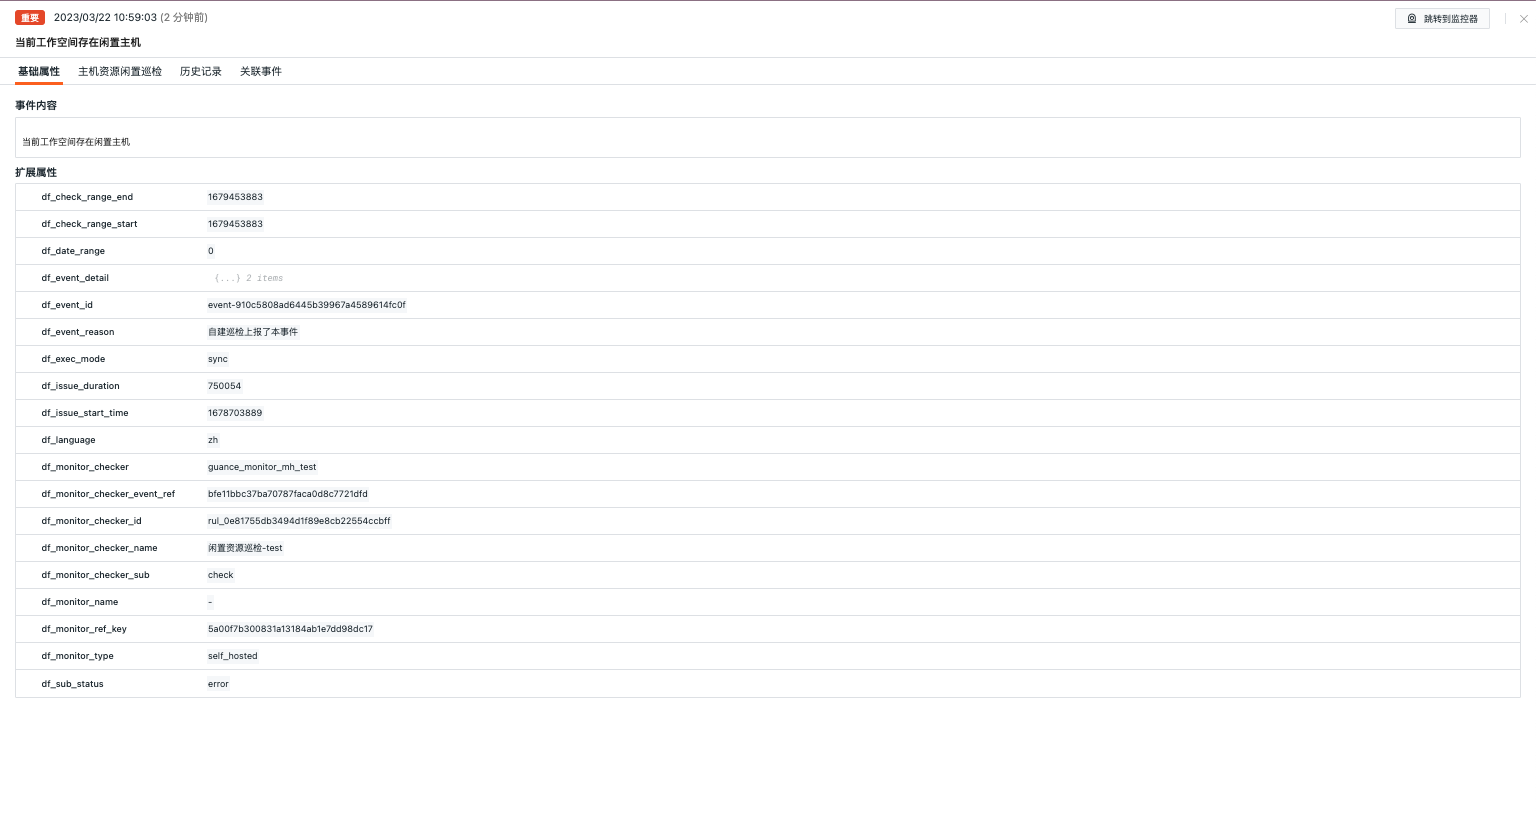
Event Details Page
Click Event to view the details page of the intelligent inspection event, including event status, time of anomaly occurrence, anomaly name, basic attributes, event details, alert notifications, history records, and related events.
- Clicking the small icon in the top-right corner of the details page labeled "View Monitor Configuration" allows you to view and edit the current intelligent inspection configuration details.
Basic Attributes
- Detection Dimensions: Based on the screening conditions of the intelligent inspection configuration, it supports copying
key/value, adding to filters, and viewing logs, containers, processes, security checks, traces, user analysis, synthetic tests, and CI-related data. - Extended Attributes: After selecting extended attributes, it supports copying in
key/valueform, forward/reverse filtering.
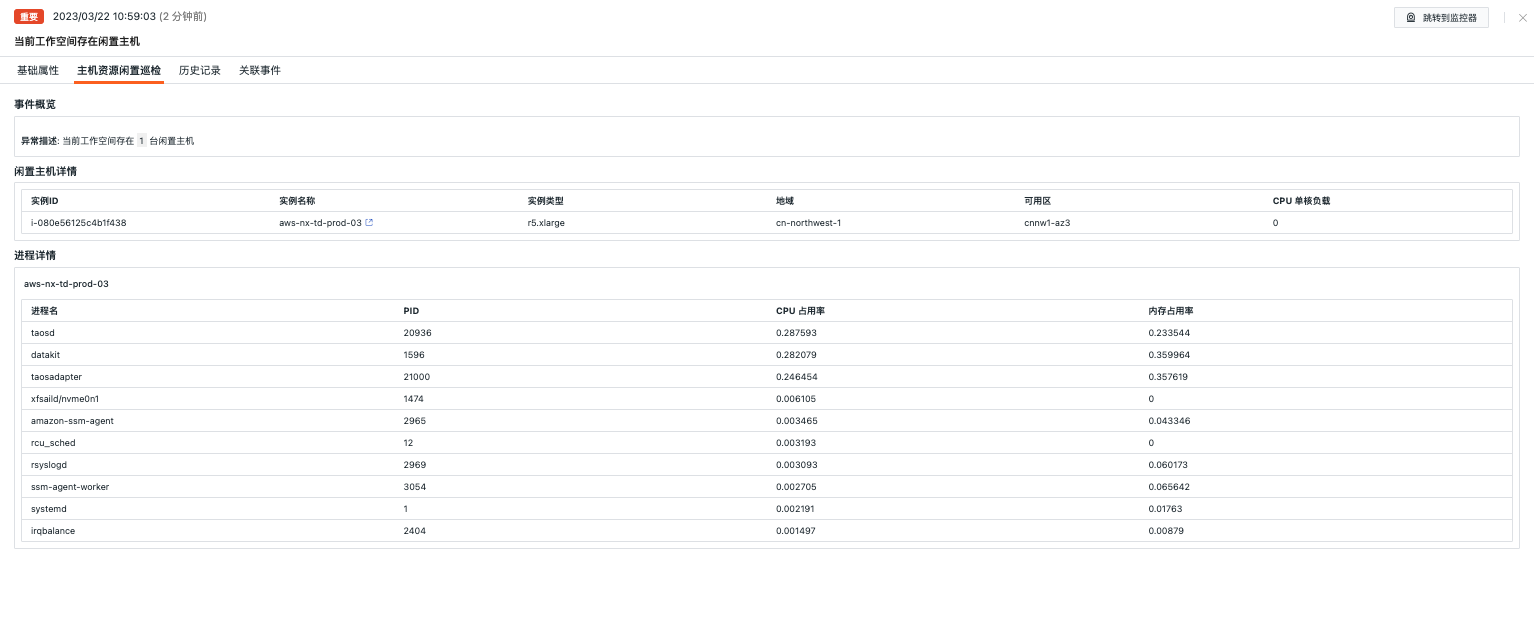
Event Details
Idle host inspection detects the operational status of cloud hosts and generates corresponding event reports when idle conditions are detected.
- Event Overview: Describes the object and content of the abnormal inspection event.
- Idle Host Details: Displays detailed information about currently idle hosts.
- Process Details: Displays the process state of the idle host to support business diagnostics.
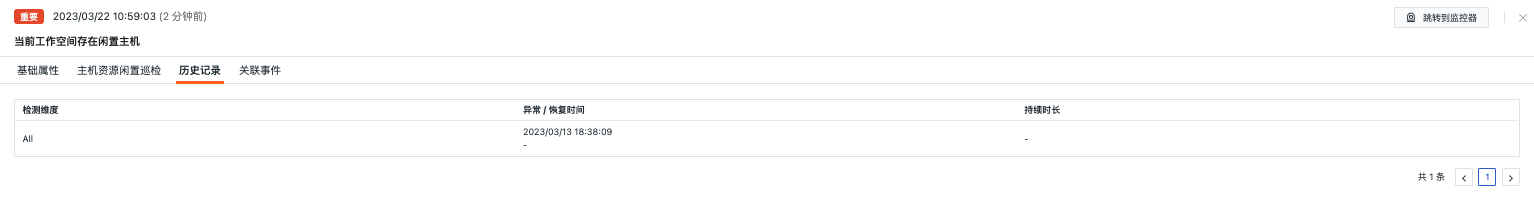
History Records
Supports viewing inspected objects, anomaly/recovery times, and duration.
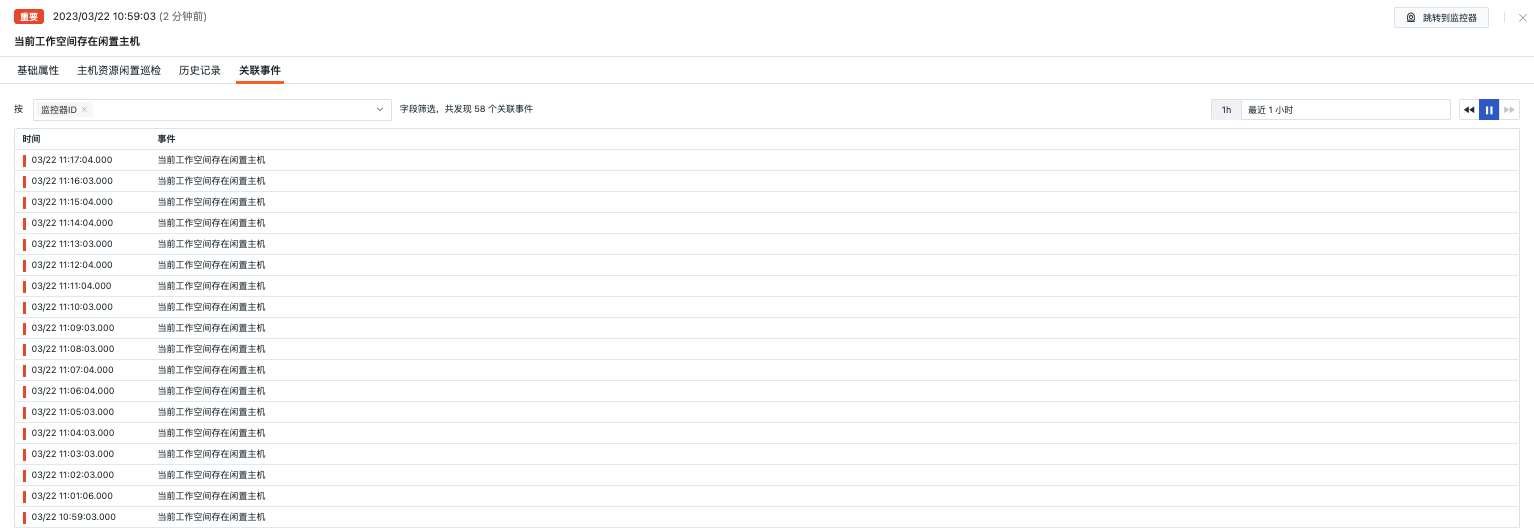
Related Events
Supports viewing related events through filtered fields and selected time component information.
Common Issues
1. How to configure the detection frequency of idle host inspections
- In your self-built DataFlux Func, add
fixed_crontab='0 * * * *', timeout=900in the decorator while writing the self-built inspection processing function. Then configure it in "Manage / Automatic Trigger Configuration."
2. Why might there be no anomaly analysis during idle host inspection triggers
If there is no anomaly analysis in the inspection report, check the data collection status of the current datakit.
3. During the inspection, previously normally running scripts may produce error exceptions
Update the referenced script sets in the DataFlux Func Script Market. You can refer to the Change Log to view the update records of the script market for timely updates.
4. During the upgrade of the inspection script, why does the corresponding script set in Startup show no changes
First delete the corresponding script set, then click the upgrade button and configure the corresponding Guance API key to complete the upgrade.
5. How to determine if the inspection has taken effect after enabling
In "Manage / Automatic Trigger Configuration," view the corresponding inspection status. First, the status should be enabled, and secondly, you can validate whether the inspection script works by clicking execute. If there is a message indicating successful execution minutes ago, then the inspection is running effectively.