RUM Performance Inspection
Background
Real User Monitoring (RUM) is an application performance monitoring technology aimed at evaluating website performance by simulating real user behaviors while browsing websites. The purpose of RUM is to understand website performance from the user's perspective, including website loading time, web page rendering effects, page element loading conditions, and interaction responses. The use cases for RUM performance inspections mainly involve client-side websites, such as e-commerce websites, financial websites, entertainment websites, etc., all of which need to provide users with a fast and smooth access experience. By analyzing RUM performance results, developers can quickly understand the actual user experience to improve website performance.
Prerequisites
- Guance "User Analysis" must have integrated applications already.
- Self-hosted DataFlux Func Guance Special Edition or subscription to DataFlux Func (Automata).
- In Guance "Management / API Key Management," create an API Key for operations.
Note: If considering using cloud servers for offline deployment of DataFlux Func, please ensure it aligns with the current SaaS deployment of Guance on the same provider and region.
Starting Inspection
In your self-hosted DataFlux Func, install "Guance Custom Inspection (RUM Performance)" via the "Script Market" and configure the Guance API Key to activate it.
In the DataFlux Func Script Market, select the inspection scenario you want to start, click Install, configure the Guance API Key and GuanceNode then choose to deploy and start the script.
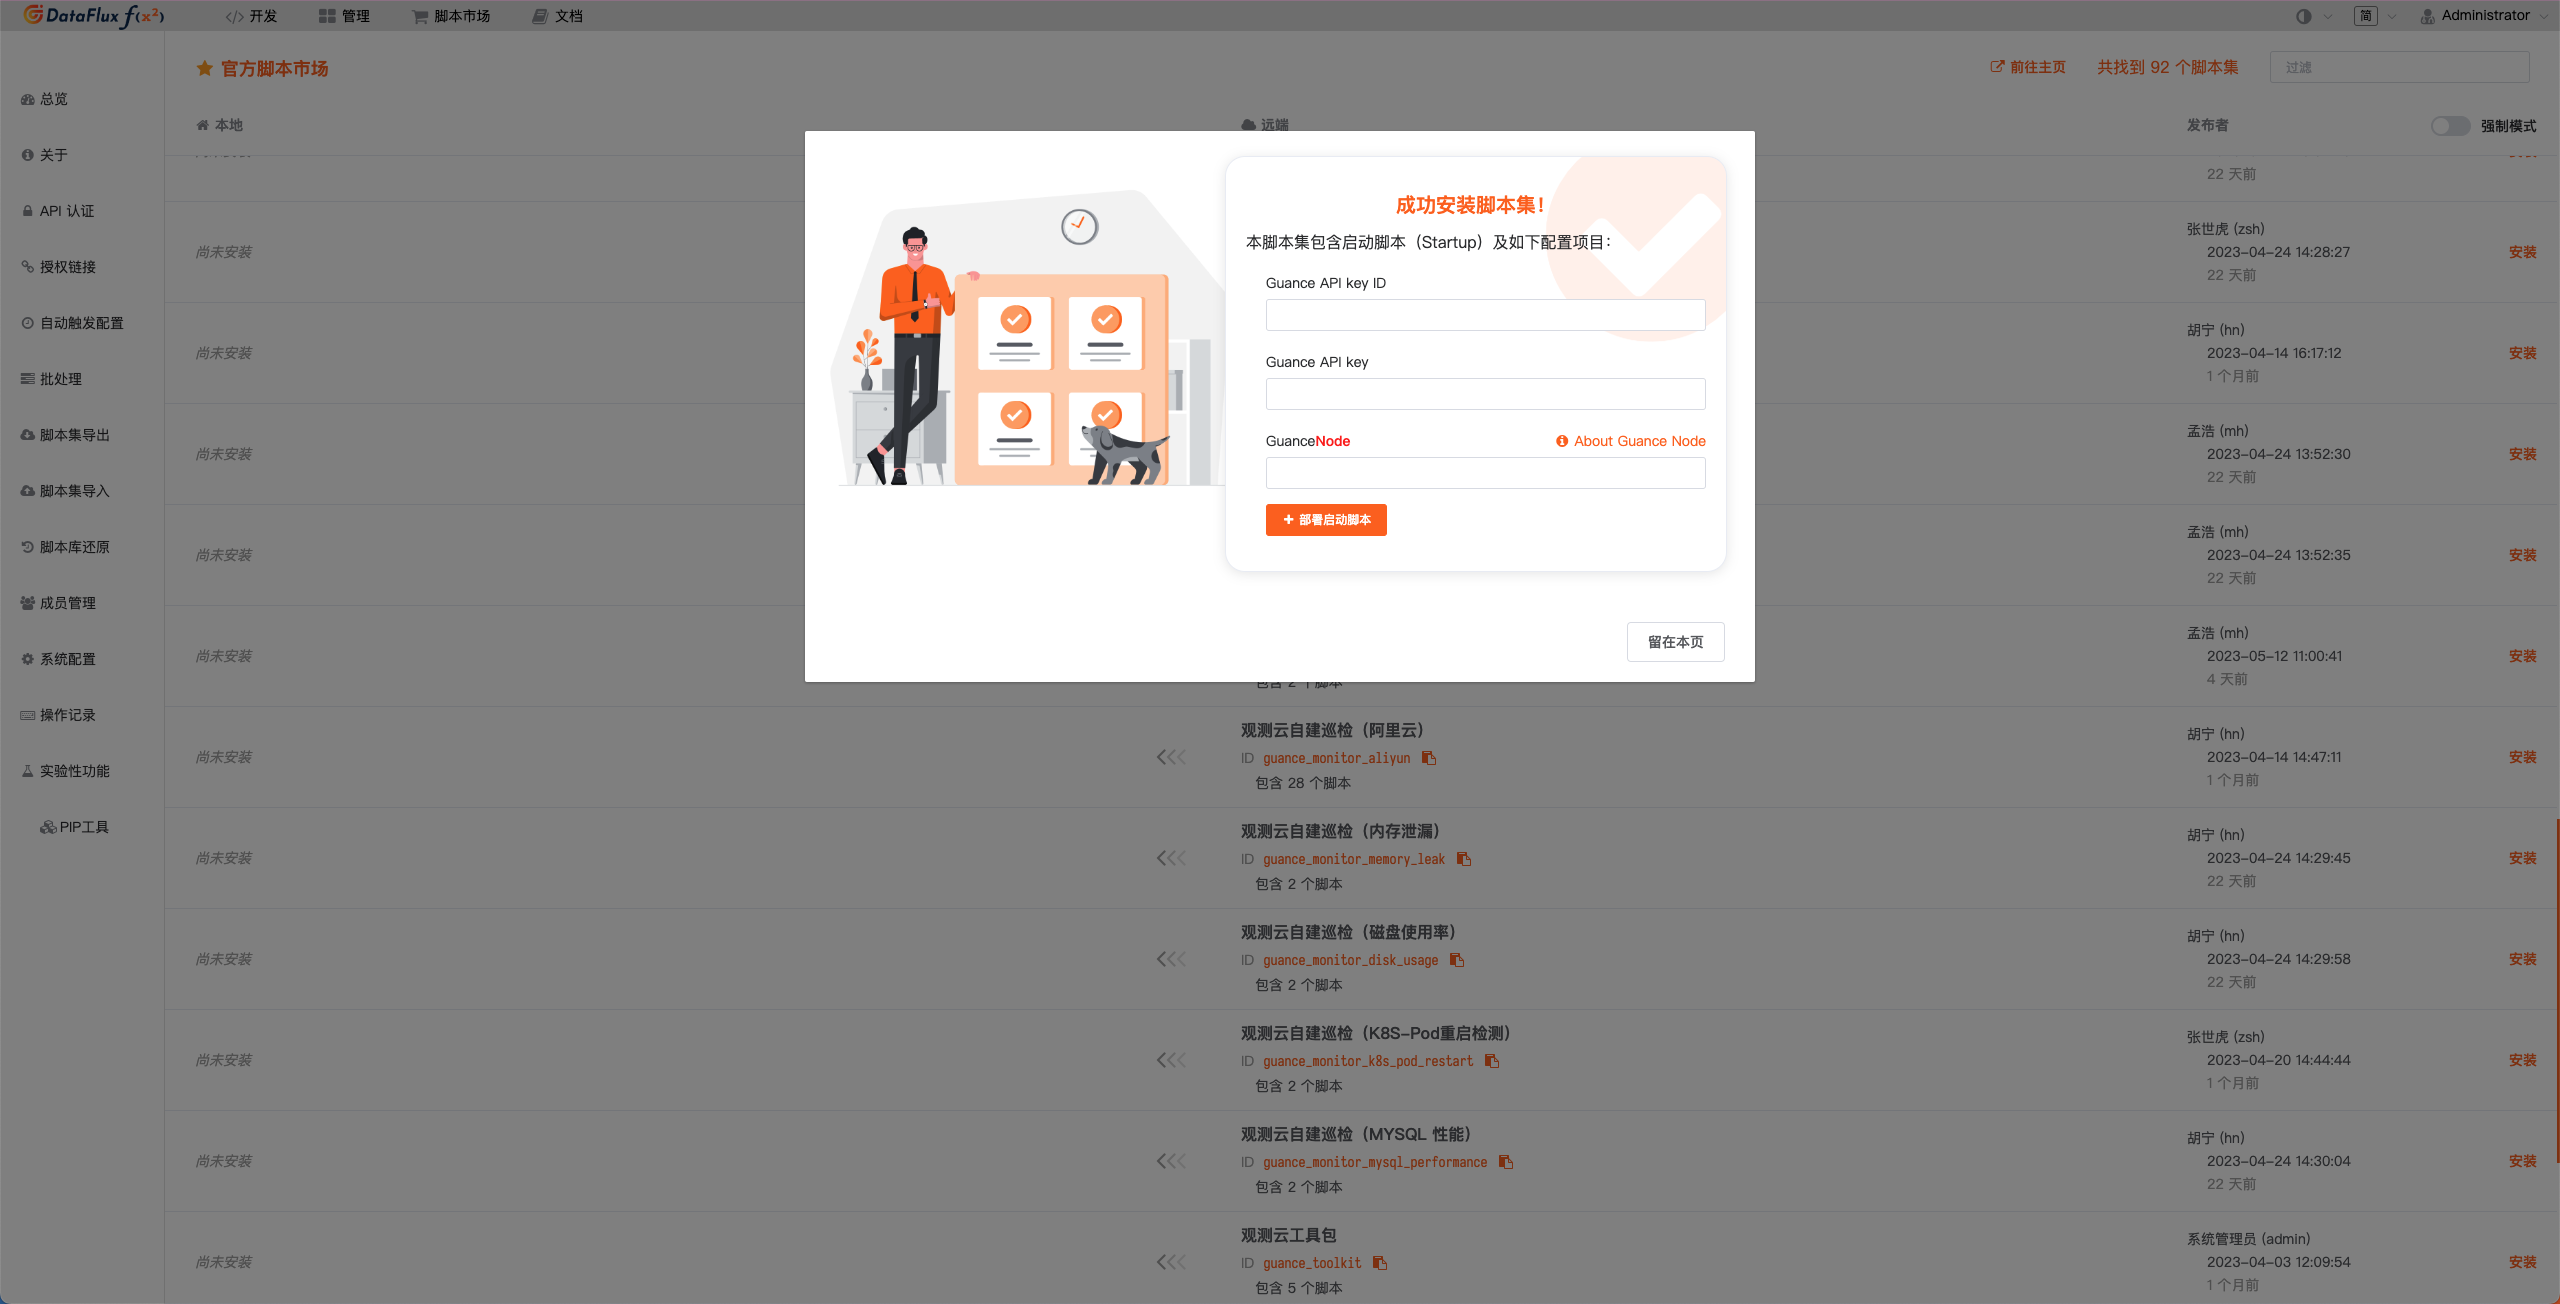
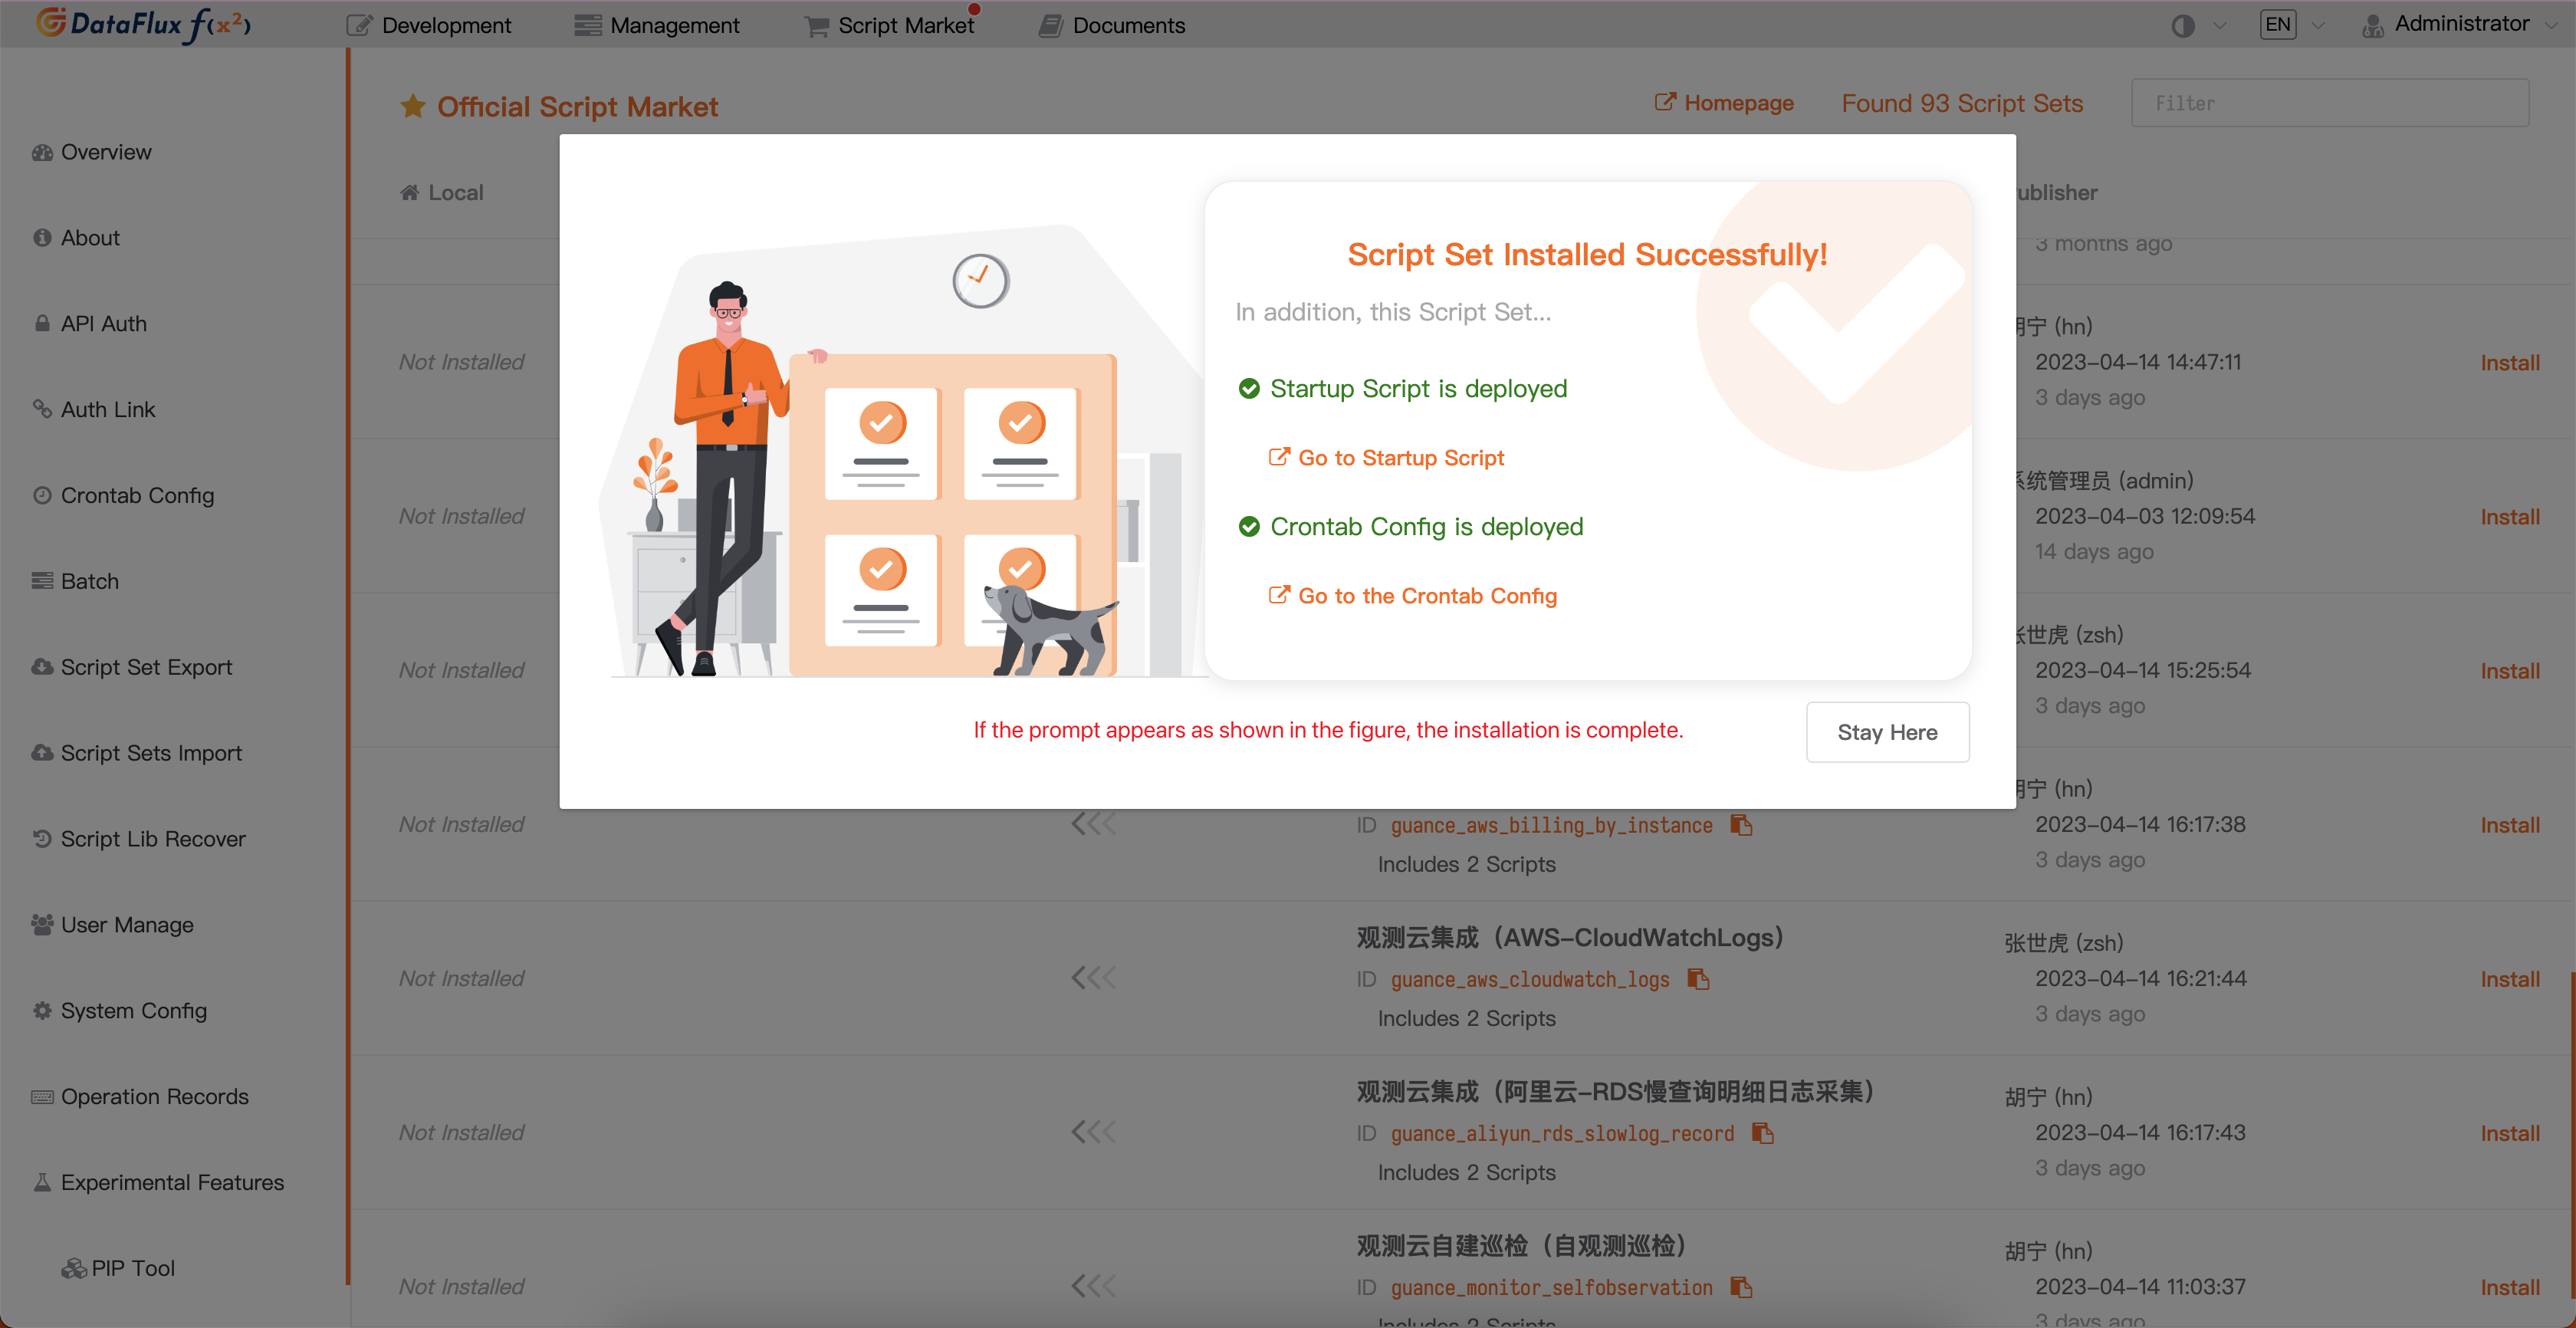
After the startup script is deployed successfully, it will automatically create the startup script and trigger configuration. You can directly jump to view the corresponding configuration through the link.
Configuring Inspection
You can configure the desired filtering conditions for inspection in the Intelligent Inspection module of Guance Studio or in the automatically created startup script of DataFlux Func. Refer to the two configuration methods below.
Configuring Inspection in Guance
Enable/Disable
RUM performance inspection is by default in the "Enabled" state and can be manually "Disabled." Once enabled, it will inspect the configured RUM performance inspection list.
Edit
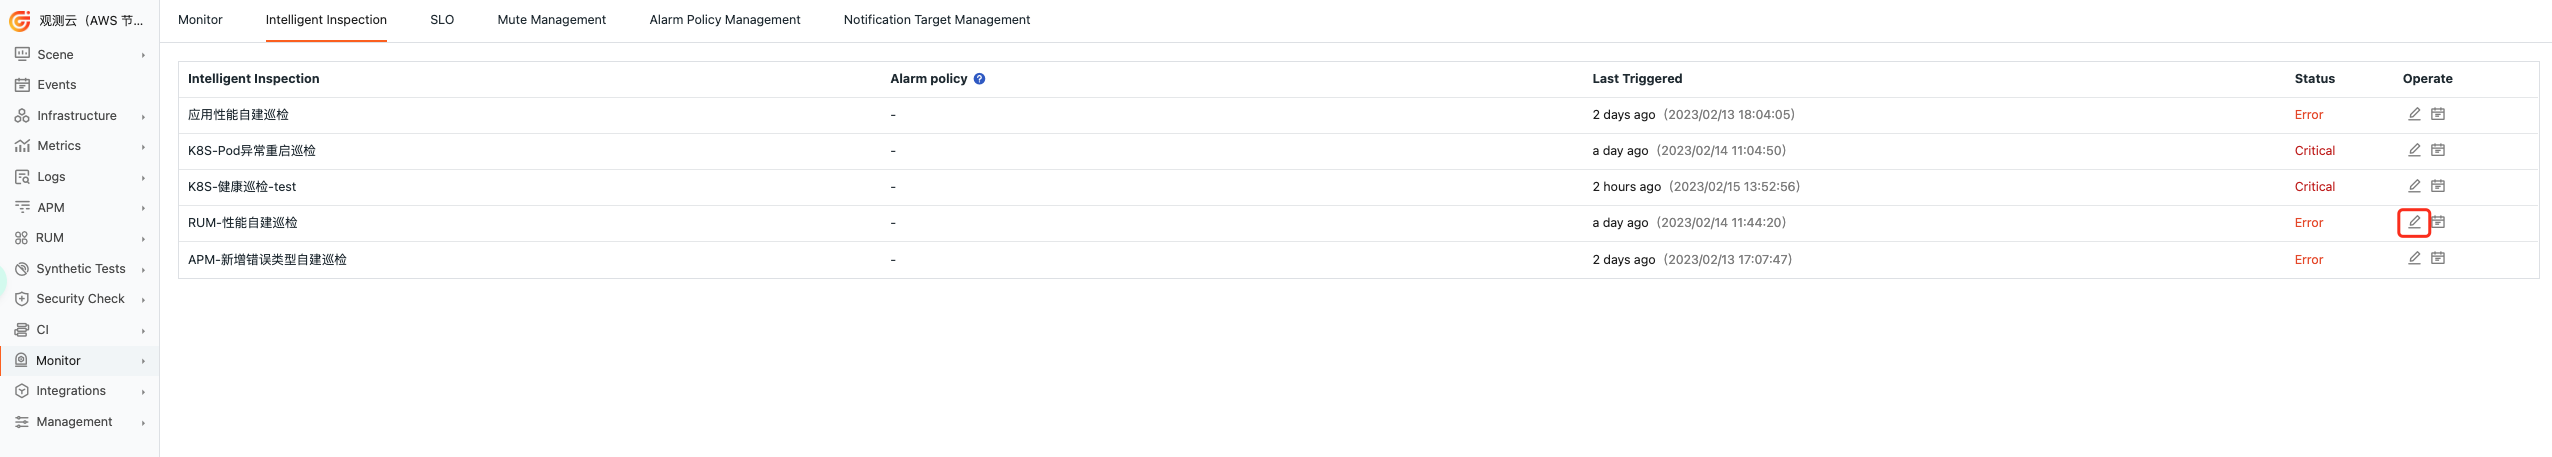
Intelligent Inspection "RUM Performance Inspection" supports users adding filter conditions manually. Under the operation menu on the right side of the intelligent inspection list, click the Edit button to edit the inspection template.
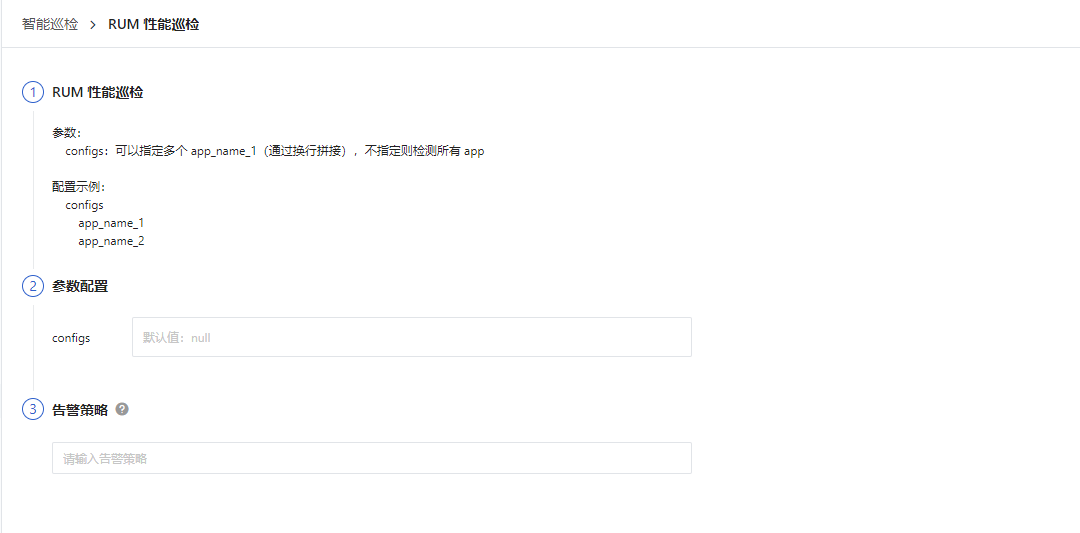
- Filter Conditions: Configure the
app_nameapplication name. - Alert Notifications: Supports selecting and editing alert strategies, including event levels that require notification, notification targets, and alert silence cycles.
To configure entry parameters, click Edit, fill in the corresponding detection object in the parameter configuration, and save to start inspection:
You can refer to the following JSON configuration for multiple application information.
Note: In your self-hosted DataFlux Func, when writing custom inspection processing functions, you can also add filter conditions (refer to example code configurations). Note that the parameters configured in Guance Studio will override those configured in the custom inspection processing function.
Configuring Inspection in DataFlux Func
In DataFlux Func, after configuring the required filtering conditions for inspection, you can test by clicking the run() method directly on the page. After publishing, the script will run normally. You can also view or change the configuration in Guance "Monitoring / Intelligent Inspection."
from guance_monitor__runner import Runner
from guance_monitor__register import self_hosted_monitor
import guance_monitor_rum_performance__main as main

# Support for using filtering functions to filter the objects being inspected, for example:
def filter_appid(data):
    appid = data[0]
    '''
    Filter app_name, define conditions for app_names that meet requirements, return True for matches, False otherwise
    return True|False
    '''
    if app_names in ['app_xxxxxxxxxxx']:
        return True


@self_hosted_monitor(account['api_key_id'], account['api_key'])
@DFF.API('RUM Performance Inspection', fixed_crontab='*/15 * * * *', timeout=900)
def run(configs=None):
    """
    Parameters:
        configs: Multiple app_name_1 (separated by line breaks) can be specified, no specification means detecting all apps.

    Configuration Example:
        configs
            app_name_1
            app_name_2
    """
    checkers = [
        main.RumPerformanceCheck(configs=configs, filters=[filter_appid]), # Support for user-configured multiple filtering functions executed sequentially.
    ]

    Runner(checkers, debug=False).run()
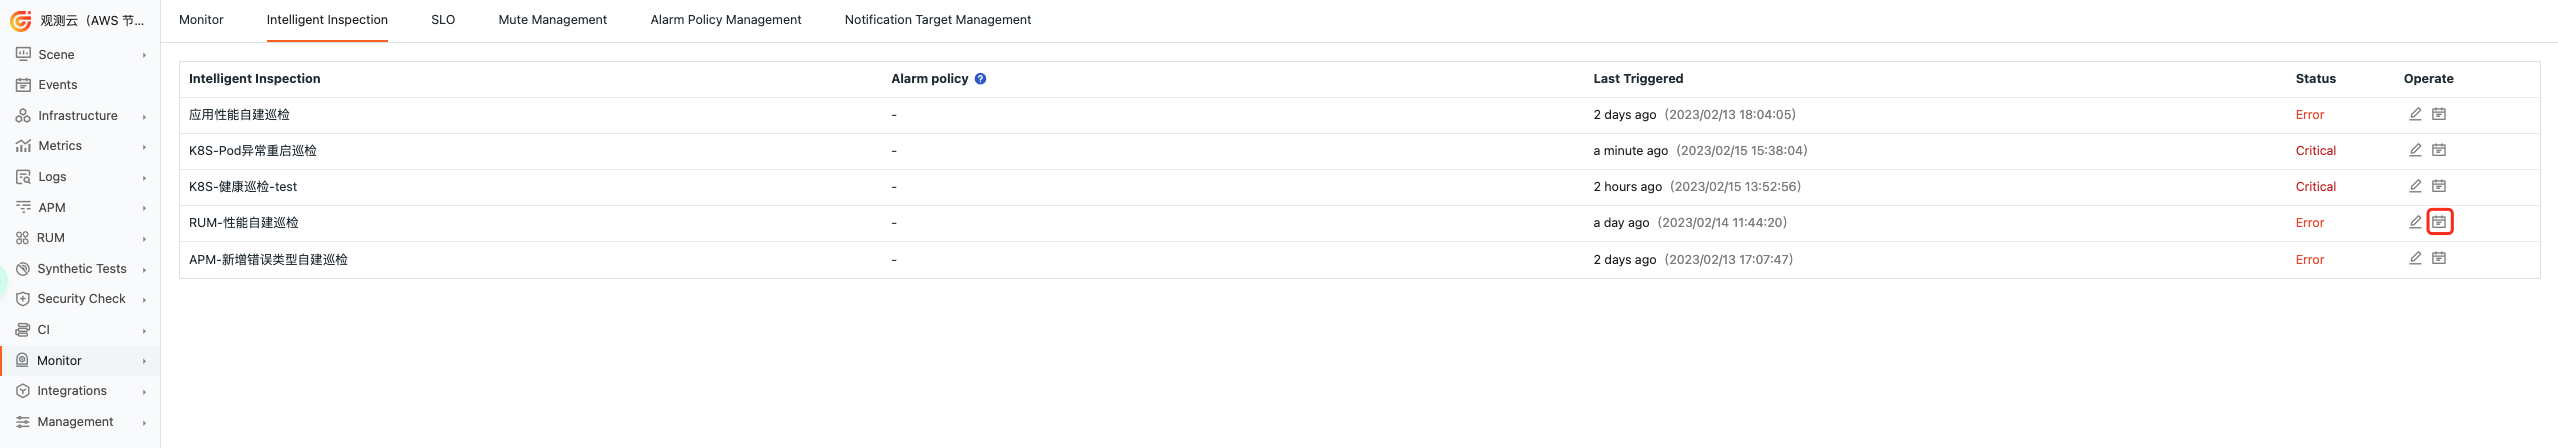
Viewing Events
Guance will perform inspections based on the current RUM performance status. When it detects anomalies in RUM performance metrics, the intelligent inspection will generate corresponding events. Under the operation menu on the right side of the intelligent inspection list, click the View Related Events button to view the corresponding abnormal events.
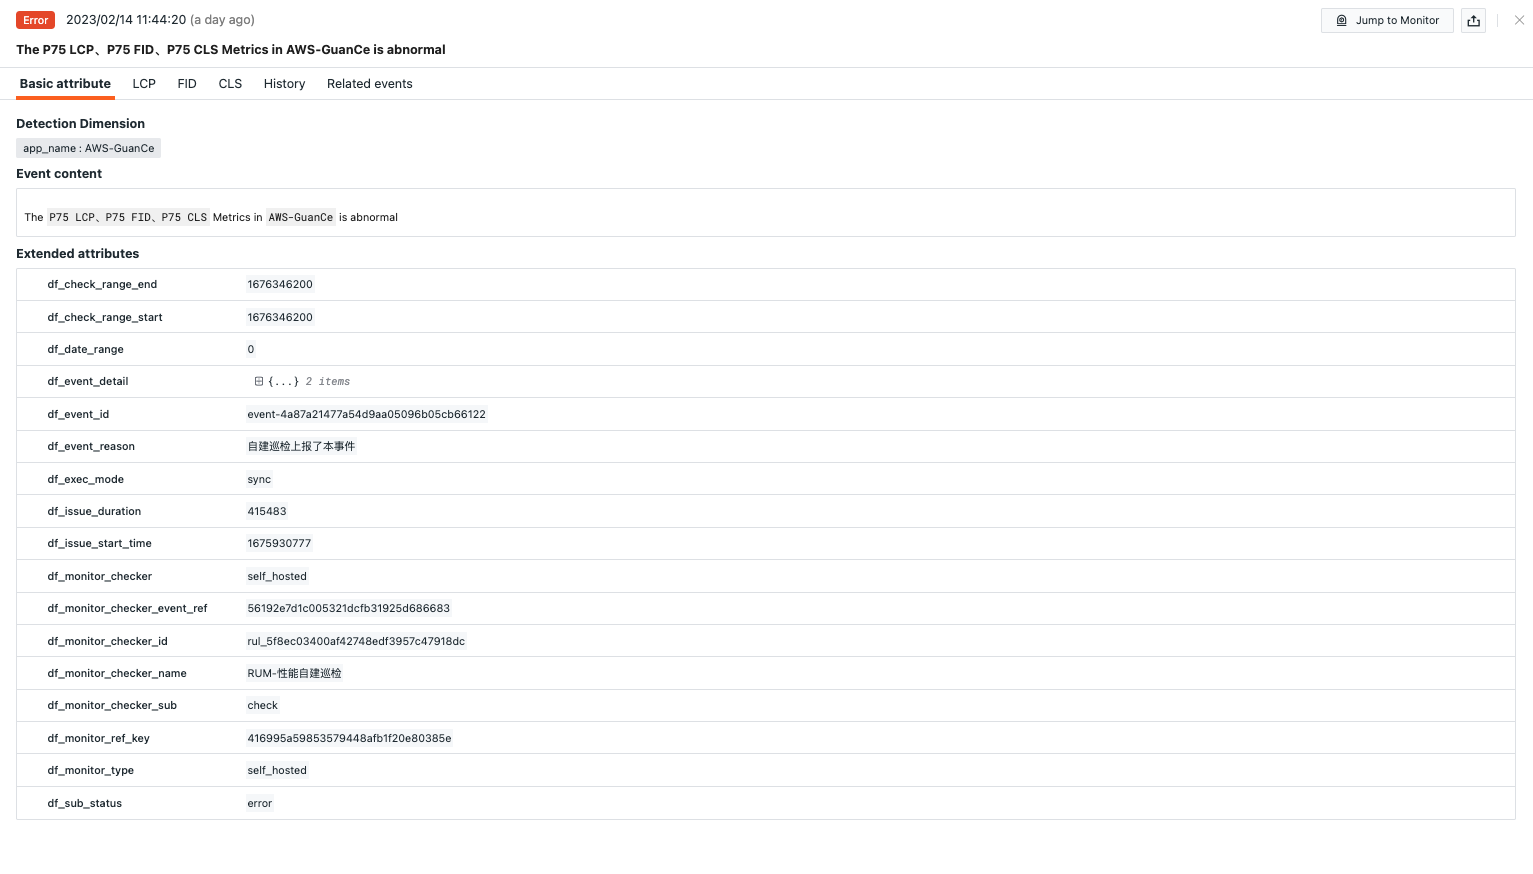
Event Details Page
Clicking Event, you can view the details page of the intelligent inspection event, including event status, the time of anomaly occurrence, anomaly name, basic attributes, event details, alert notifications, historical records, and related events.
- Click the small icon labeled "View Monitor Configuration" in the upper-right corner of the details page to view and edit the current intelligent inspection configuration details.
Basic Attributes
- Detection Dimensions: Based on the filtering conditions configured in the intelligent inspection, supports copying the detection dimension
key/value, adding to filters, and viewing related logs, containers, processes, security checks, traces, user analysis, synthetic tests, and CI data. - Extended Attributes: After selecting extended attributes, supports copying in
key/valueformat, forward/reverse filtering.
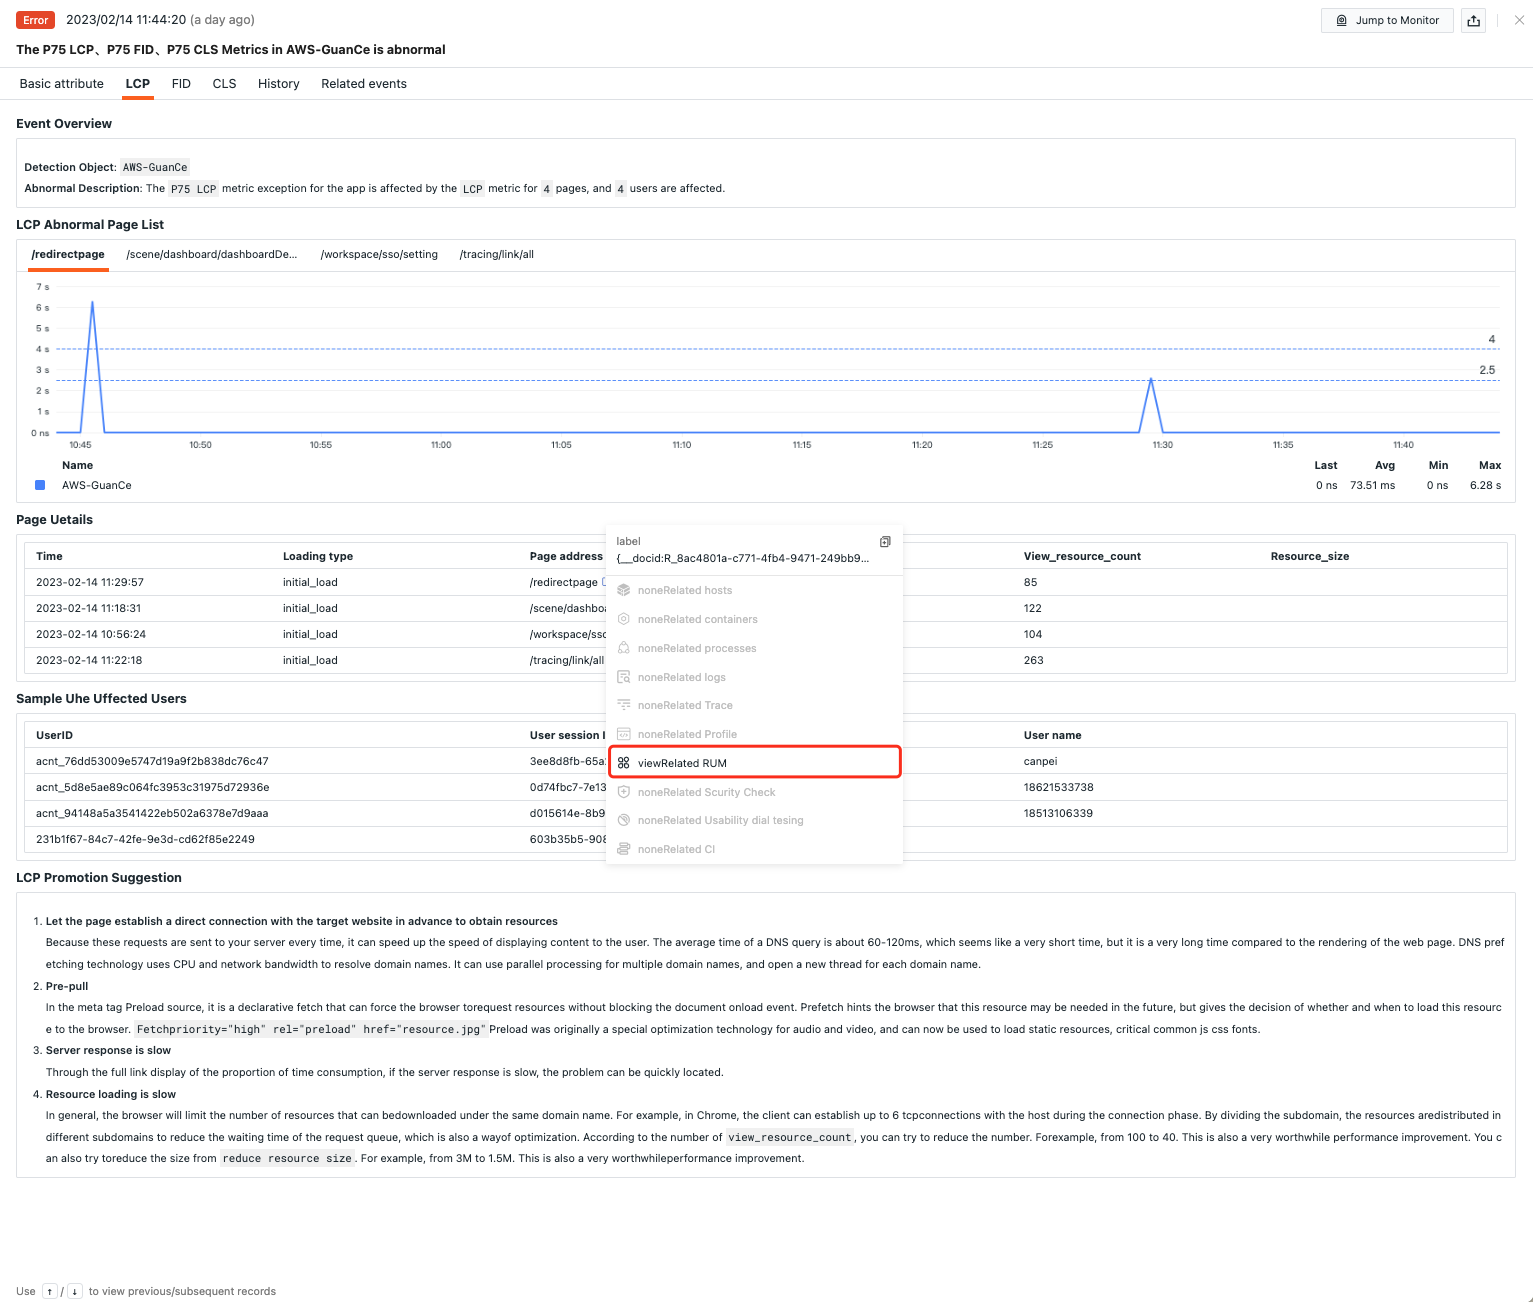
Event Details
RUM performance inspection will detect three core performance indicators: LCP, FID, CLS. When one of these indicators is abnormal, it will generate a corresponding event report based on the abnormal indicator.
- Event Overview: Describes the object and content of the abnormal inspection event.
- Abnormal Page List: View the LCP, FID, CLS metric details for the corresponding pages.
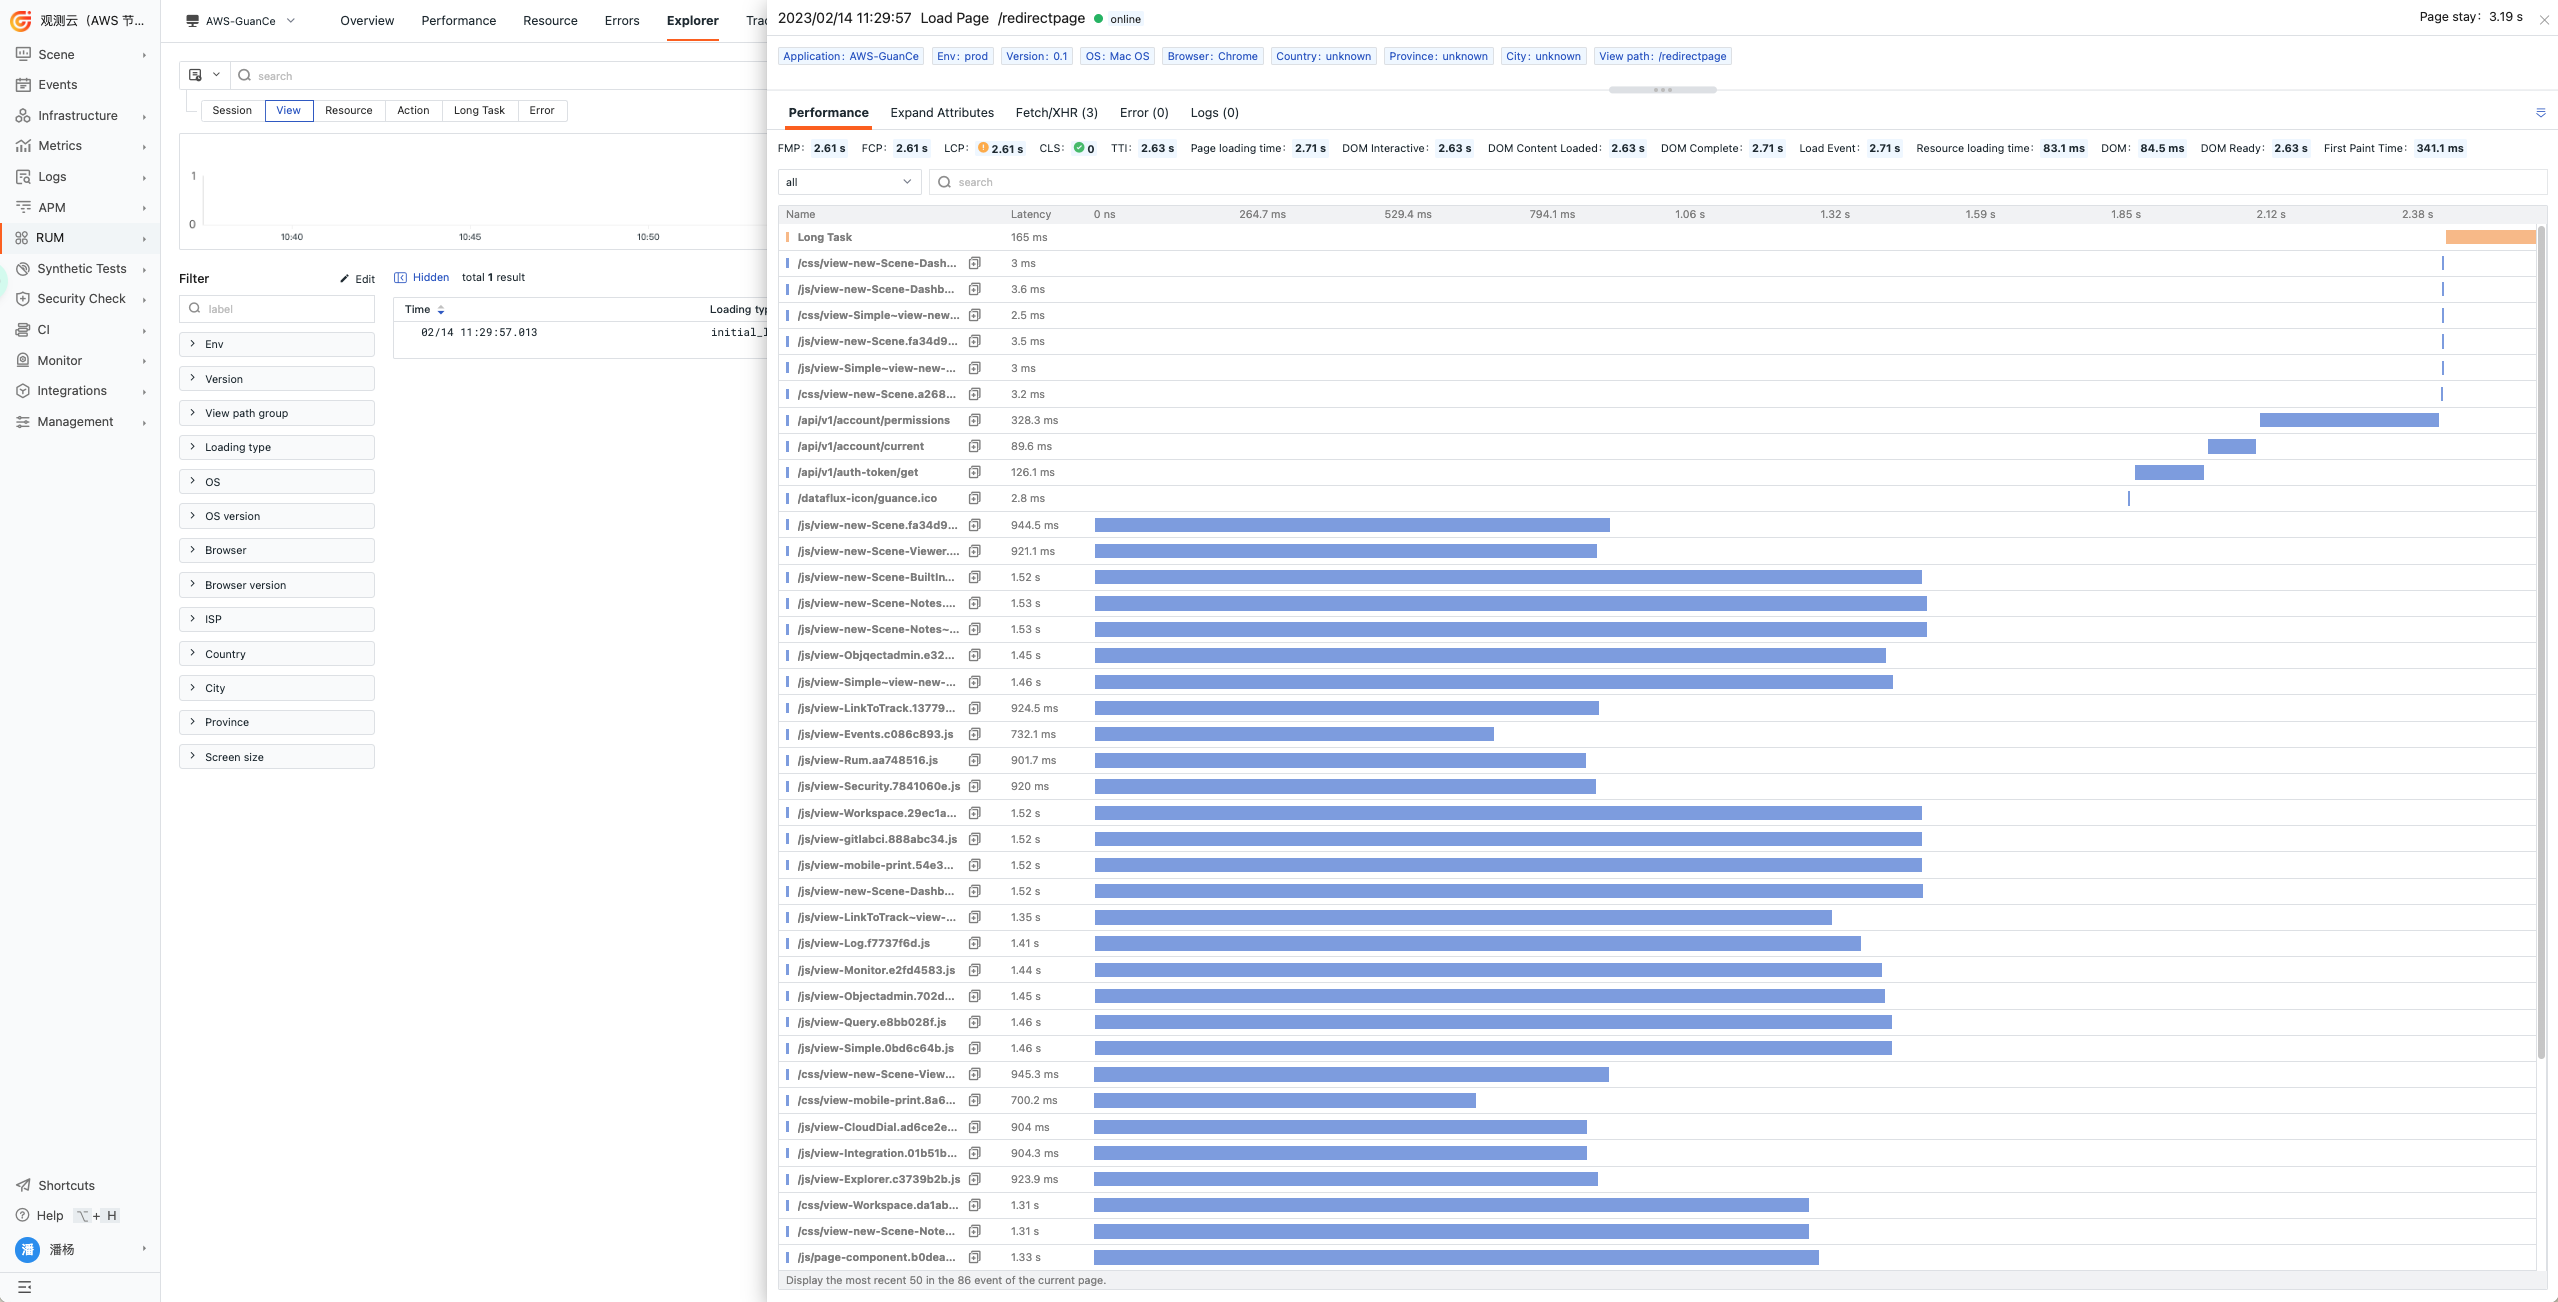
- Page Details: Includes the abnormal time, page address, and abnormal value of the metric corresponding to the abnormal indicator. You can click the page address to jump to the corresponding front-end page for further analysis of the anomaly.
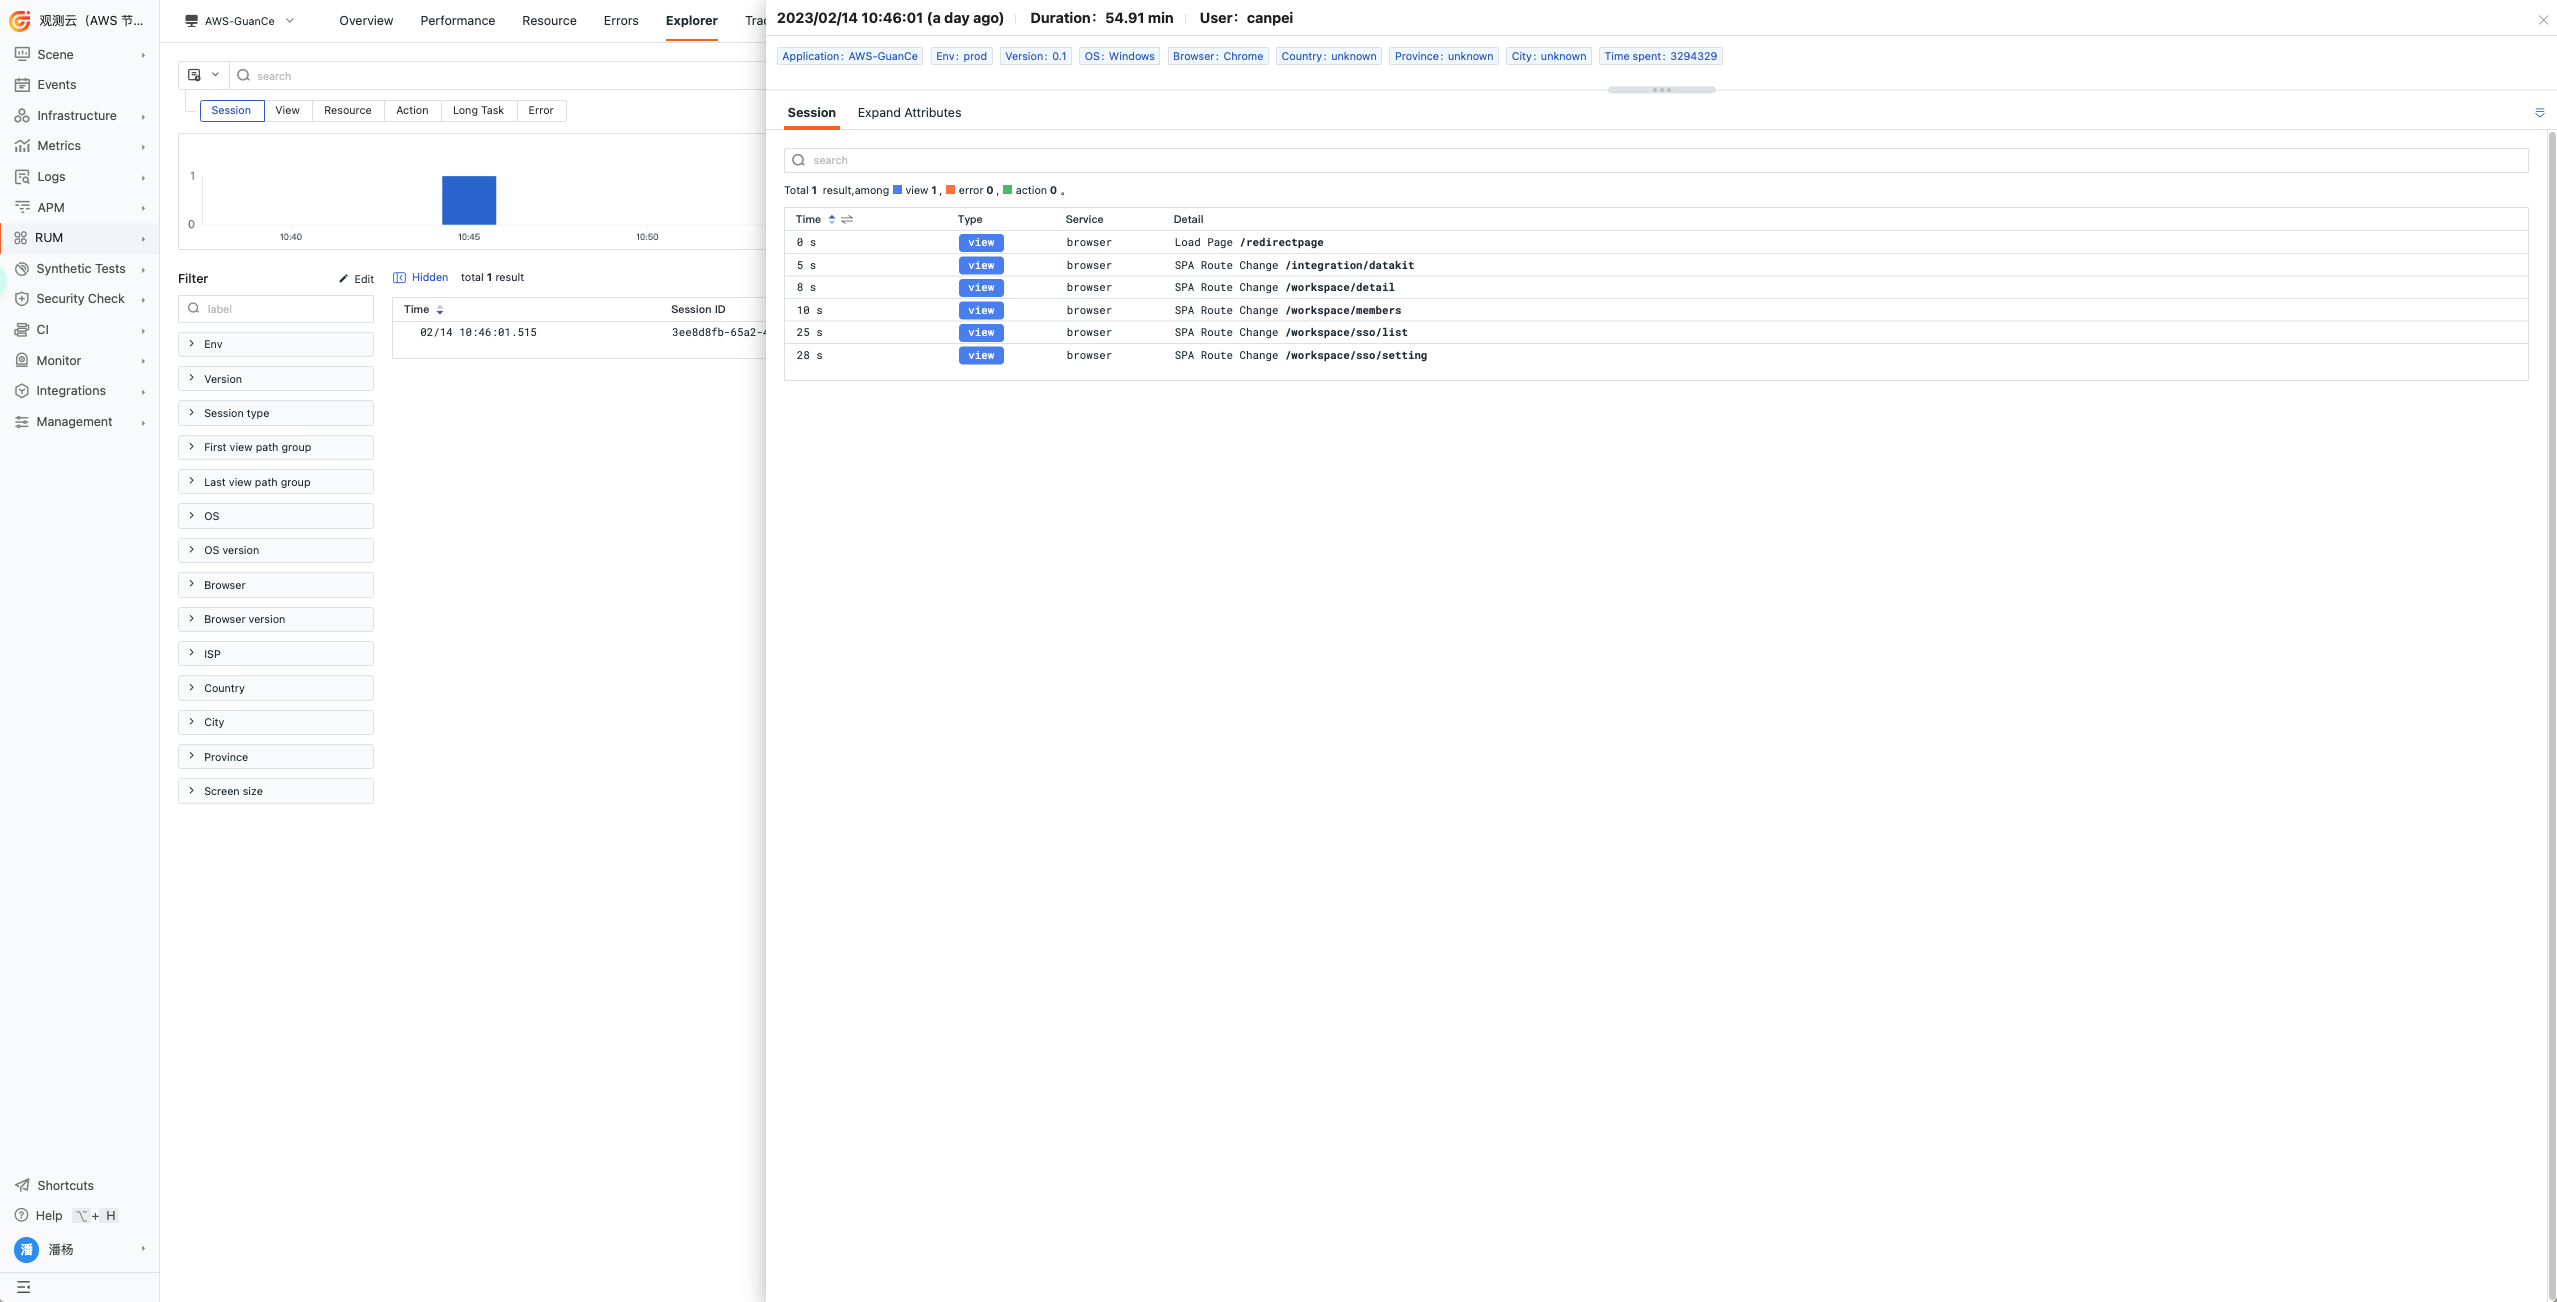
- Affected User Sampling: View information about the user IDs, session IDs, and usernames affected by the current abnormal page. You can jump to the corresponding session via the session ID to see the impact on the user.
- Improvement Suggestions: Provide optimization improvement suggestions for the current abnormal indicator.
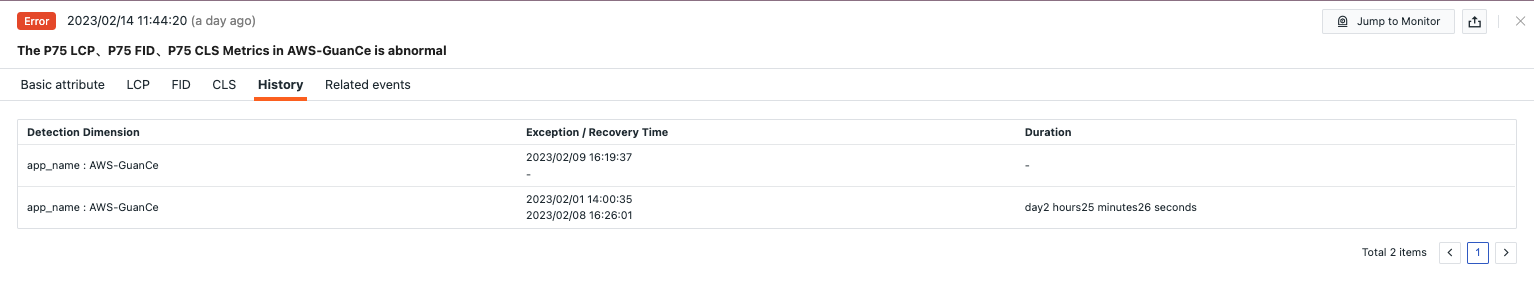
Historical Records
Supports viewing the detection object, abnormal/recovery times, and duration.
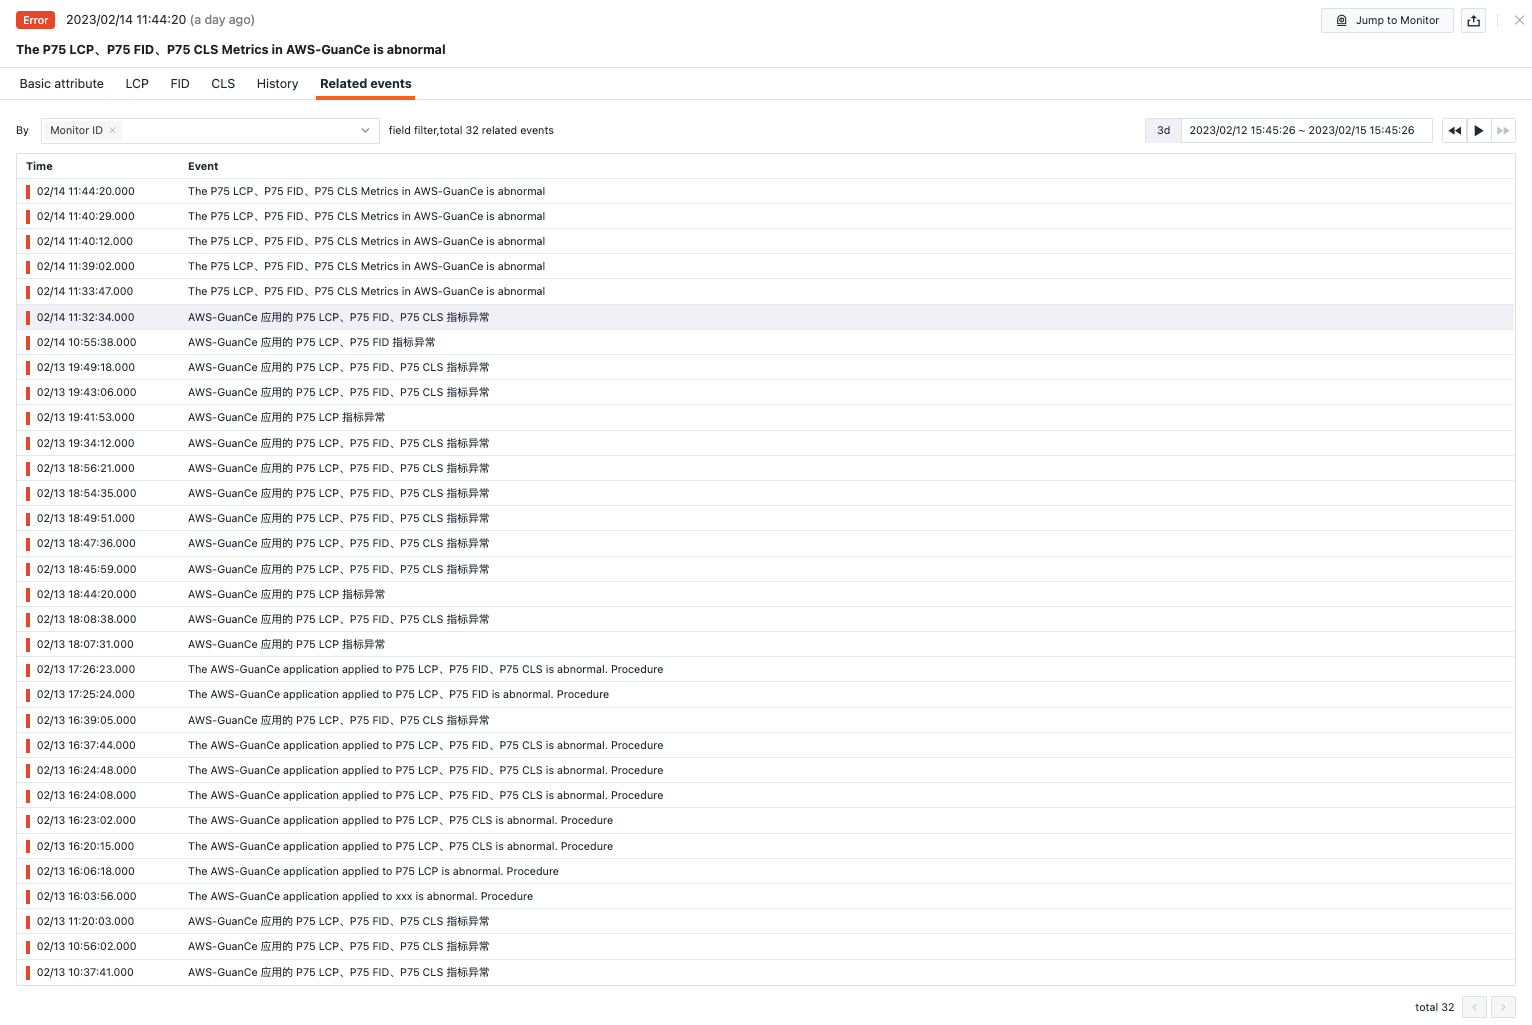
Related Events
Supports viewing related events through filtered fields and selected time component information.
Common Issues
1. How to configure the detection frequency for RUM performance inspections
- In your self-hosted DataFlux Func, add
fixed_crontab='0 * * * *', timeout=900in the decorator when writing custom inspection processing functions, then configure it in "Management / Automatic Trigger Configuration."
2. Why might there be no abnormal analysis when RUM performance inspection triggers
When there is no abnormal analysis in the inspection report, please check the data collection status of the current datakit.
3. Under what circumstances will RUM performance inspection events be generated
If the configured frontend application has an LCP indicator > 2.5s, FID indicator > 100ms, or CLS indicator > 0.1, an alert event will be generated.
4. What should be done if previously normal scripts encounter errors during inspection
Update the referenced script set in the DataFlux Func Script Market. You can view the update records of the Script Market via the Change Log to facilitate immediate updates of the script.
5. Why does the corresponding script set in Startup not change during script upgrade
First delete the corresponding script set, then click the Upgrade button and configure the corresponding Guance API key to complete the upgrade.
6. How to determine if the inspection is effective after enabling it
In "Management / Automatic Trigger Configuration," check the corresponding inspection status. First, the status should be Enabled; secondly, you can validate the inspection script by clicking Execute. If there is a message indicating successful execution within xxx minutes ago, the inspection is running normally and is effective.