Use LogBamboo
After completing Deployment, you can first use the Onboarding Guide to verify writes and queries in LogBamboo, then configure platform data forwarding as needed.
Before You Begin
Obtain the service access URL, login account, and available index names from the deployment administrator, and prepare the corresponding credentials as needed:
| Operation | Required Information |
|---|---|
| Log in to the LogBamboo page and view logs | An assigned login account and permission to view the index |
| Send a test log with the Onboarding Guide, or configure platform data forwarding | A currently valid Write Token |
| Query forwarded data on the platform | A separate Query Token, to be entered in the corresponding forwarding rule |
See Deployment Guide for how to prepare connection information. Initial onboarding verification can be completed by the deployment administrator or the person responsible for onboarding; members who only need to view logs can go directly to Query Historical Data.
Step 1: Log In and Confirm the Index
- Open the LogBamboo service URL provided by the administrator in a browser.
- Log in with the assigned account and password; the administrator responsible for deployment can use the administrator account set during deployment.
- In Log Index on the left, confirm that the target index receiving data is visible, and click the index to open the Log Query page.
Indexes are used to store data by category. If you use the example configuration in the Deployment Guide, you can first confirm the app index; during actual onboarding, use the index name provided by the administrator.
If the required index is not visible, contact the administrator to verify the index configuration and account permissions. Adding indexes or adjusting retention policies is handled by the deployment administrator; see Confirm the Index and Prepare Connection Information.
Step 2: Verify the Service with the Onboarding Guide
After selecting the target index on the Log Query page, go to Settings > Onboarding Guide from the lower-left corner, and complete verification in the three sections on the page.
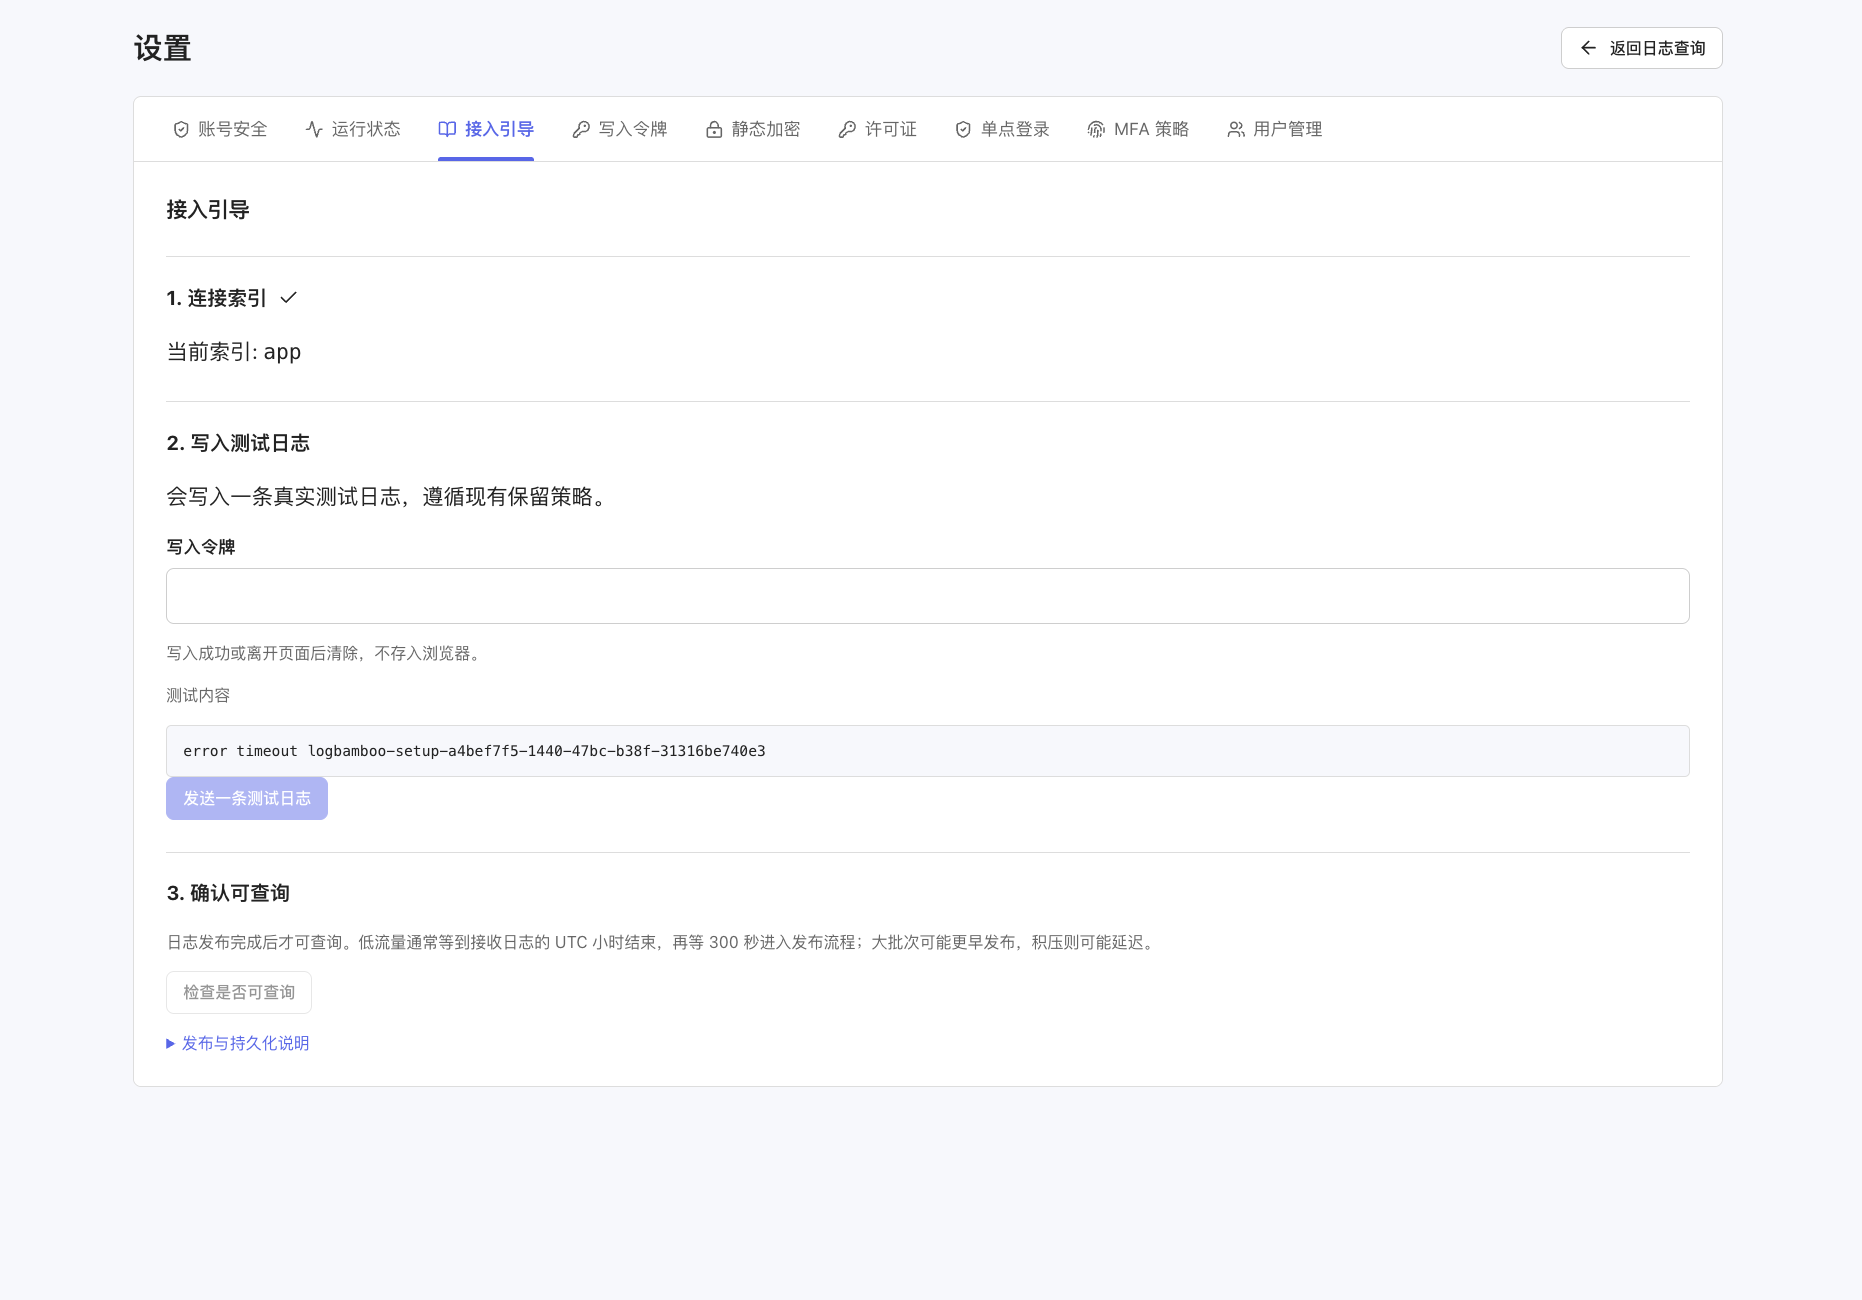
Connect the Index
In the Connect Index section, check Current Index and confirm that it matches the target for this verification. The example index in the screenshot is app.
Write a Test Log
- In Write Token, enter the currently valid Write Token provided by the administrator.
- Review the Test Content displayed on the page, and click Send a Test Log.
- Confirm the write result according to the page prompt, and record the send time and test content for later verification.
This operation actually writes a test log to the current index and stores it according to the existing retention policy. After a successful write or when you leave the page, the token input is cleared; to test again, re-enter it as required by the page.
Confirm Queryability
- After a successful write, in the Confirm Queryability section, click Check Queryability.
- If the page indicates that the data is not yet queryable, wait for processing to complete and check again; there is no need to resend the test log.
- Once the data is confirmed to be queryable, click Back to Log Query in the upper-right corner, and use the query steps in this article to search for and verify the test content.
There is a certain processing time between successful log ingestion and queryability. For details, see When Data Becomes Queryable. While waiting, you can also expand Publication and Persistence Notes on the page to view the guidance.
The test in the Onboarding Guide verifies writes and queries for the LogBamboo service. If you need to use platform forwarding, you must also complete the next step and verify the business records sent through the forwarding rule.
Step 3: Configure Platform Data Forwarding
If you need to forward data through the platform, complete the following configuration:
- On the platform, go to Management > Data Forwarding > Forwarding Rules, and create a forwarding rule.
- Set the rule name and filter conditions, and select LogBamboo as the destination.
- Enter the service URL, target index, and Write Token provided by the administrator. If you need to query data back on the platform, also enter a separate Query Token and set data view permissions.
- After testing the connection, save and enable the rule so that matching data enters the forwarding process.
For complete field descriptions and procedures, see Data Forwarding to LogBamboo.
After onboarding, select a business record that is forwarded by this rule and contains a clear keyword, so you can later verify the ingestion and query results.
Step 4: Confirm Write and Publication Status
Administrators can click View Runtime Status on the Log Query page, or go to Settings > Runtime Status from the lower-left corner. First check the node, index, and time zone displayed on the page, then check the data status in the corresponding scope. If the current account does not have the relevant permissions, contact the administrator for assistance.
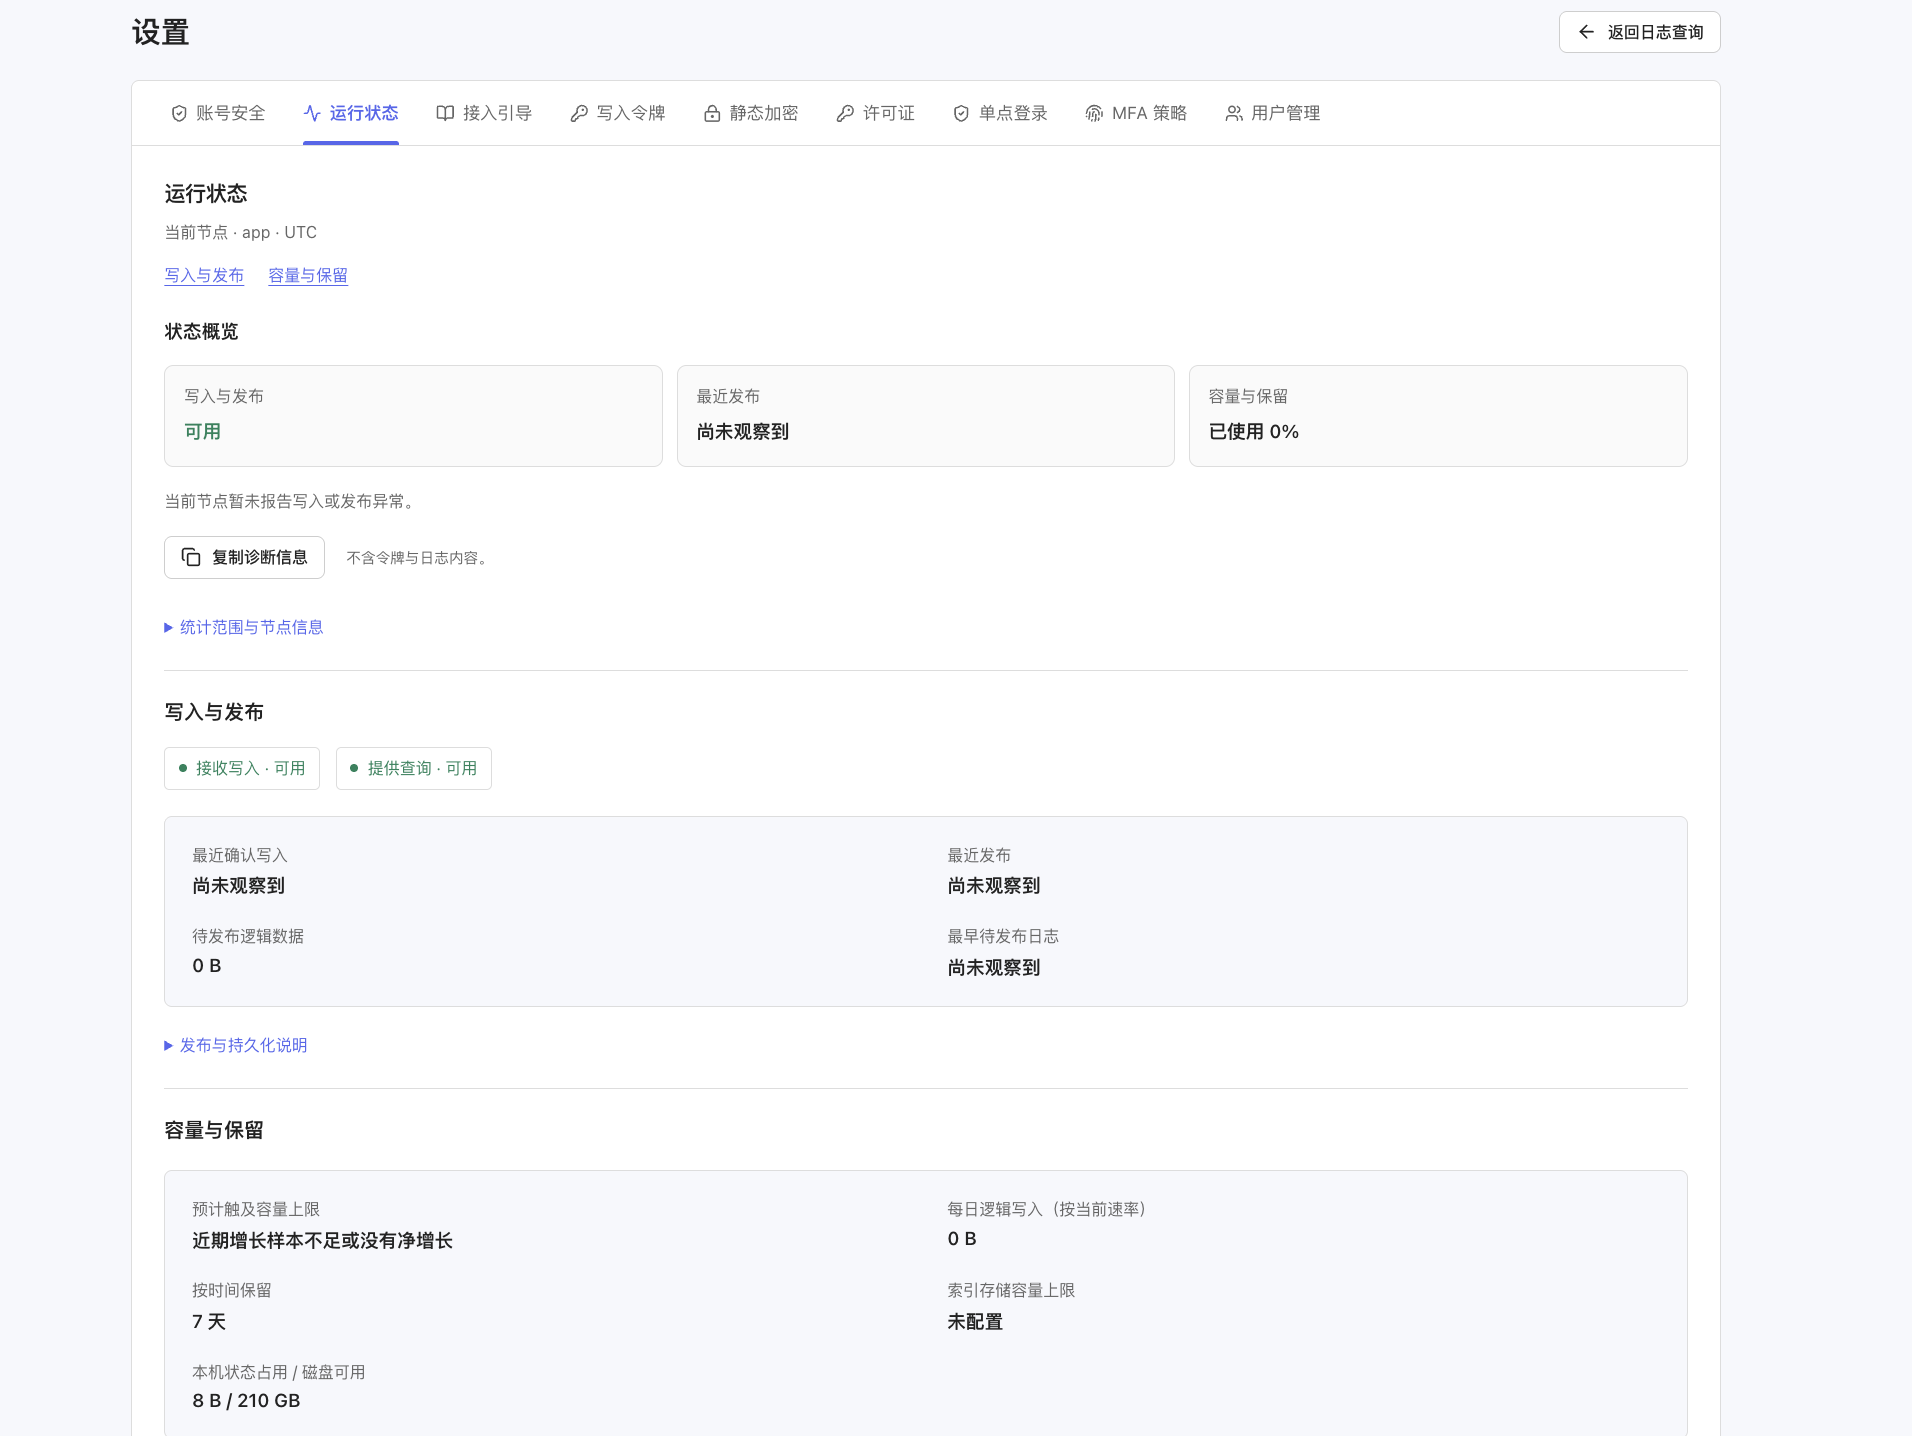
The statuses and values in the figure are page examples; refer to the current node, index, and the statistical scope indicated on the page.
Check Writes and Publication
First review the available statuses in Writes and Publication, then use the following information to confirm actual data processing:
| Page Information | What to Check |
|---|---|
| Last Confirmed Write | Check whether new data writes have been observed |
| Last Publication | Check whether new data publications have been observed |
| Logical Data Pending Publication | Check the amount of data still waiting for processing and publication |
| Earliest Log Pending Publication | Use the ingestion time to determine how long the data has been waiting |
If Not Yet Observed is displayed, first confirm whether data has been sent to the current index, and verify the node and index currently being viewed. There is a certain processing time between successful data ingestion and queryability; see When Data Becomes Queryable for details.
View Capacity and Retention Scope
In Capacity and Retention, view capacity changes and the index retention settings:
| Page Information | What to Check |
|---|---|
| Estimated Time to Reach Capacity Limit | Use this as a reference for recent capacity growth trends; if there are insufficient growth samples or no net growth, the page displays a corresponding message |
| Daily Logical Writes (at Current Rate) | A reference value estimated based on the current write rate |
| Time-Based Retention | Check the retention period configured for the current index |
| Index Storage Capacity Limit | Check whether a capacity retention limit is set for the current index |
| Local State Usage / Available Disk | Check the local disk status of the current node |
If Index Storage Capacity Limit displays Not Configured, no capacity retention limit is set for the index; the licensed capacity and time-based retention policy of the current deployment still apply.
Scroll down to view Write Trend for the Last Hour. Click Check Data Retention Scope and verify data retention according to the page results; expand Statistical Basis or Recent Capacity Evictions on the Current Node to view the corresponding explanations and cleanup records.
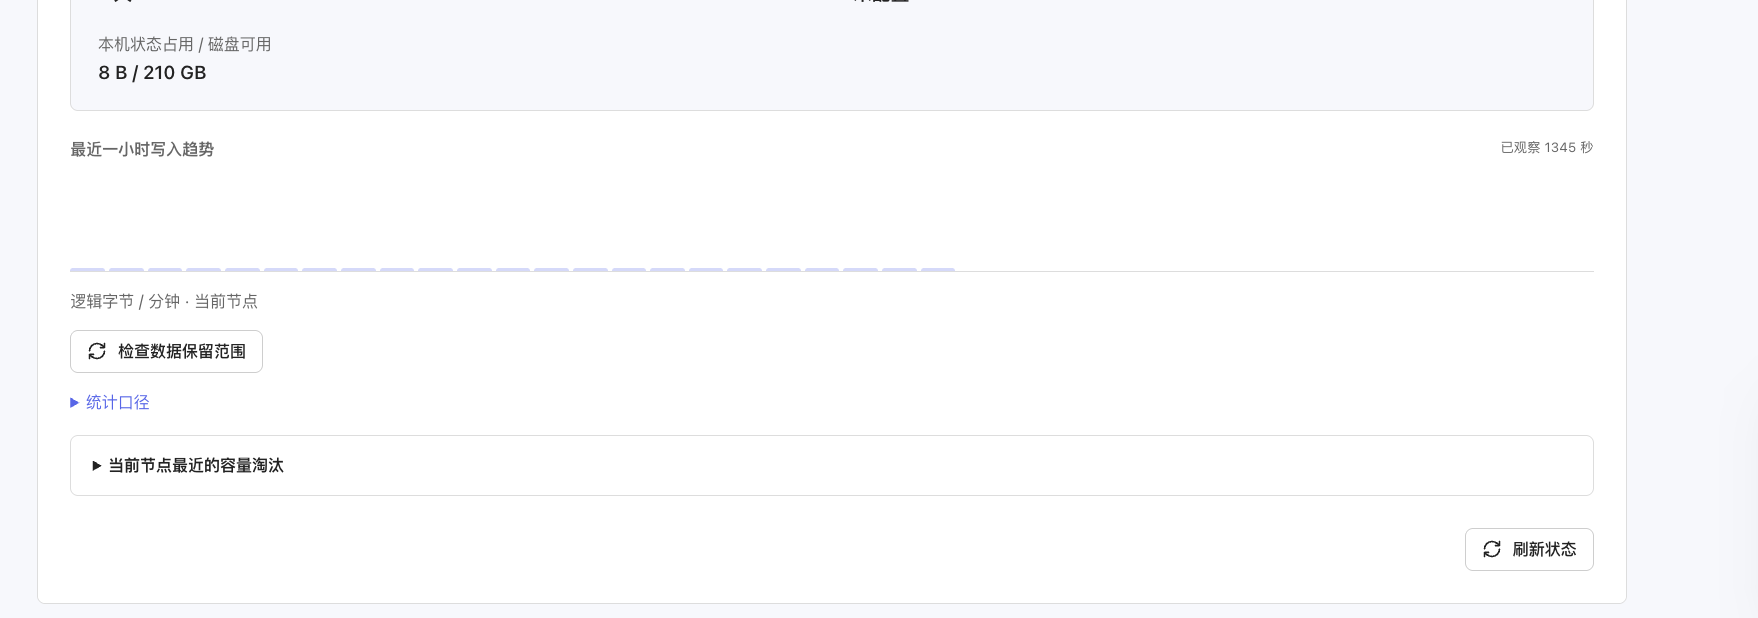
To update the page information, click Refresh Status. If you need help troubleshooting from the administrator or deployment support, click Copy Diagnostic Information and provide the information generated by the page.
Step 5: Query Historical Data
Query on the LogBamboo Page
- In Log Index on the left, select the index to query.
- First check the Time Zone, then set a query range that covers the LogBamboo ingestion time. You can select quick ranges such as Last 15 Minutes, Last 1 Hour, and Last 24 Hours, or manually set the start and end times.
- Enter a keyword such as
errorin the search box, and click Search on the right. - Check the returned log content in the results area below and confirm that it contains the expected records. If there are many results, page through them as prompted, or narrow the time range and query conditions.
The time zone in the screenshot is UTC. When entering the start and end times, make sure the time you use is consistent with the time zone selected on the page. When backfilling historical logs, query by the current ingestion time as well; the original event time of the log is still retained in the content.
The LogBamboo Log Query page provides the following query examples:
| Query | Purpose |
|---|---|
error |
Search logs by the keyword error |
timeout OR 失败 |
Search for logs matching either keyword |
connection AND reset |
Search for logs matching both keywords |
To learn more query syntax, click Query Guide at the top of the page.
To accurately count matching records, use the Exact Count toggle below the search button as needed. You can save frequently used query conditions with Save Current Query and use them later from Saved Queries; previously executed queries can be viewed in Query History.
To query on the LogBamboo page, simply log in with an account that has permission to view the index.
Query Forwarded Data on the Platform
- Go to the Data View page under Management > Data Forwarding.
- Select the corresponding forwarding rule and set the query range based on the LogBamboo ingestion time.
- Enter a keyword to query and verify the returned results.
- If the page indicates that more results are available, continue fetching the subsequent data.
Platform query-back requires entering a Query Token in the corresponding forwarding rule, and members of the current workspace must have data view permission for that rule. For details, see Verify Forwarding Results.
When verifying platform onboarding, confirm in the target index that the business record sent through the forwarding rule can be found, then verify the same record under the corresponding rule on the platform. The test log in the Onboarding Guide is used to verify the LogBamboo service itself.
Ongoing Management
Replace the Write Token
Administrators can go to Settings > Write Token. The page displays the configuration source and the latest modification information. The current Write Token cannot be viewed; to use the existing token, obtain it from the deployment administrator.
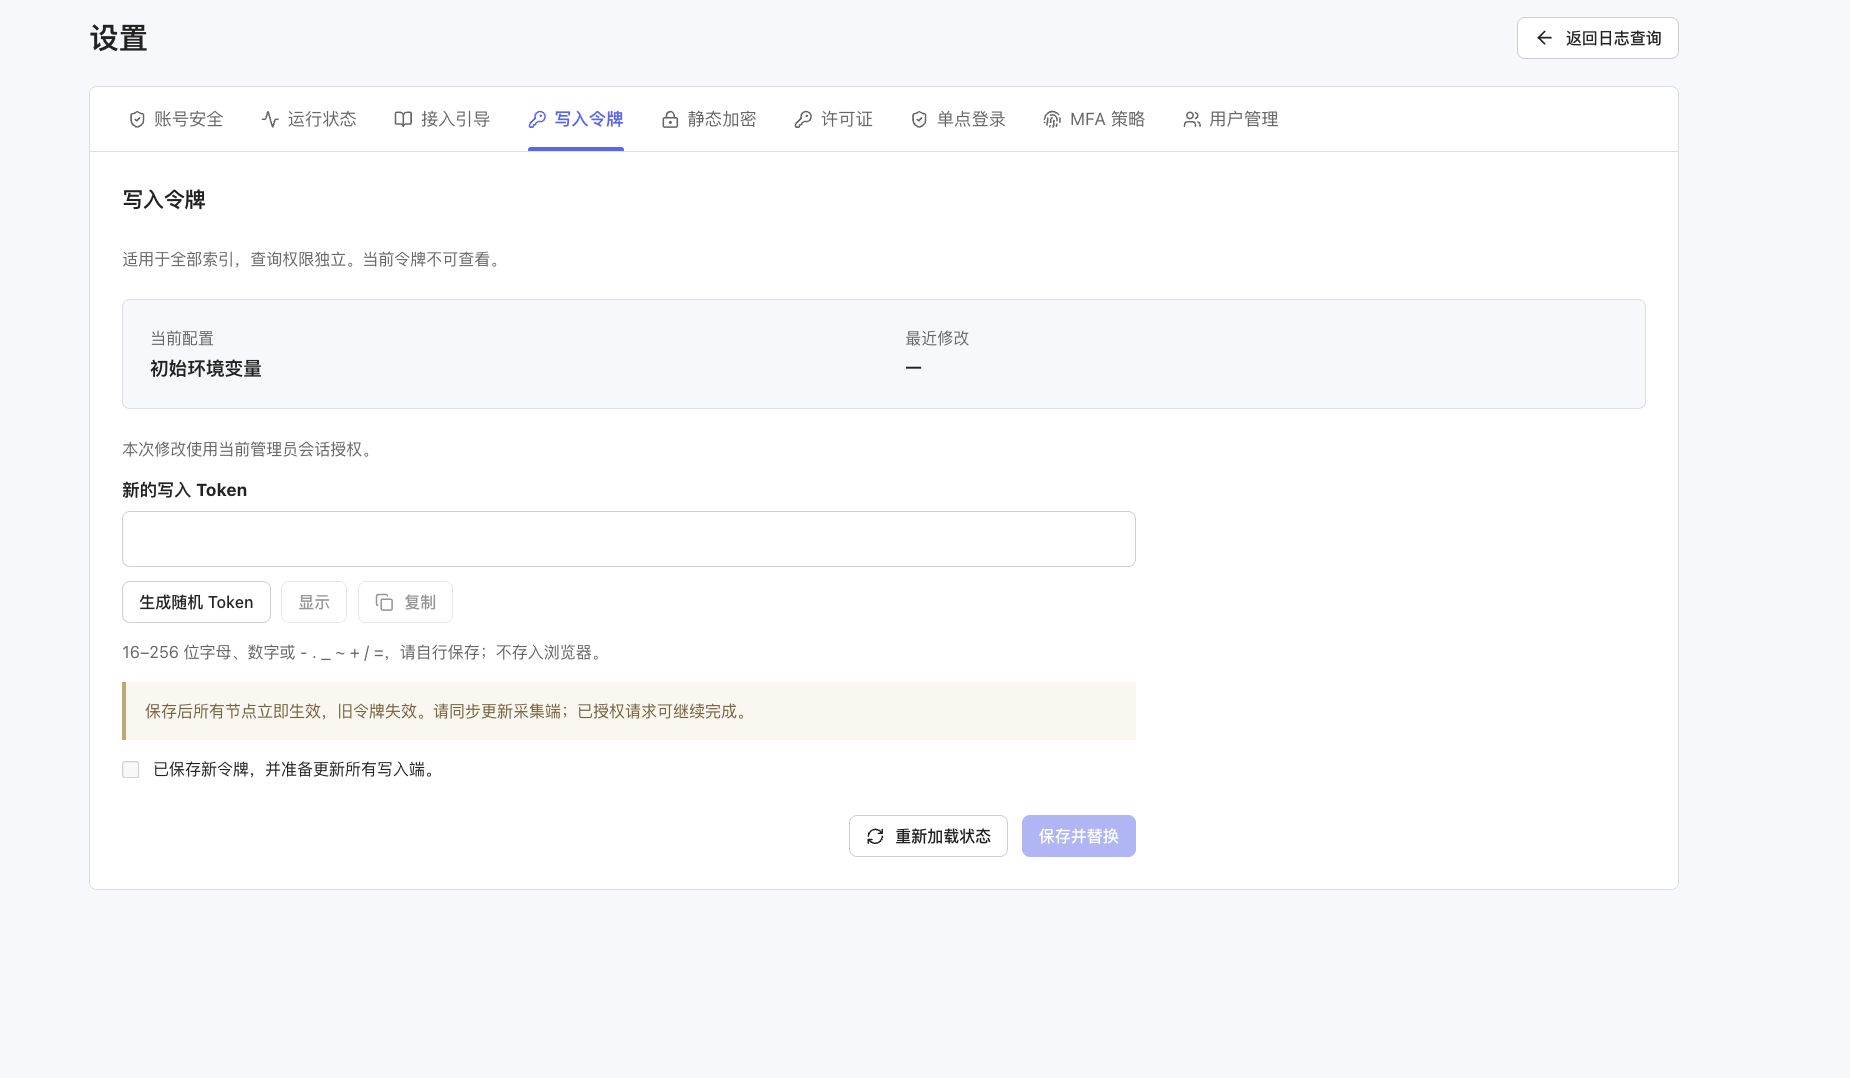
This Write Token applies to all indexes in the current deployment. To replace it, perform the following steps:
- Enter a new value that meets the page requirements in New Write Token, or click Generate Random Token.
- Use Show or Copy as needed to verify and securely save the new value.
- Confirm that you are ready to update all write endpoints that use this token, and select I have saved the new token and am ready to update all write endpoints.
- Click Save and Replace.
- Then immediately update the Write Token in the platform forwarding rules or collection agents. To check the latest configuration status, click Reload Status.
After saving, the new token takes effect immediately and the old token becomes invalid. Before replacing it, prepare updates for all related write endpoints to avoid subsequent writes being affected by credential invalidation. You must save the new value yourself; it cannot be viewed from the current token later.
This page manages the Write Token. The Query Token used for platform query-back must be prepared separately; see Prepare Connection Information for details.
Accounts and Permissions
To let other members view data, the administrator assigns accounts and sets the indexes they can access. If a member cannot see the required index, ask the administrator to verify the configuration and authorization scope.
Capacity and Licensing
Administrators can view Operating Mode, Capacity, Expiration Time, and Cluster ID in Settings > License. If you need more capacity or receive an expiration notice, contact Sales and follow Capacity and Commercial Licensing to purchase, activate, or renew.
FAQ
| Issue | Resolution |
|---|---|
| Login Failure | Ask the administrator to verify the account, password, and whether the account is available |
| Target Index Not Found | Ask the administrator to confirm that the index has been configured and taken effect, and that the current account has permission to view it |
| Onboarding Guide Indicates Data Is Not Yet Queryable | Wait for processing to complete, then click Check Queryability again; there is no need to resend the test log |
| No Data Found After Onboarding | Confirm that data has reached the target index, query by ingestion time, and wait for processing to complete; also check the time zone, keyword, and data retention scope |
| Write Failure After Replacing the Write Token | Confirm that all related forwarding rules or collection agents have been updated with the new token; the old token becomes invalid after the replacement is saved |
| Data Is Found in LogBamboo but Not on the Platform | Check the target index, Query Token, and data view permissions of the forwarding rule, and confirm that the same ingestion time range is selected |