Log Explorer
After log data is collected into the system, you can view all log data reported in the current Workspace under Logs > Explorer.
Note
If the role of the currently logged-in account has set "Only show rules related to me" in Logs > Data Access, the queried log content will be affected accordingly.
View Modes
To meet viewing and analysis needs in different scenarios, the Explorer supports multiple display modes:
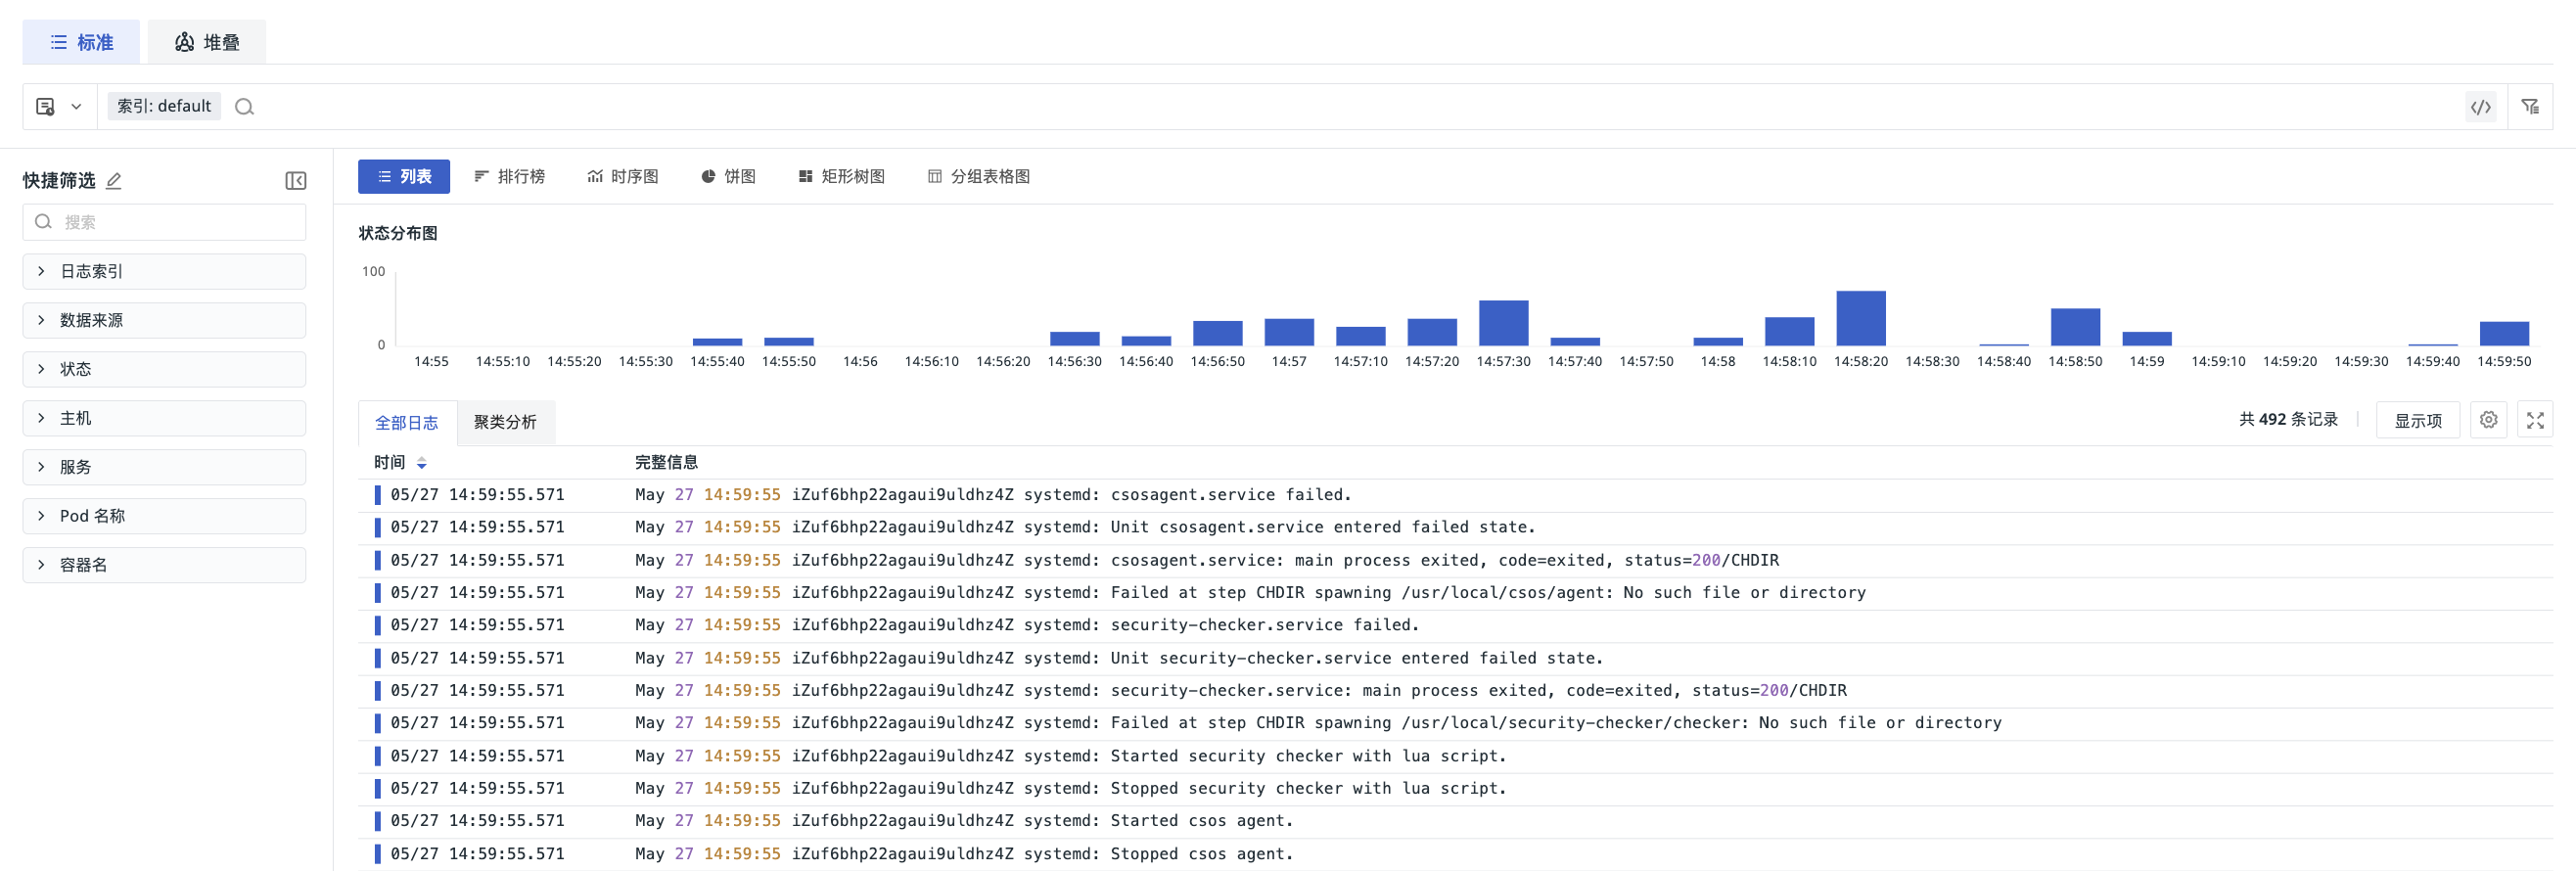
List
Each field of a log occupies a separate column, displaying all field content in full so you can directly view the detailed information of each log entry.
In text or expanded content that supports segment operations, you can click Chinese or mixed Chinese-English segments to filter, inverse filter, or copy. Plain text is separated by whitespace and common punctuation; identifiers, paths, IPs, times, URLs, and similar content are recognized according to their own rules. For details, see Selecting Log Segments.
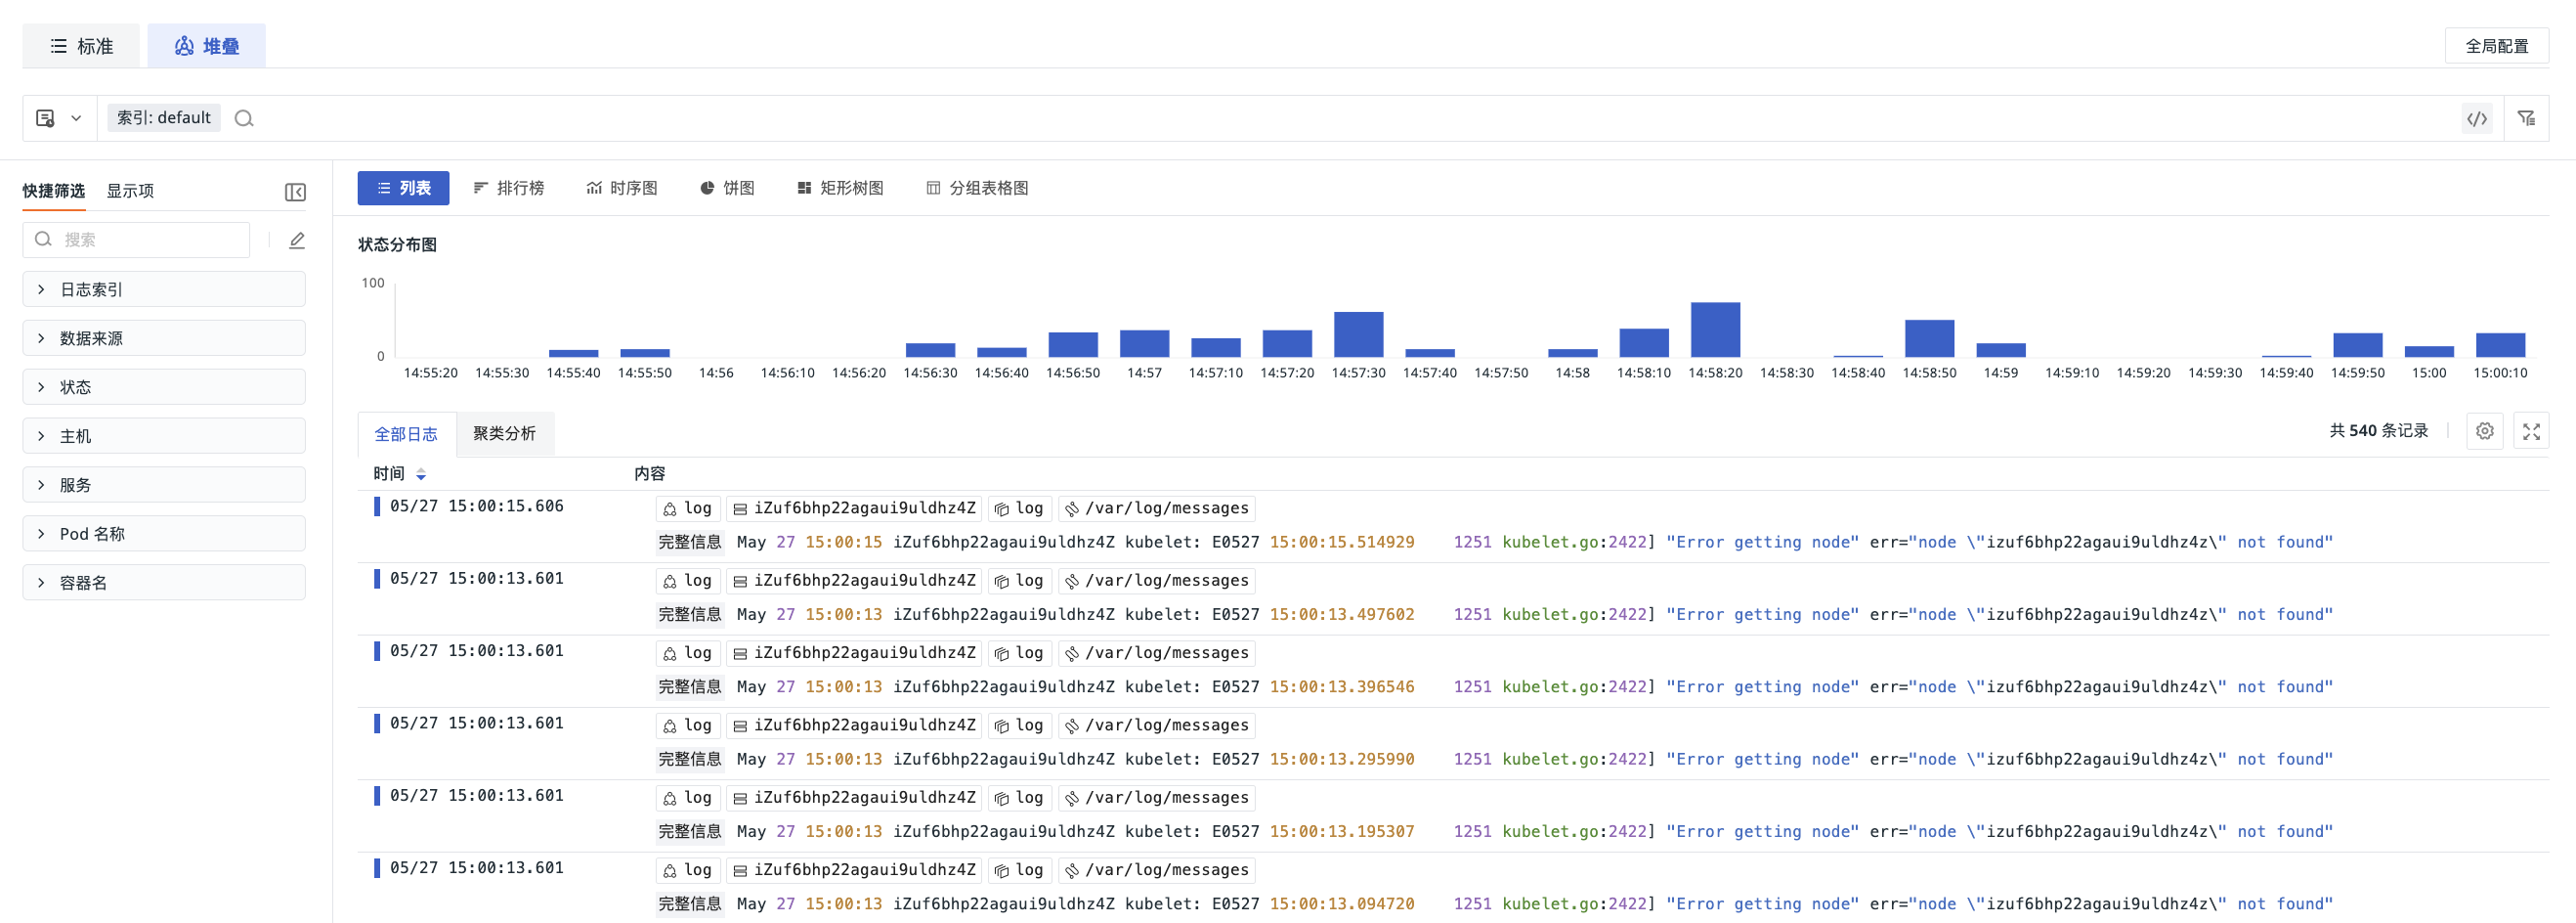
Stacked List
Except for the time field (time), all other fields are merged into a single column and displayed in multiple lines within the cell:
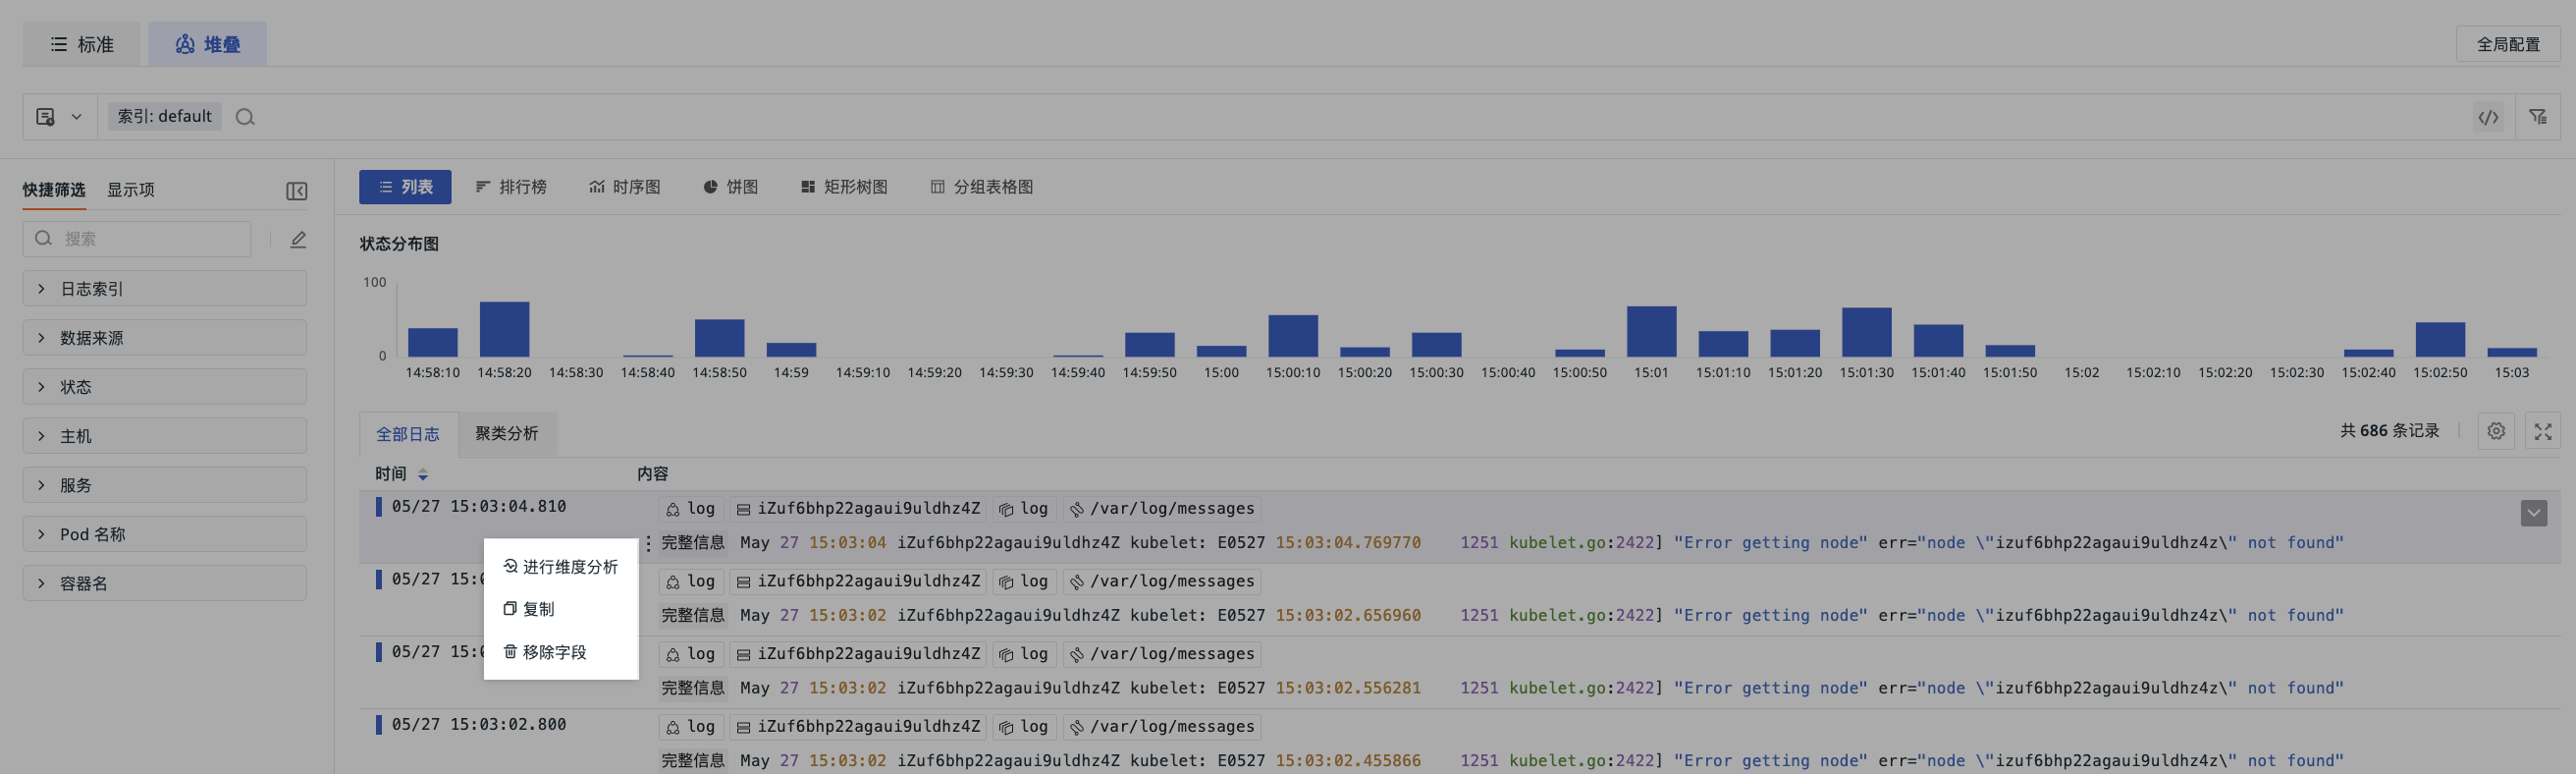
In stacked mode, you can perform the operations shown in the figure for specific fields:
In the stacked list, the Original Log and other text values that support segment operations also allow selecting Chinese and mixed Chinese-English segments for filtering or copying. The selection range may differ among hovered words in the list, JSON display, and the log detail body; always operate based on the currently selected range.
If a field contains JSON, the stacked list supports hierarchical expansion for viewing. You can configure the default expansion mode for JSON fields in Preferences, including not expanded or fully expanded, to quickly locate fields in multi-level structures.
Chart
Based on the count, last, first, and count_distinct operations, data is filtered under the by condition:
-
Top List
-
Timeseries
-
Pie Chart
-
Treemap
-
Grouped Table Chart
View Switching and Configuration Retention
After you configure the analysis dimension, aggregation method, Top/Bottom, and return count in the Top List, switching to the List or Stacked List does not clear the analysis configuration. When you return to the Top List, the system restores the last configuration.
- When the current Log Index, time range, query mode, search conditions, and quick filter conditions remain unchanged, existing query results are reused;
- When the query context changes, the original analysis configuration is retained, and the query is re-run with the new context;
- When advanced queries are combined with page analysis configuration, the
BYcondition in the query statement is ignored, and the page analysis dimension takes precedence.
Data Display
Quick Filter Counts and Proportions
Expand the quick filter fields on the left side of the Log Explorer to view the count and proportion of each field value, allowing direct comparison of the distribution of log data. After selecting a field value, you can continue filtering the corresponding logs.
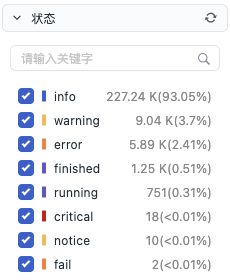
After adjusting the time range or query conditions, to update quick filter items, collapse the corresponding fields and expand them again. For refresh methods, see Quick Filter.
JSON Field Preview
In the Stacked List of the Log Explorer, hover over the JSON preview entry next to a field to view the field content in a tree structure in the preview popover. Click the expand icon before a node to view nested fields and values layer by layer. The field name is displayed at the top of the popover, and the Copy All icon in the upper-right corner copies the complete field value.
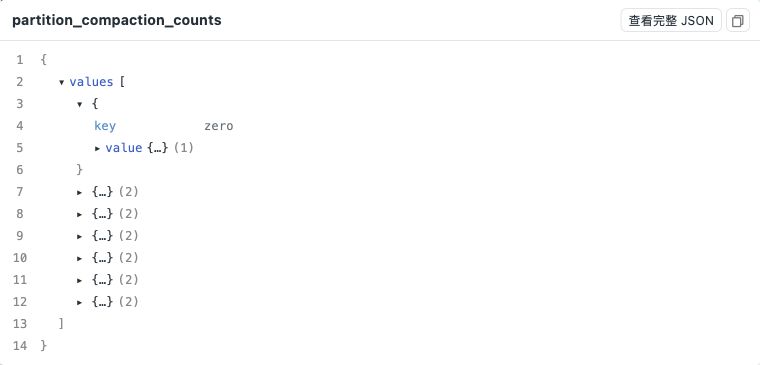
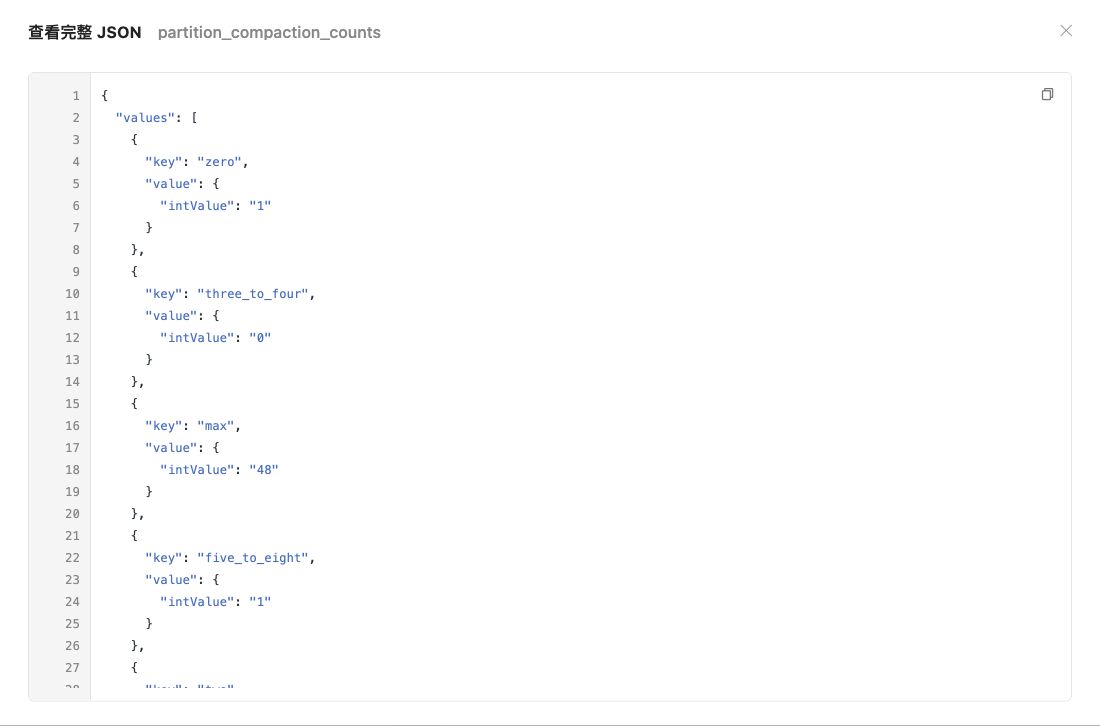
To read large JSON content, click View Full JSON to open the full content dialog. The dialog supports:
- Fully expanding the JSON structure to view content at each level;
- Scrolling within the dialog to browse longer JSON;
- Copying the complete JSON content for further analysis.
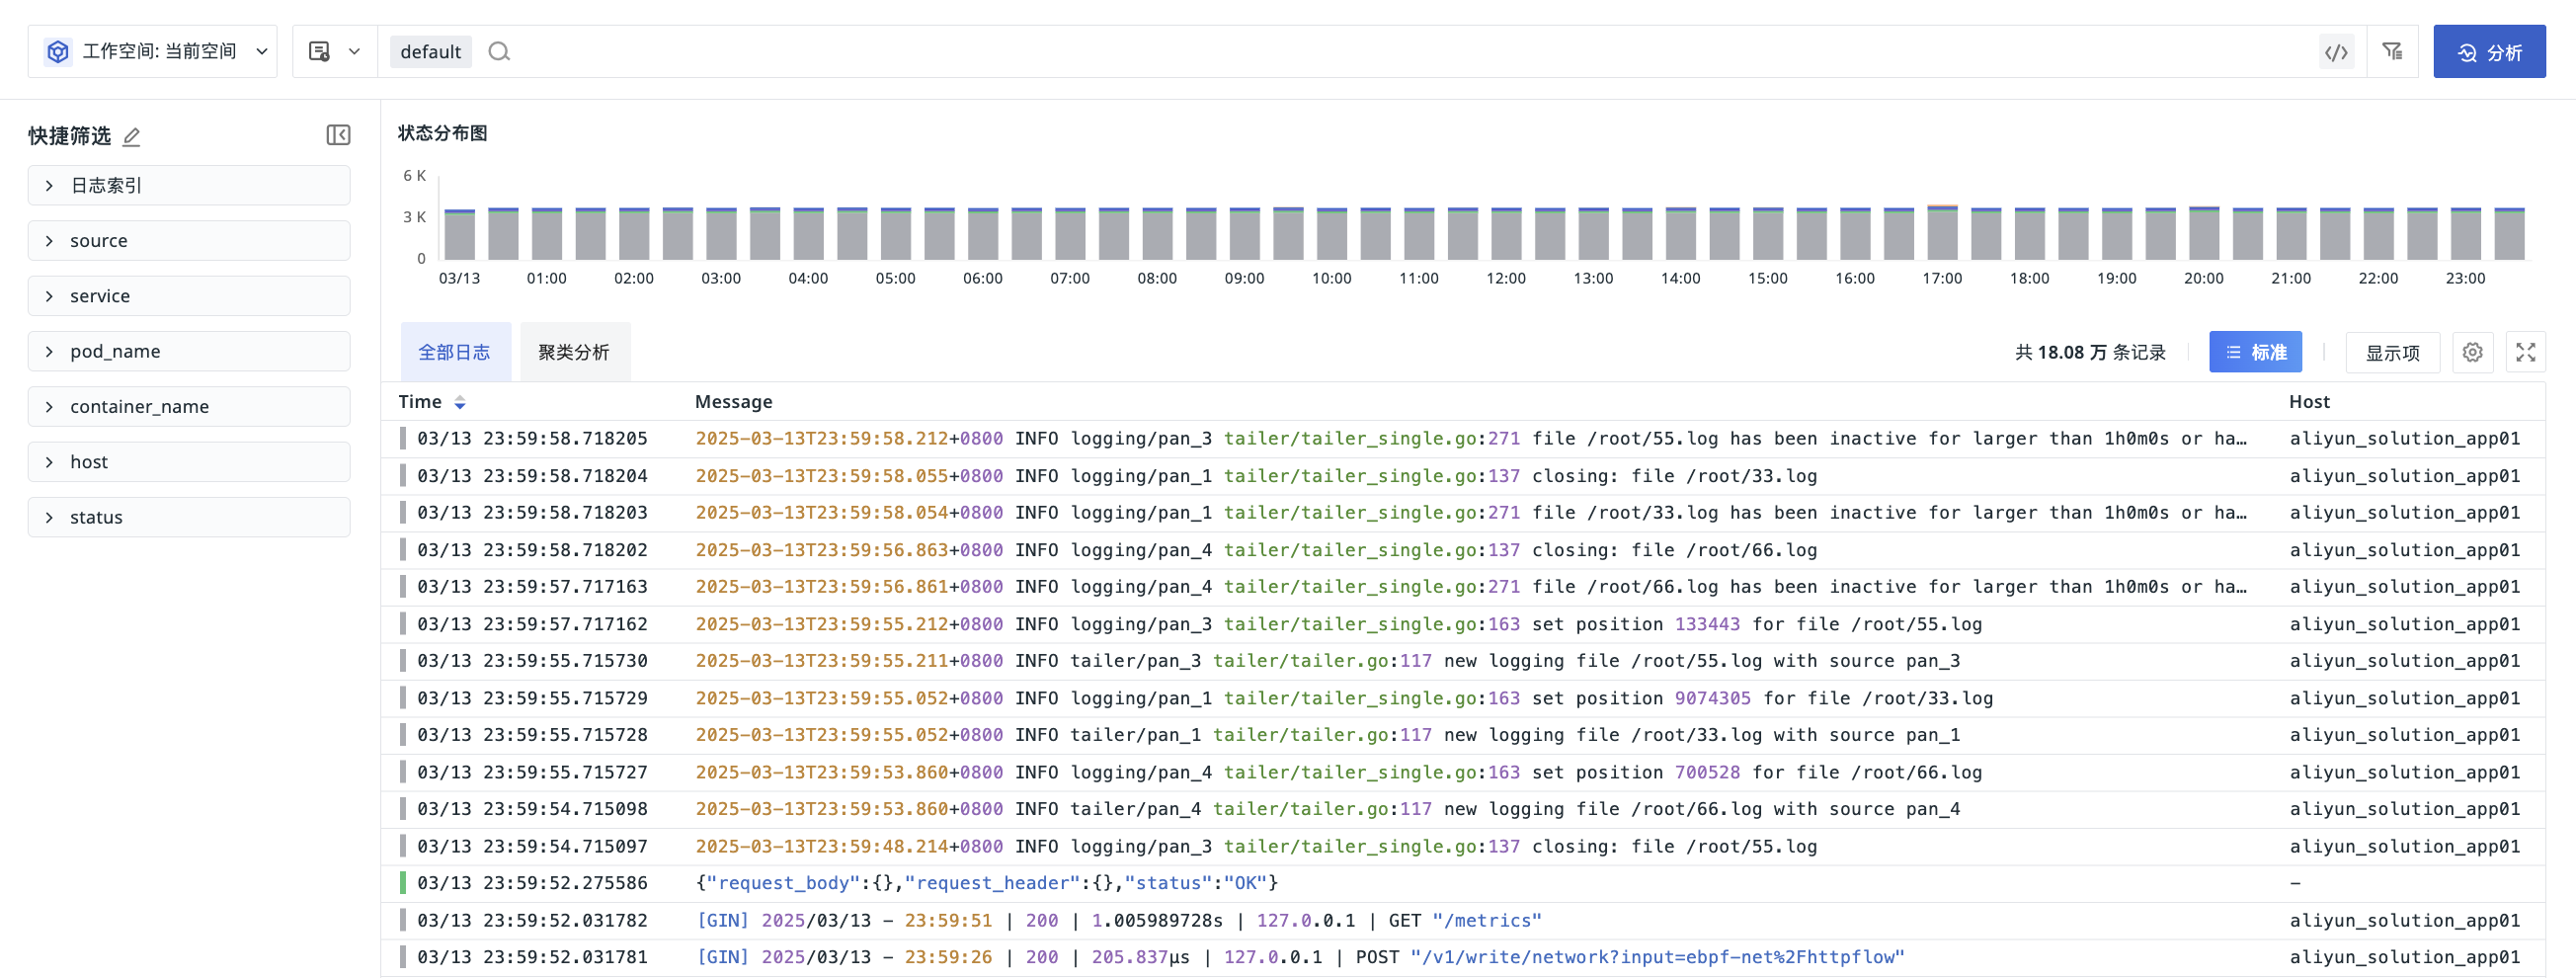
All Logs
By default, queries use the standard log indexes in the current Workspace and do not automatically include cloned indexes. To query cloned data, explicitly select the corresponding cloned index in the index list on the left.
Browse Modes
The log data list supports two browse modes: pagination and scroll loading. You can select the desired mode in Preferences.
Pagination controls are available at the top of the Log Explorer and at the bottom of the data list. You can switch pages or jump to a specific page directly at the top without scrolling to the bottom of the list.
With pagination, you can perform the following operations:
- Switch to the previous or next page;
- Enter the target page number in the top pagination input box and press Enter to jump; you can also switch pages through the bottom pagination controls;
- Adjust the number of items displayed per page in the bottom pagination controls.
The pagination state at the top and bottom stays synchronized; switching pages in either location updates the other accordingly.
Retains the original continuous browsing mode. When you scroll to the bottom of the current data list, the system continues loading subsequent logs.
Switching browse modes does not change the current Workspace, Log Index, time range, search conditions, or quick filter conditions.
Log Visibility Delay Notice
After log visibility delay is enabled, the Log Explorer displays the delay duration actually applied to the current query.
- When querying a single index, the delay time configured for that index is applied;
- When querying multiple indexes with different delay times, the longest delay time applies to the entire query, and the Explorer displays a corresponding notice;
- When the query time range falls entirely within the delay window, the Explorer prompts you to adjust the time range or retry later. You can adjust the query time range to before the delay window, or wait until the logs for the target period are visible and query again.
For example, if the current time is 10:30 and the delay time applied to the current query is 10 minutes, querying logs from 10:25 to 10:30 falls entirely within the delay window, so you need to adjust the query time range or retry later.
For configuration methods and the affected scope, see Log Visibility Delay.
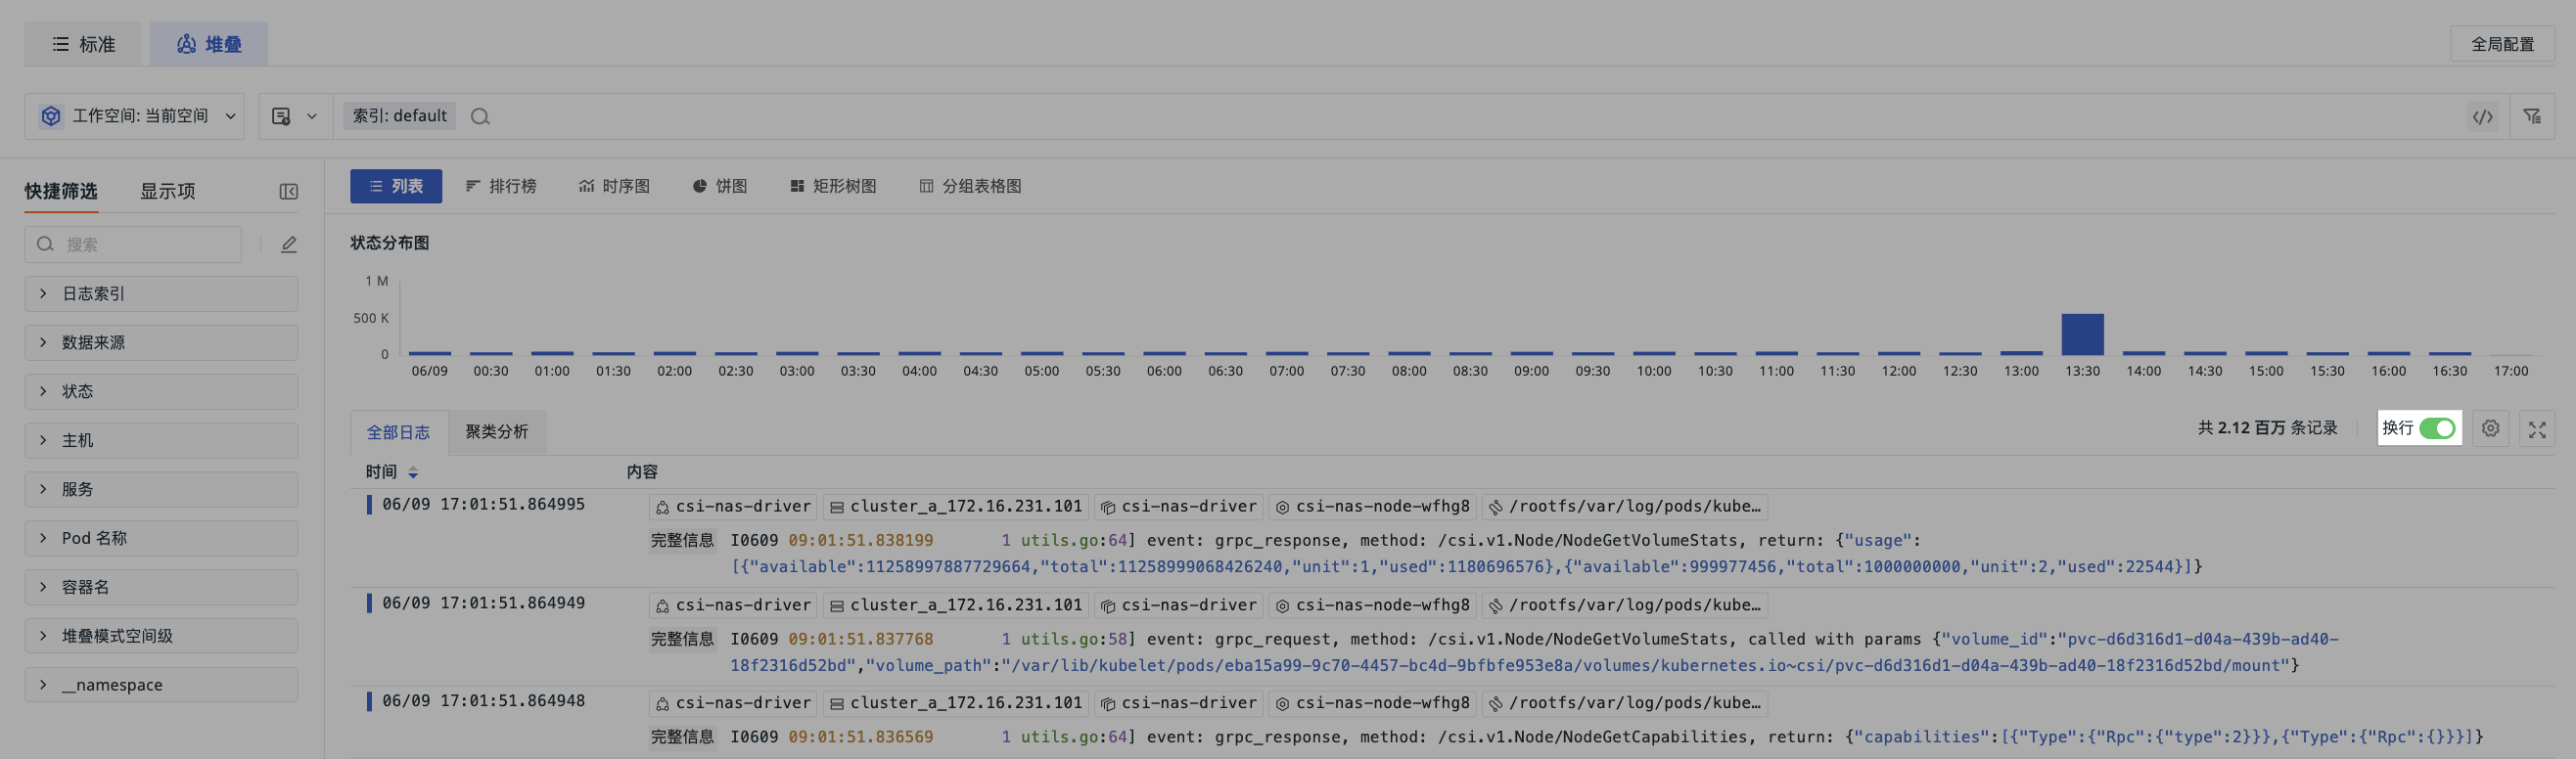
Line Break
In the Stacked List, if a single log contains many data elements, click the Line Break button to display the message part of the log on a separate line.
Pattern
The Log Explorer provides an efficient clustering feature that performs similarity analysis on logs based on the message field and automatically displays the most recent 50 logs. You can also customize the clustering fields. After selecting a time range in the Time Widget, the system analyzes 10,000 logs in that period and aggregates similar entries.
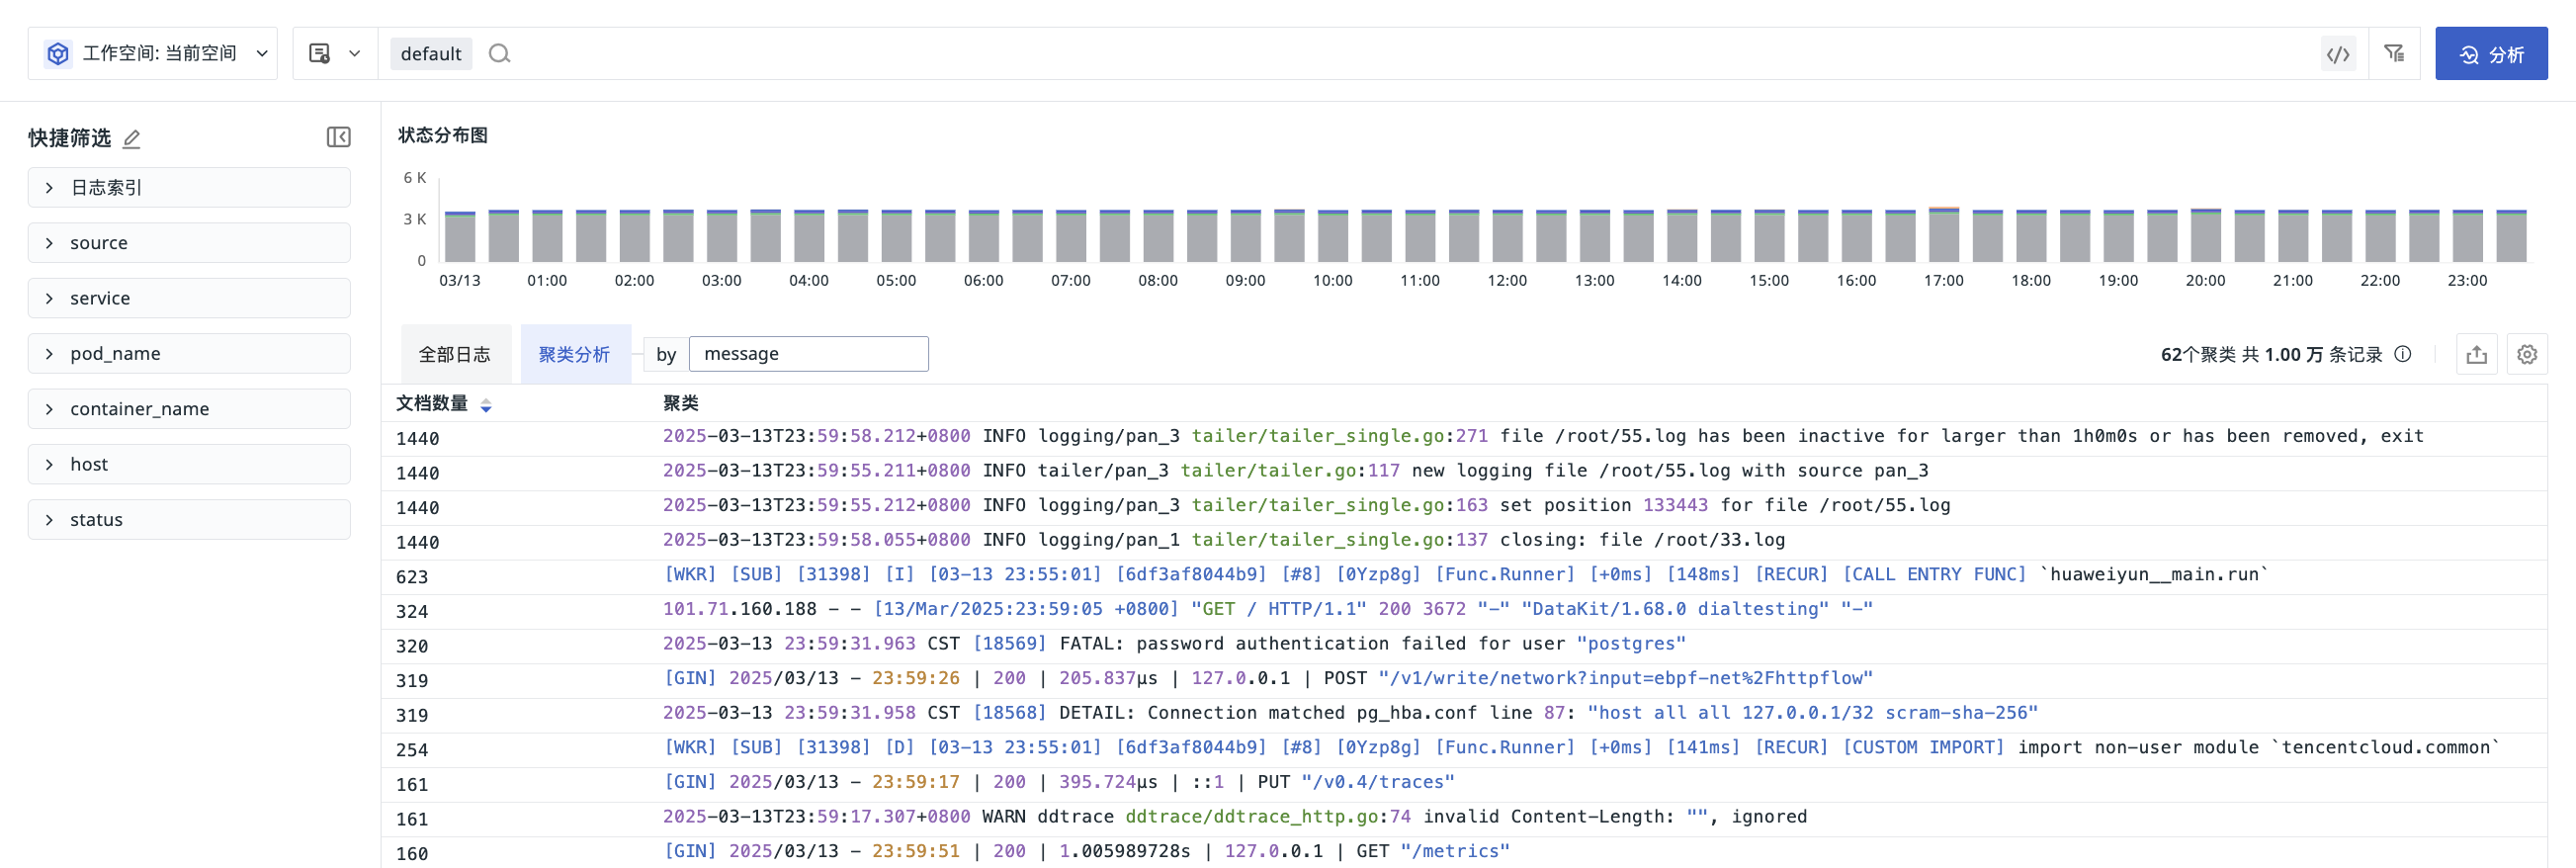
In the Pattern list, you can manage data with the following operations:
-
Click & to sort by document count (descending by default);
-
Click to choose to display 1 line, 3 lines, 10 lines, or all content;
-
Click to export all clustered log data.